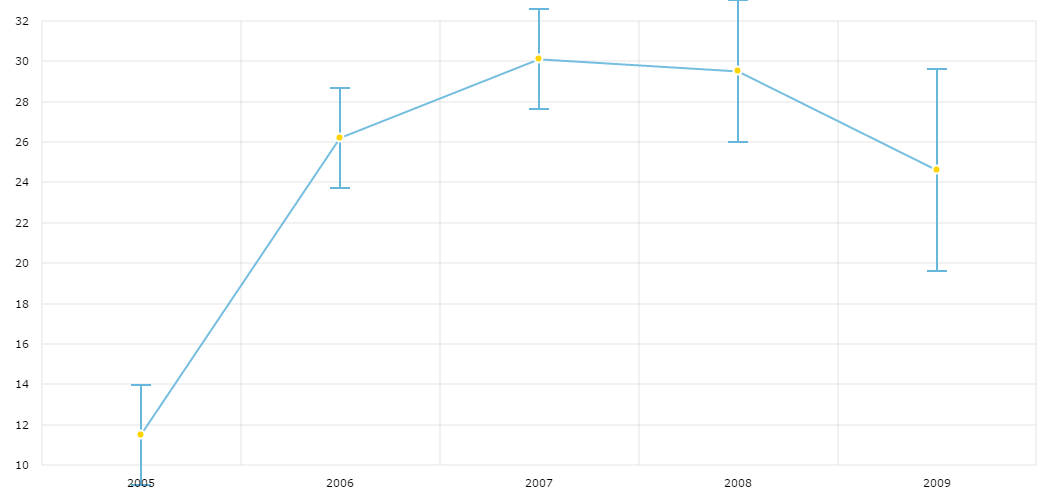
Error Chart
Error bars are show the variability of data and are used on graphs to indicate the error, or uncertainty in a reported measurement. They give an idea of how far from the reported value the true value might be.
Error chart using amCharts
In our case, error chart is a regular serial chart with special type of bullets – yError. As you might guess, there is also xError bullet type, but it can only be used by Scatter/Bubble chart for showing the error on x axis. To make the chart show error bar, you need to set “bullet”: “yError”, also “bulletAxis”: “v1” where “v1” is id of the axis which is used to determine the size of the bar and finally, “errorField”: “error” – the name of the field in your data provider which holds error value. The size of horizontal dash is defined by “bulletSize”: 10.
Demo source