Multiple Data Sets
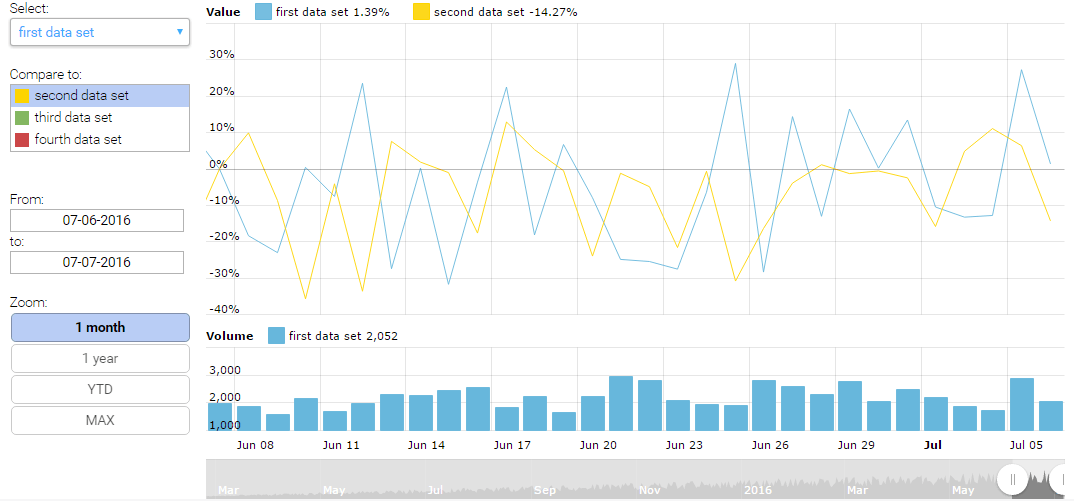
Stock chart is a great tool which will save your time. It is designed to work mostly with financial data, but can be used for other purposes as well. Our Stock chart supports multiple data sets and has a ready to use data set selector (at the left, although you can adjust position to your needs). Data sets might be compared one to another. You can compare absolute values or percent values, as this is quite an often practice when dealing with prices of securities or stocks.
Data grouping into longer periods
If you roll-over the chart so that chart cursor would appear, you will notice that each data point represents one day. This is quite expected, as we provided daily data for this chart. Now, zoom-out to “year” view by clicking on the 1 year button at the bottom and roll over the chart again – now, data points jump at 7 days (one week) interval. Again, zoom-out to the max so that all the data is visible. One data point represents one month now!
Did we had to provide data for the different periods? No, the chart did all the grouping itself. We recommend reading Understanding data grouping tutorial to get more information about this great feature.
Demo source