GANTT Chart
GANTT chart is a modification of a bar chart, showing several segments, not necessarily attached to each other. It can be used to mark spans of time, date or values.
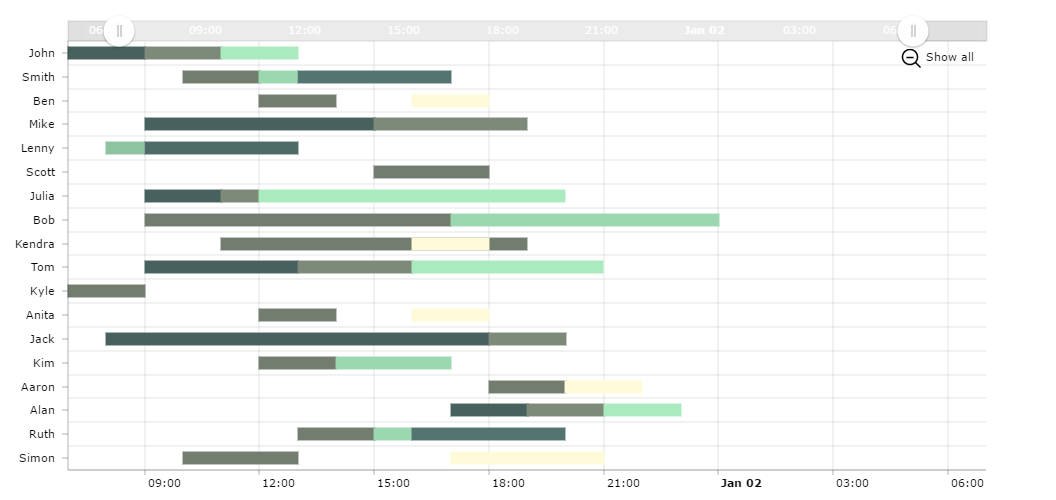
The most obvious and wide use for GANTT chart is to show person’s or team’s tasks span over time as well as relationships between those tasks.
This particular demo uses hours as segment duration parameter. The units used in it are defined by period parameter.
For a GANTT chart which uses absolute dates for segment start and end, check out this demo.
Demo source