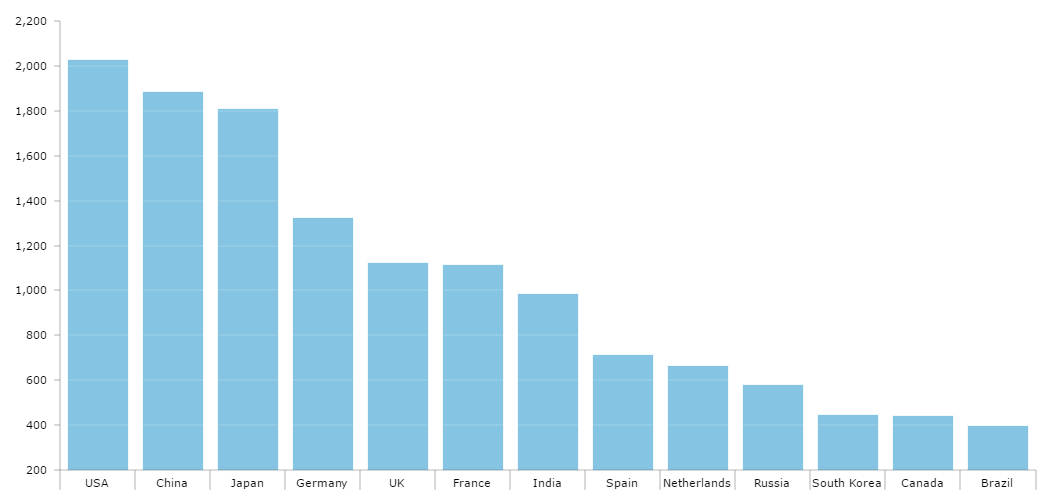
Simple Column Chart
If you take a close look at this chart, you will notice that grid lines are above the columns – equally dividing them into segments. This is an optional feature, of course. It allows you creating the charts close to the ones described by famous data visualization guru, Edward Tufte, in his book “The Visual Display of Quantitative Information”.
From columns to bars – one simple step
Click EDIT button on top of the chart, and add this text to the source (anywhere within curly brackets): “rotate”:true,. Run the script and… The columns should became bars, category axis should be vertical now and value axis – horizontal! This is the only property you change to make this trick. All our Serial charts can be rotated in the same way.
Demo source