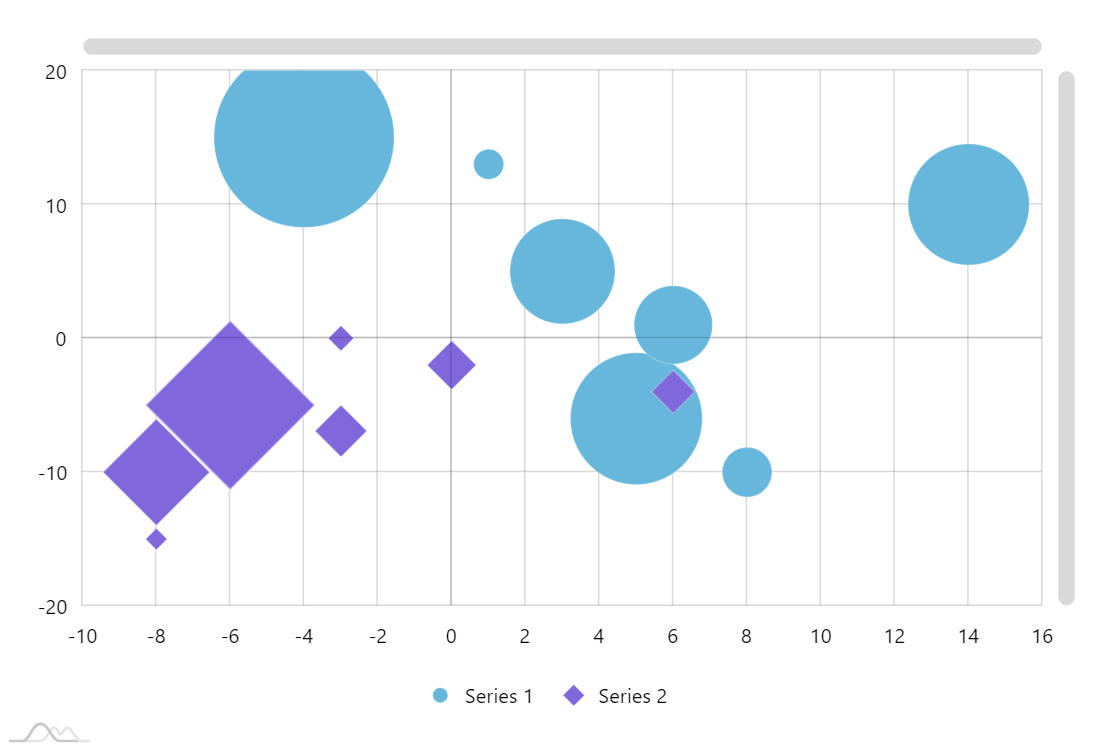
Bubble chart displays three dimensions of data: 2 dimensions are represented by the x,y position of the data point, and the third one is represented by its size.