Primary Menu
amCharts
Products
Charts
Maps
Stock Chart
Gantt
Pro Services
Demos
amCharts & AI
Download
Buy
Support & Licenses
Docs
Find us on
Search for:
amCharts 4 Demos
Fancy Data-Viz
Chart Types
Column & Bar
Line & Area
Pie & Donut
XY & Bubble
Maps
Candlestick & OHLC
Stock
TimeLine
Pictorial
Gauges
Radar & Polar
Hierarchy
Flow
Funnel & Pyramid
Miscellaneous
Back to amCharts 5 demos
Fancy Data-Viz
Coronavirus animated dashboard
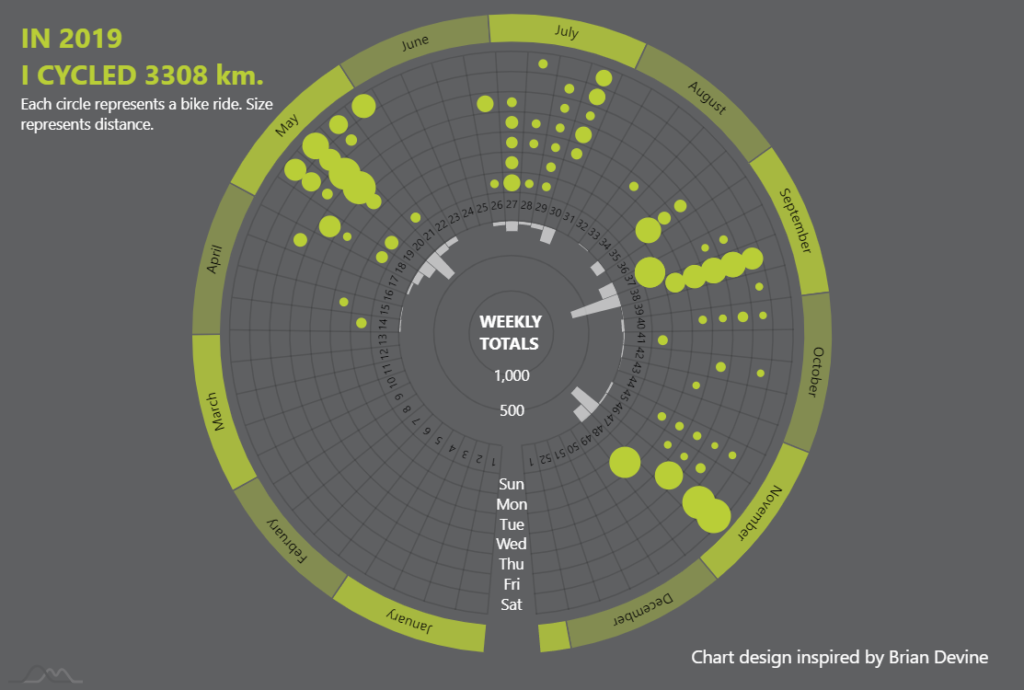
Radar Chart visualizing yearly activities
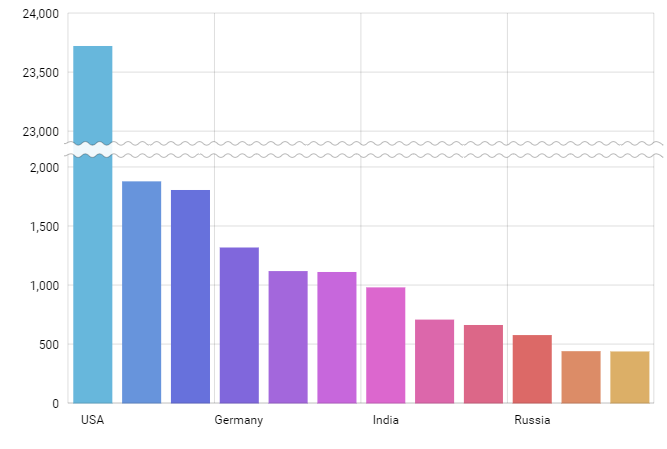
Column chart with axis break
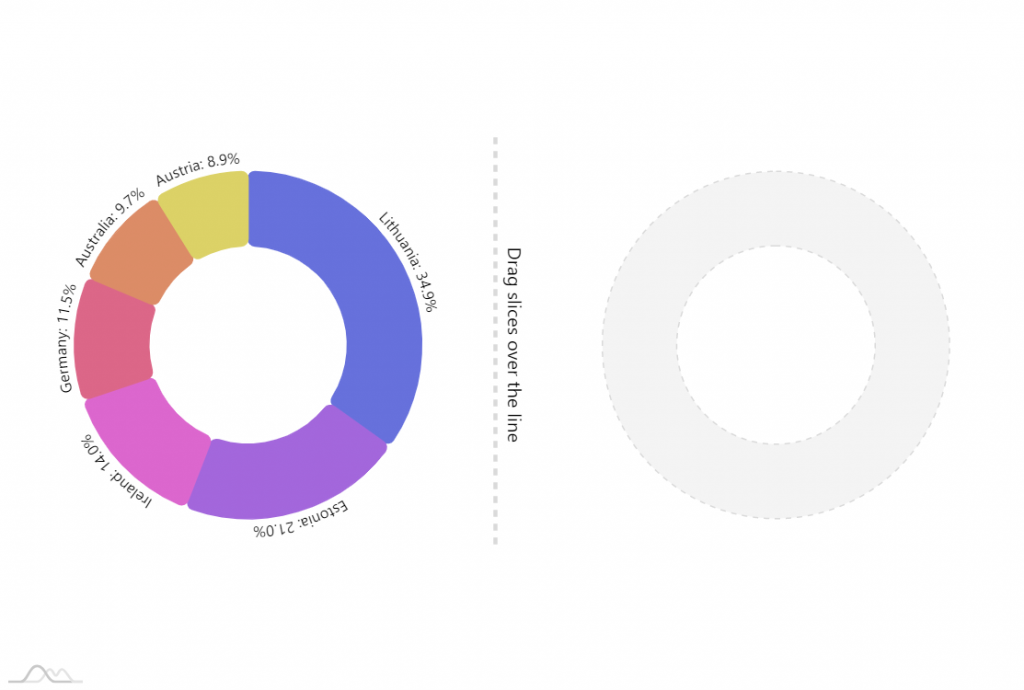
Dragging Pie Slices
Coronavirus animated dashboard (U.S.)
Toggleable chord diagram
Chord diagram with animated bullets
Animated Sankey Diagram
Radar timeline
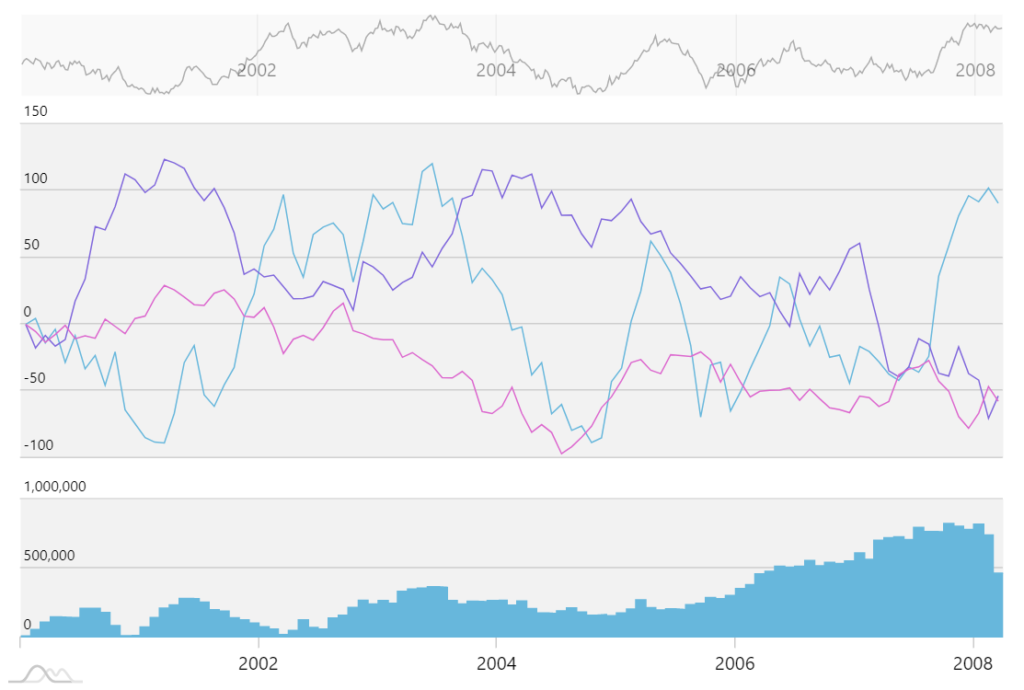
Map, line chart & gauge
Countries morphing to heart
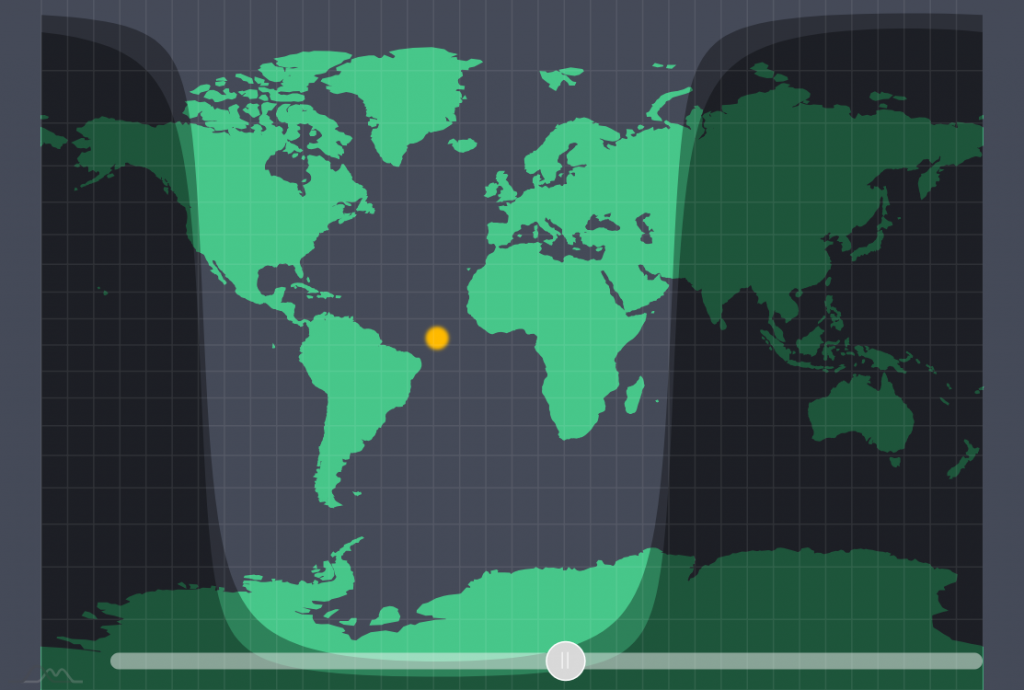
Day and Night World Map
Countries morphing to pie charts
Bar chart race
Live sorting of Radar columns
Chart Types
This category contains basic demos representing base chart categories as defined by
Data Viz Project
. Use these charts to start our own, or scroll down for more demos.
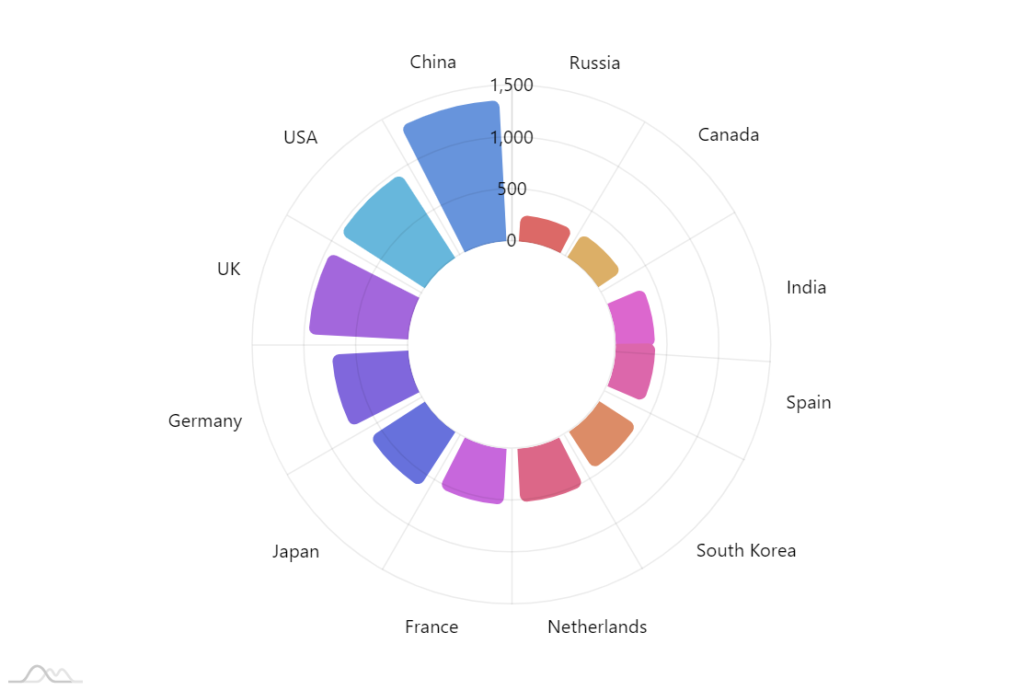
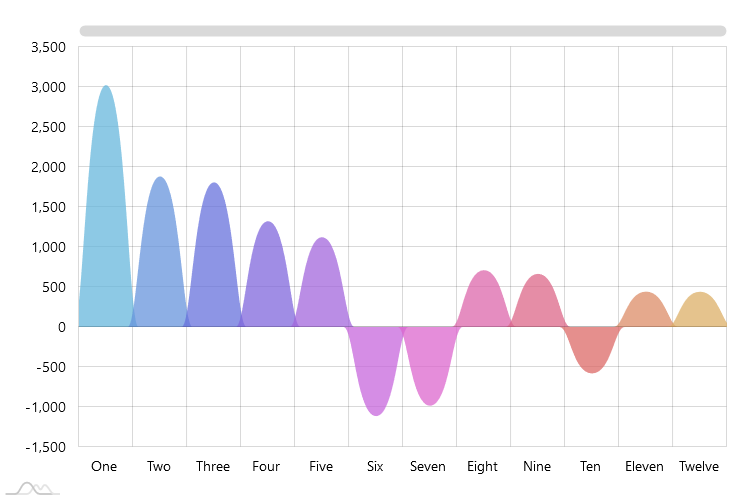
Radial Histogram
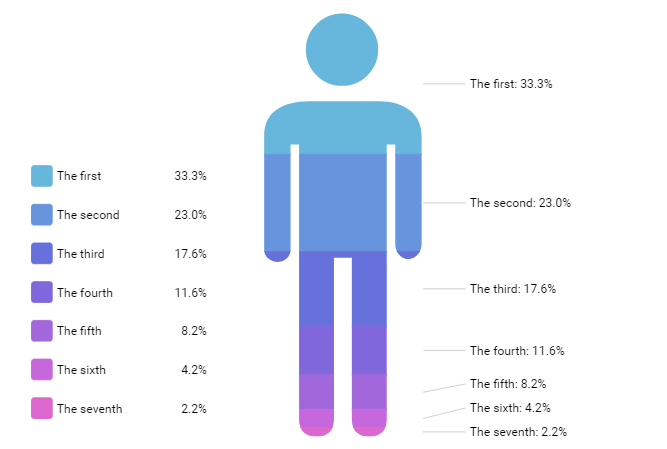
Pictorial fraction chart
Polar area chart
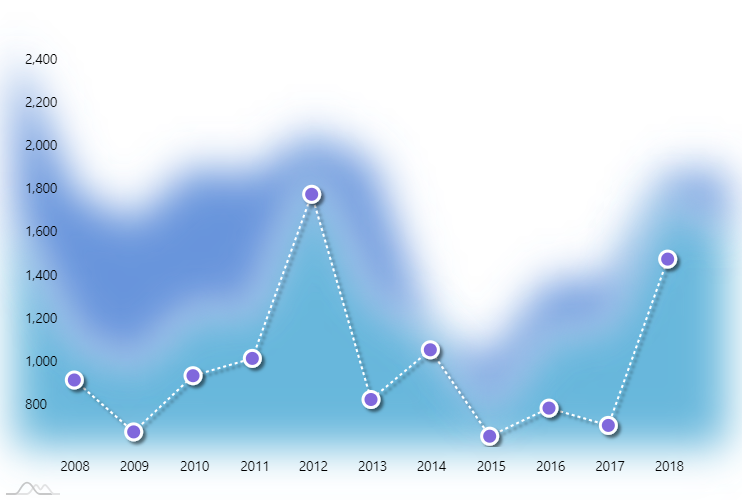
Line graph
Radial line graph
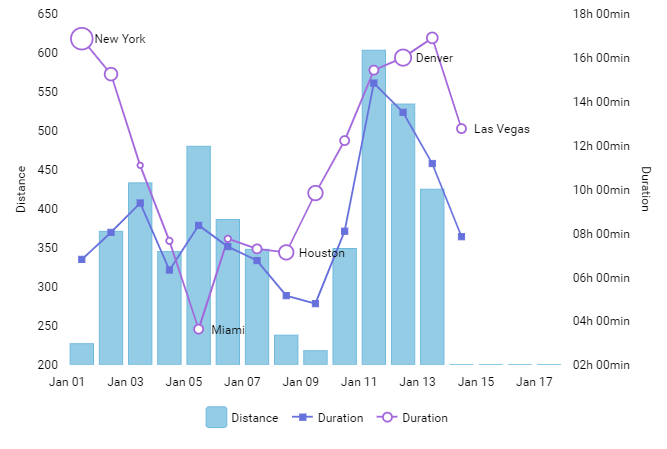
Dumbbell plot
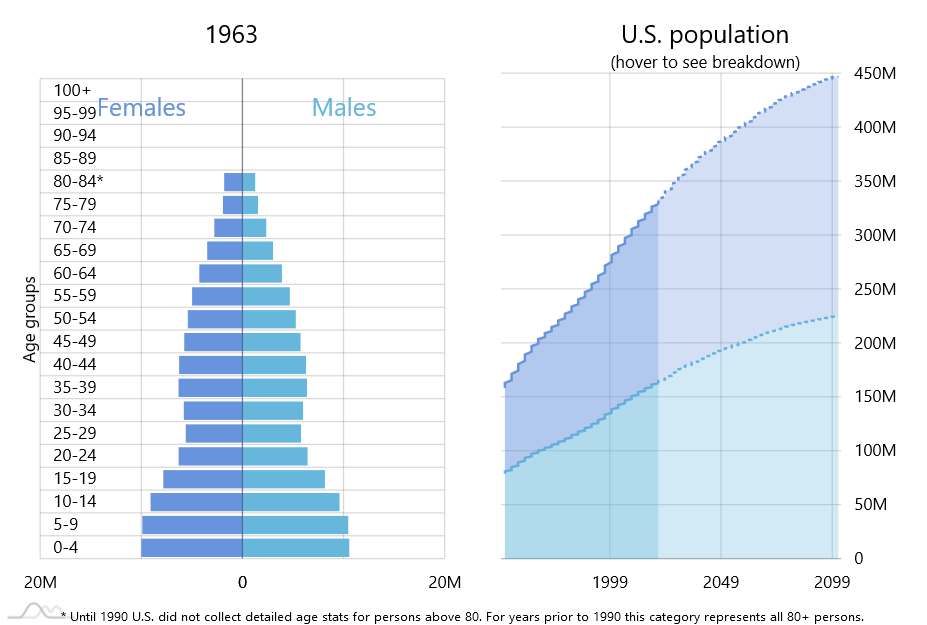
Population pyramid
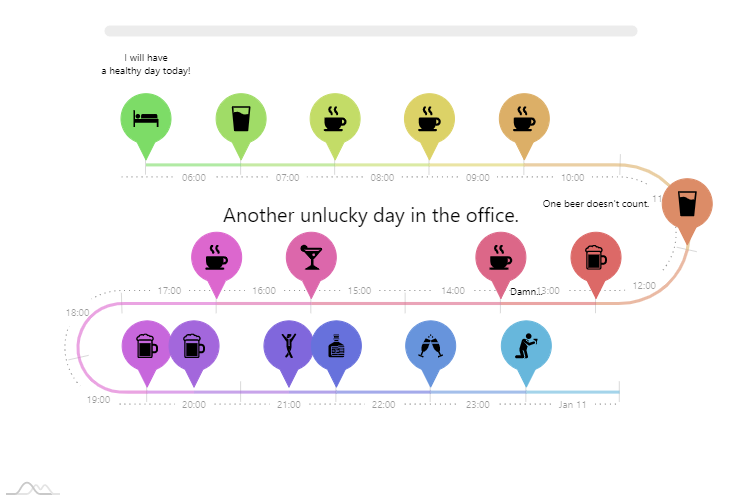
Timeline
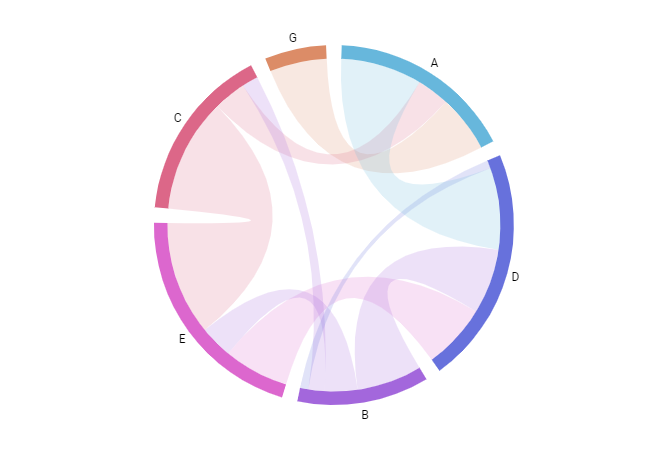
Chord diagram
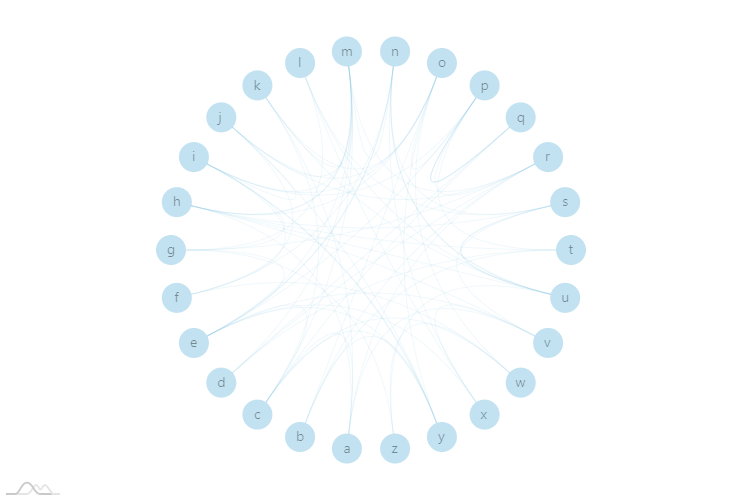
Non-ribbon Chord diagram
Bubble Chart
Force-directed tree
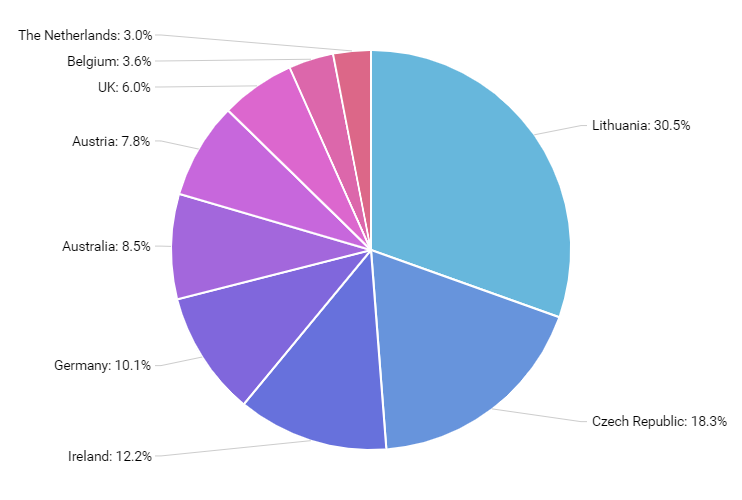
Simple Pie Chart
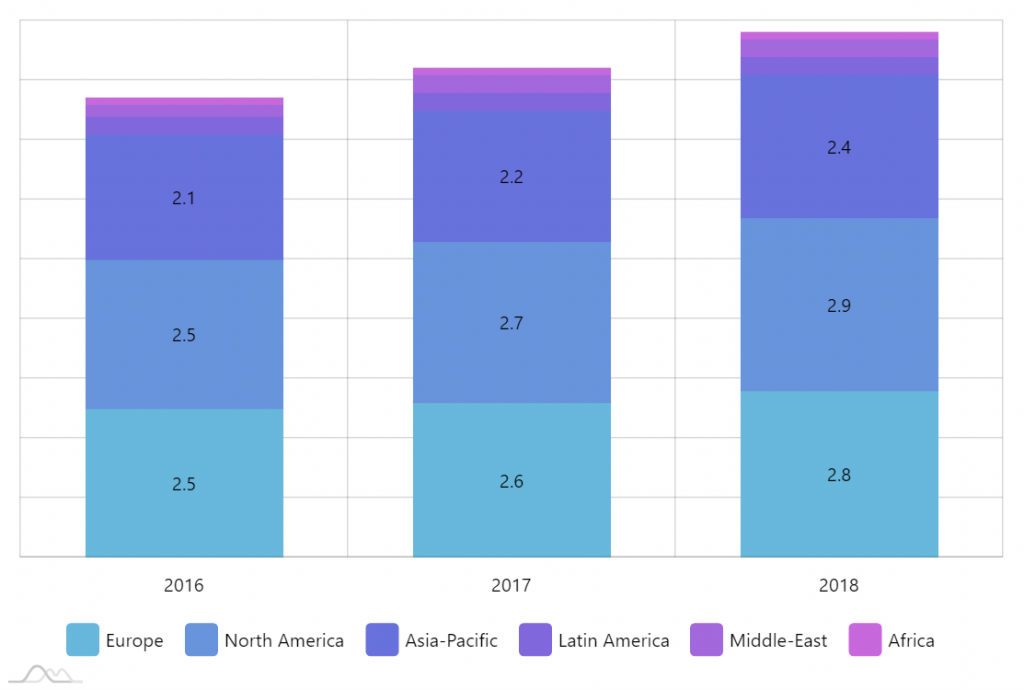
Stacked Column Chart
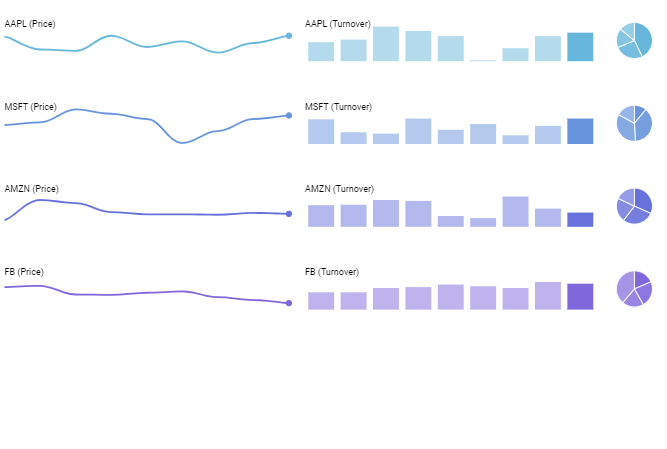
Micro Charts & Sparklines
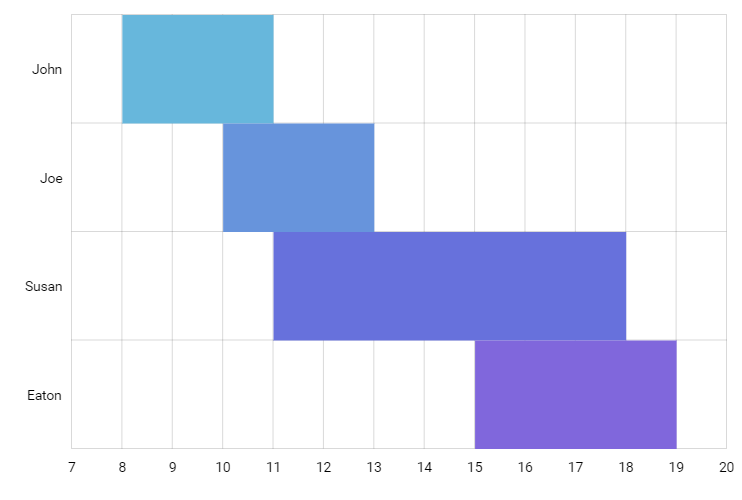
Gantt Chart
Stacked Area
Venn diagram
Range area chart
Step Line Chart
Scatter Chart
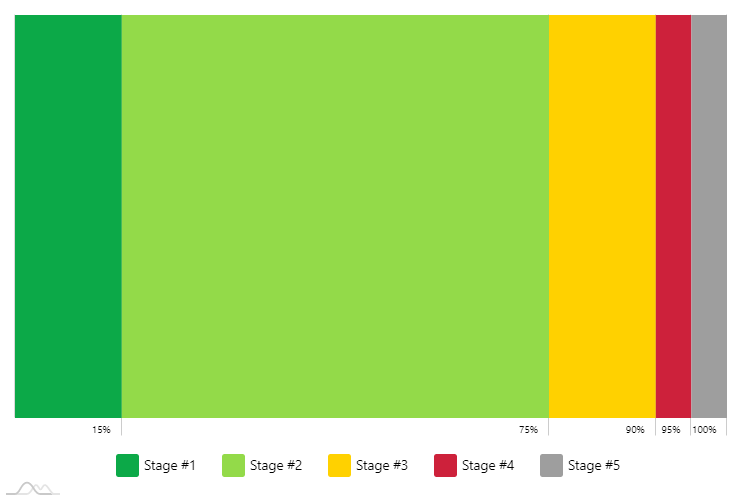
Bullet Chart
Waterfall Chart
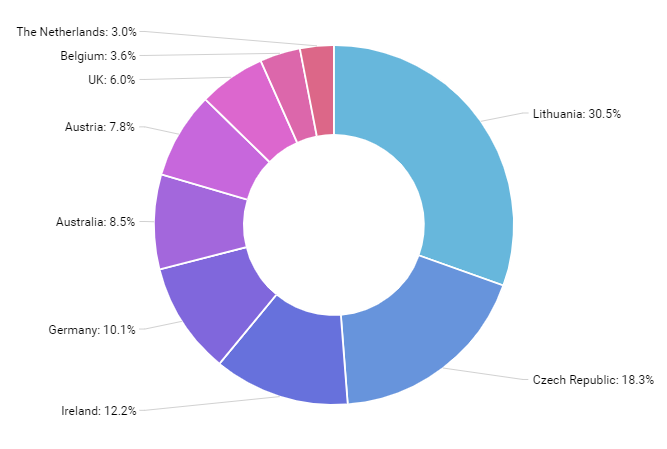
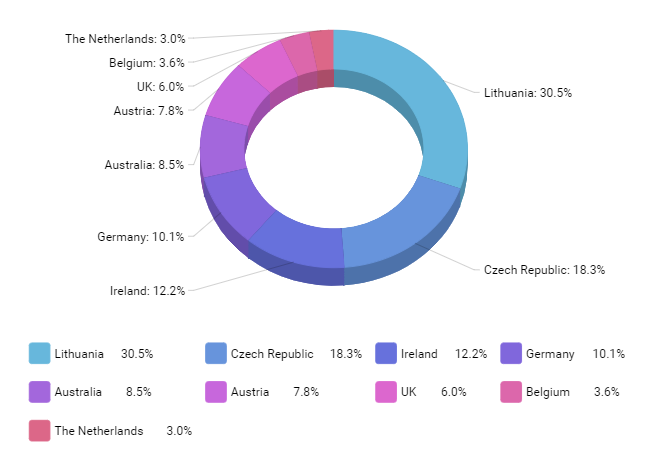
Donut chart
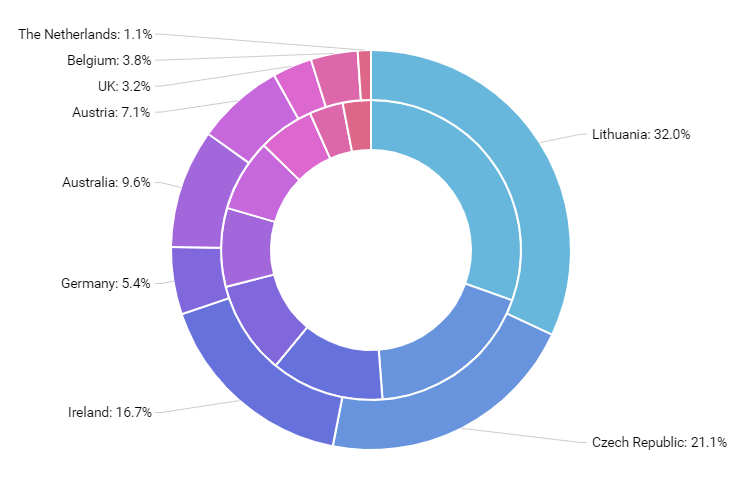
Nested donut chart
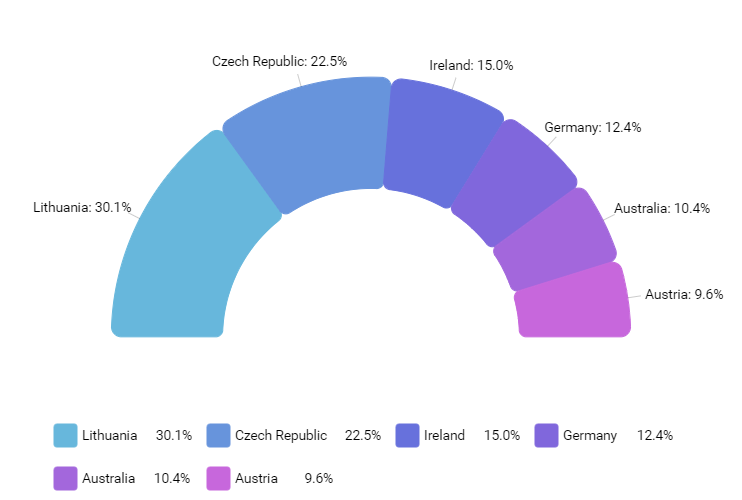
Semi-circle Pie chart
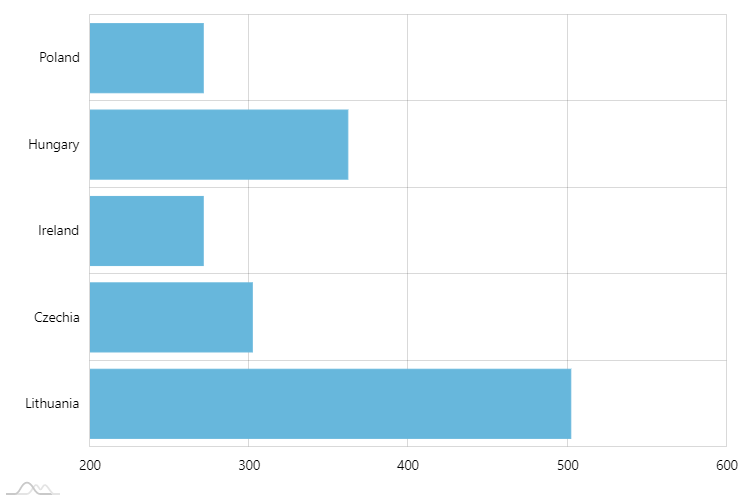
Clustered Bar Chart
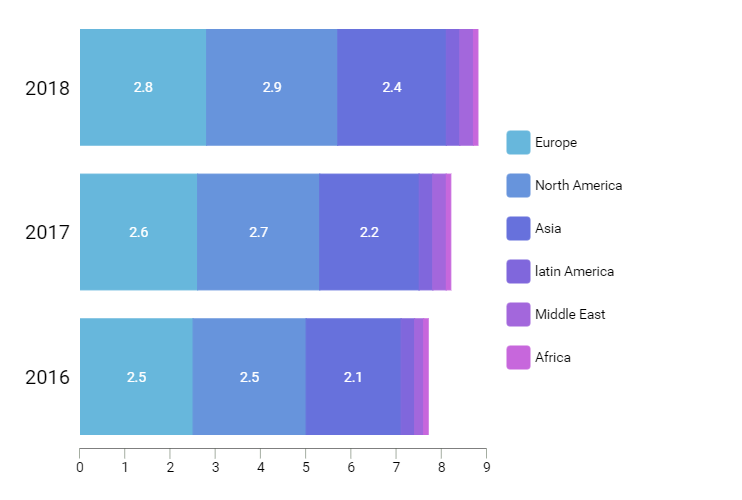
Stacked Bar Chart
Radial bar chart
Heat map with Legend
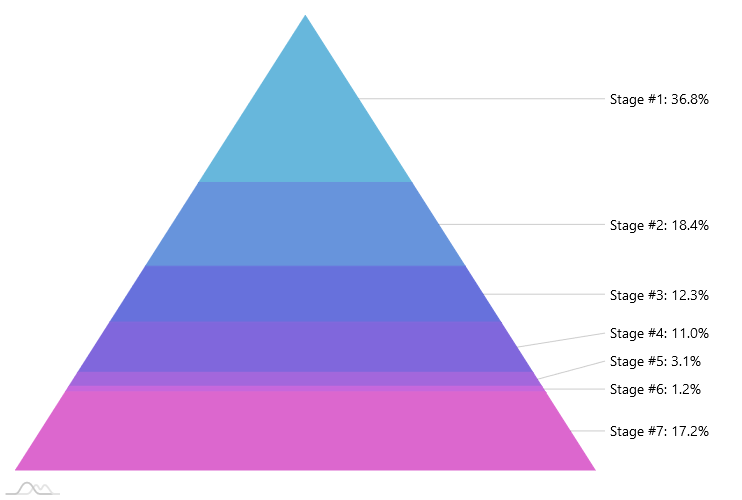
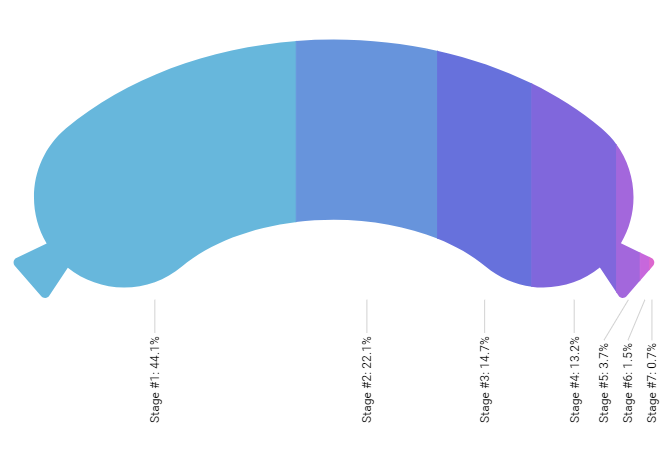
Pyramid Chart
Curved columns
Angular Gauge
Solid Gauge
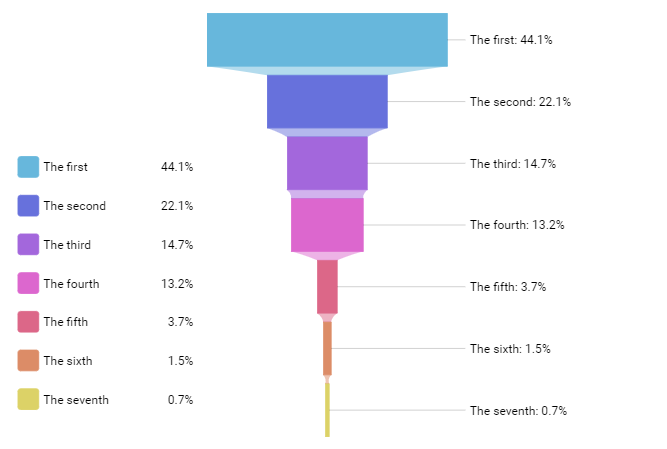
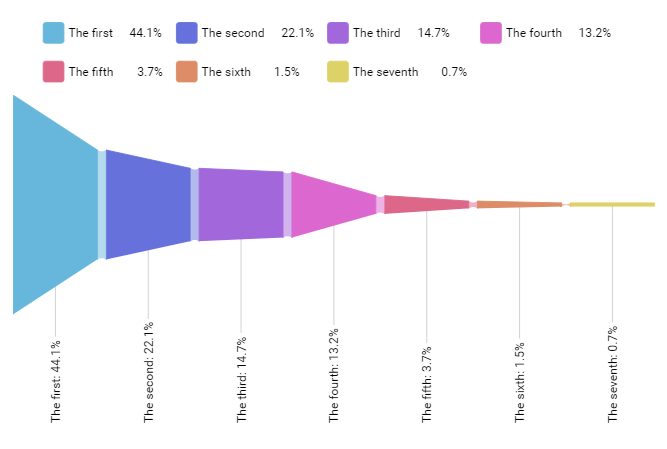
Funnel chart
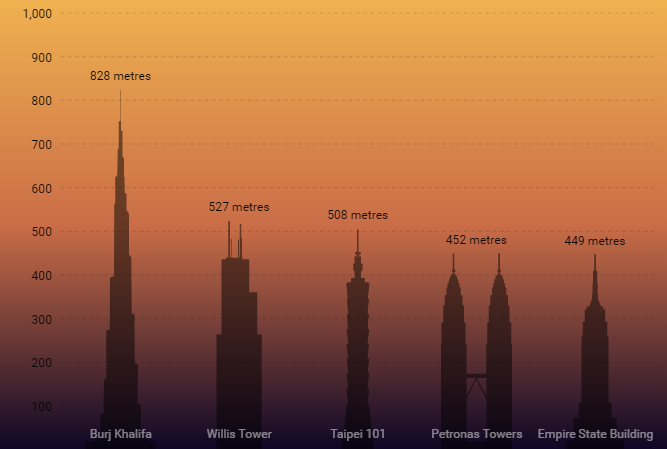
Pictorial column chart
Map with Bubbles
Pictorial Stacked Chart
Simple Treemap
Stream / ThemeRiver chart
Column & Bar
Pareto diagram
Triangle column chart
Bars with moving bullets
Partitioned bar chart
Columns with moving bullets
Lollipop Chart
Real time data sorting
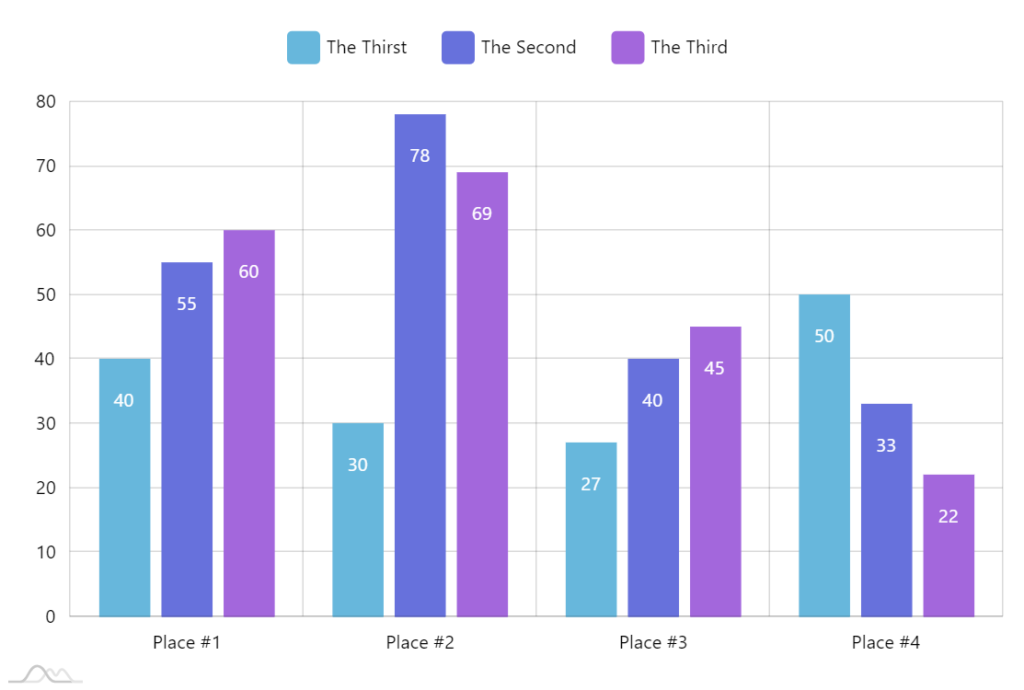
Clustered column chart
Variable-width curved column chart
Sorted bar chart
Column With Rotated Series
Simple Column Chart
Grouped and sorted columns
Gantt Chart with dates
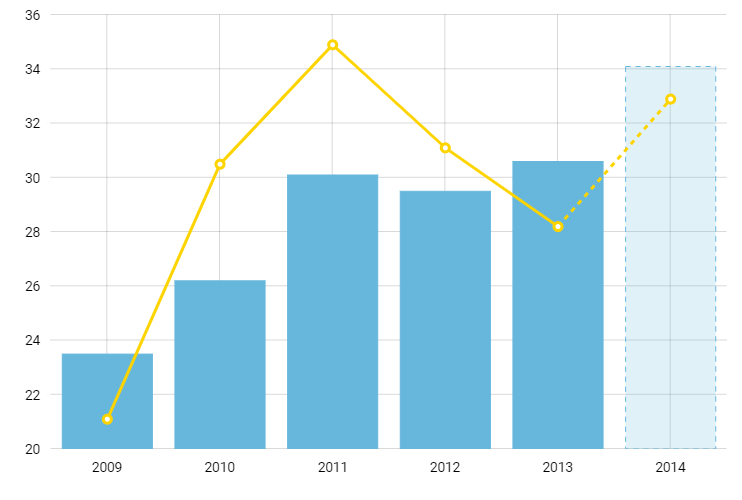
Column and Line mix
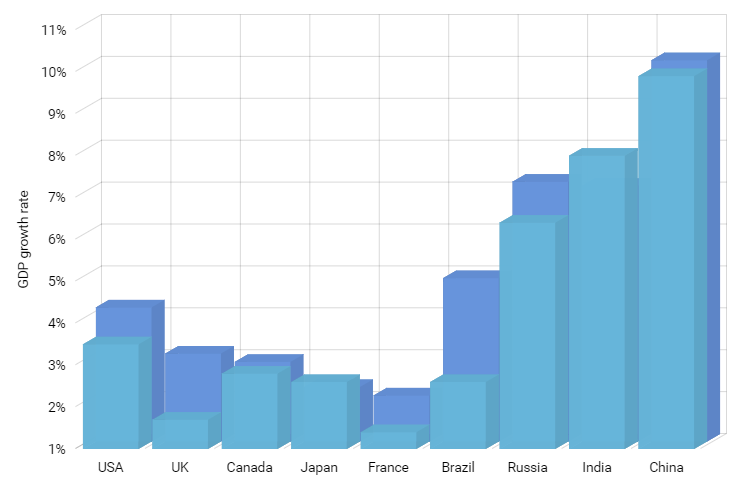
3D Cylinder Chart
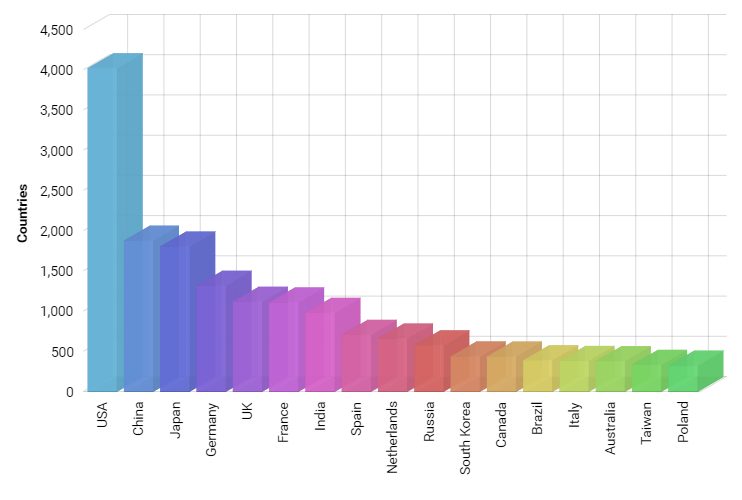
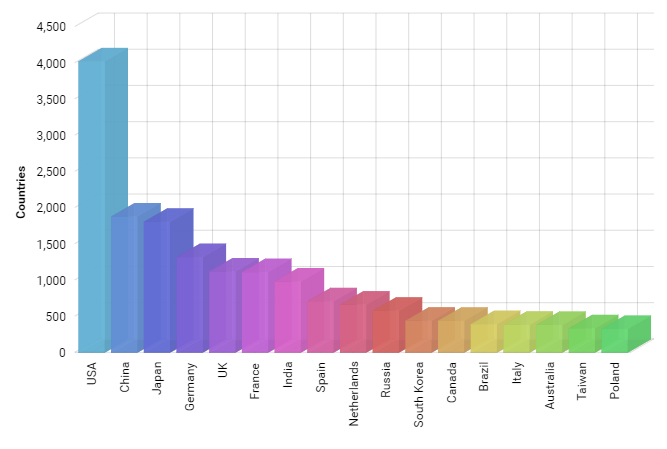
3D Column Chart
Stacked bar chart with negative values
Layered Column Chart
3D Stacked Column Chart
100% Stacked Column Chart
Stacked and Clustered Column Chart
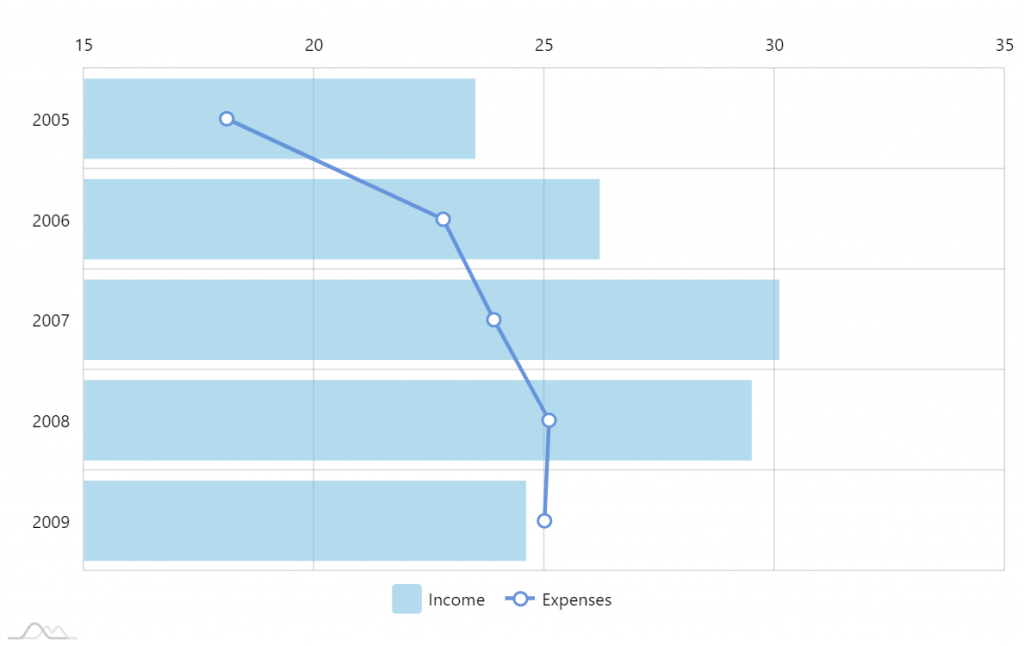
Bar and line chart mix
Floating Bar Chart
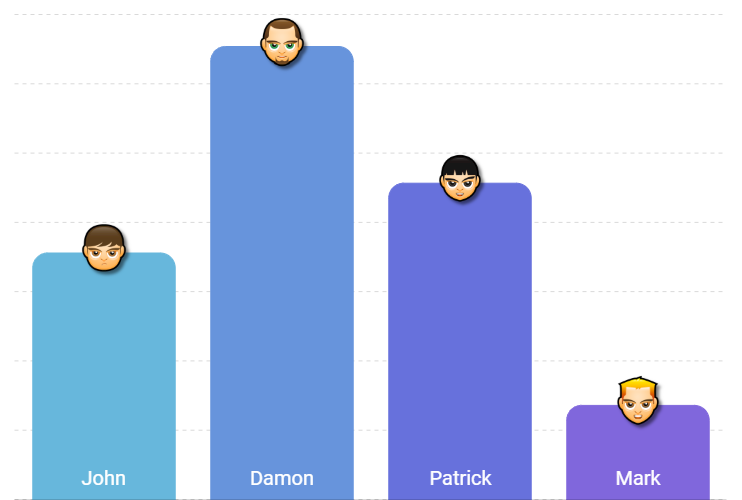
Column chart with images on top
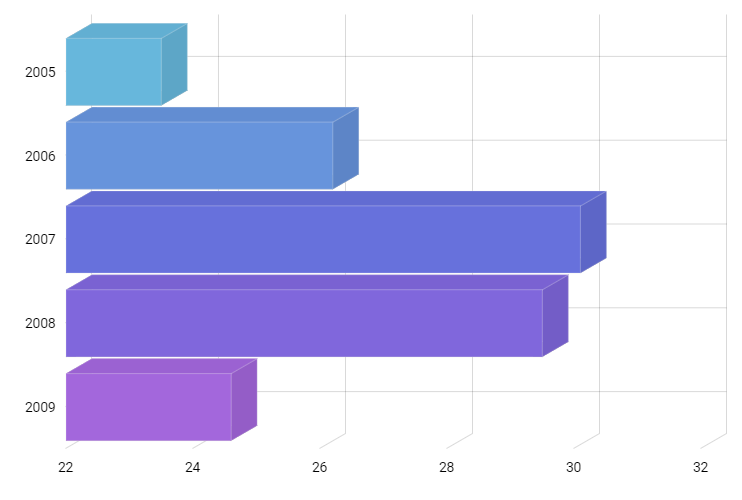
3D Bar Chart
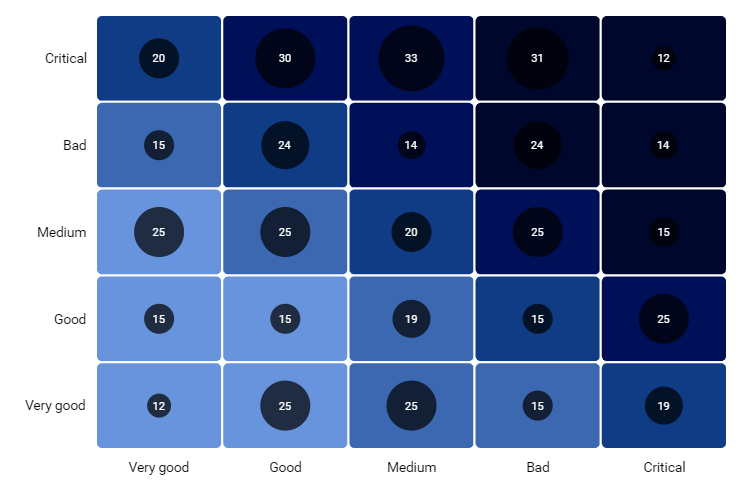
Risk Heatmap
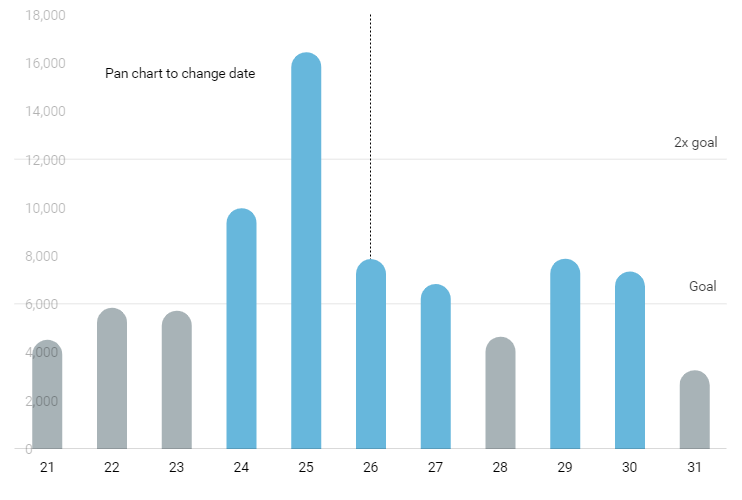
Step count chart
Divergent stacked bars
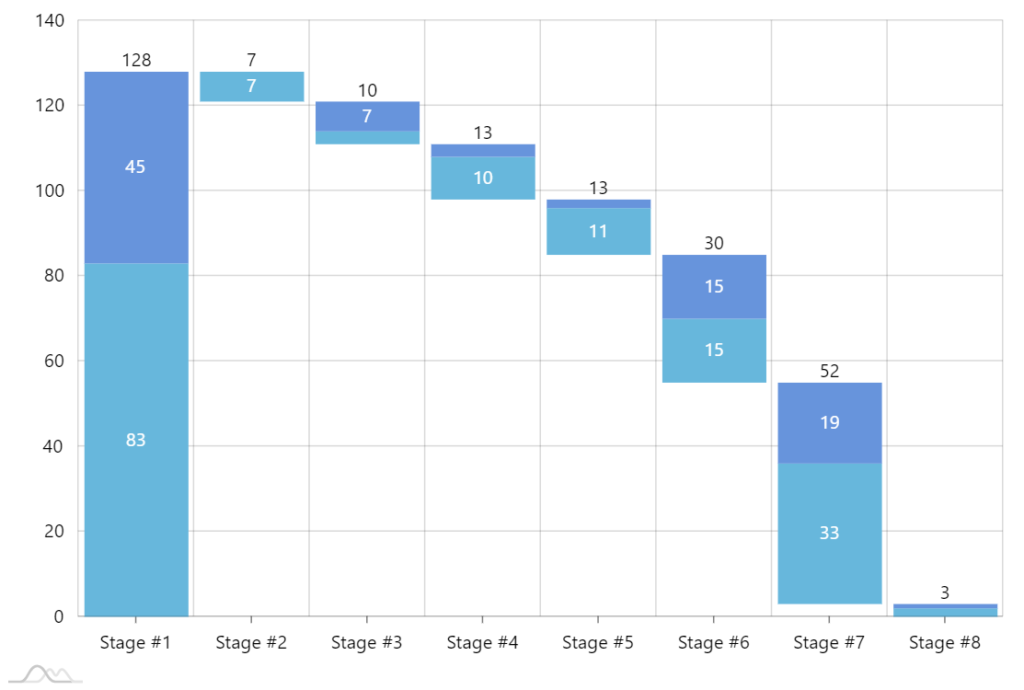
Stacked waterfall chart
Images as categories
Waffle chart
Line & Area
Data grouping 50K points
Highlighting line chart series on legend hover
Line chart with range slider
Range chart with different fill colors
Date Based Data
Line Chart with Scroll and Zoom
Comparing different date values Google analytics style
Drawing chart series with mouse or touch
Duration on Value Axis
Animated bullet at the end of the series
Line with different colors for ups and downs
Zoomable Value Axis
Smoothed Line Chart
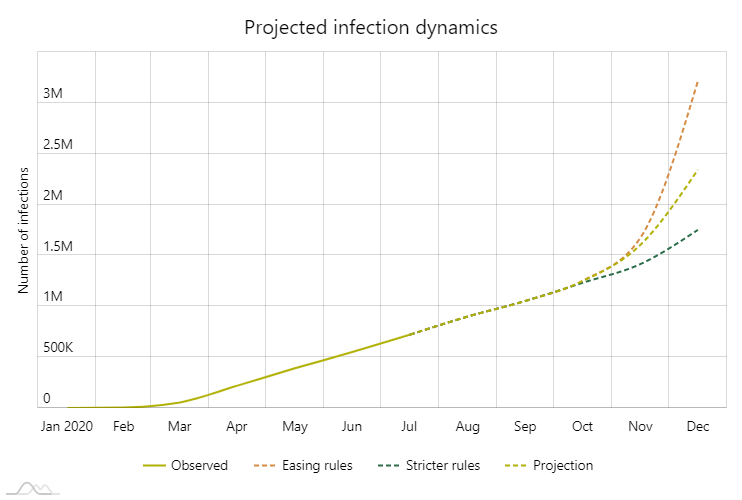
Trend Lines
Line With Changing Color
100% stacked area chart
Area With Time Based Data
Step Line Without Risers
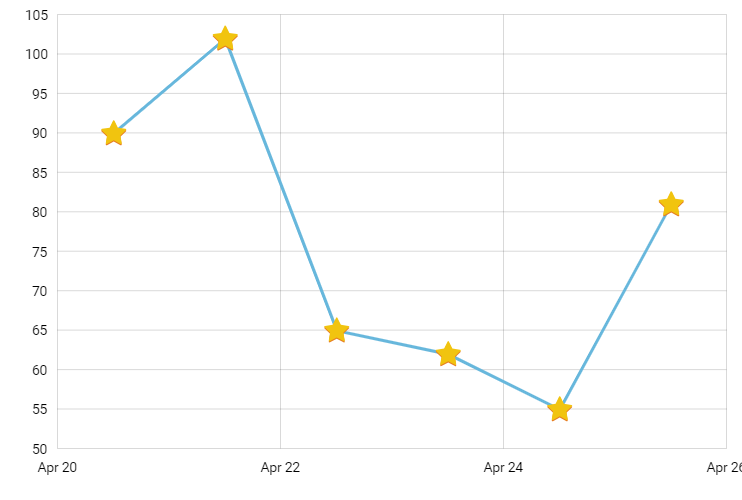
Line With Custom Bullets
Vertical Line Chart
Chart With Gaps In Data
Reversed Value Axis
Multiple Value Axes
Multiple Date Axes
Logarithmic Scale
Mixed daily and intra-day chart
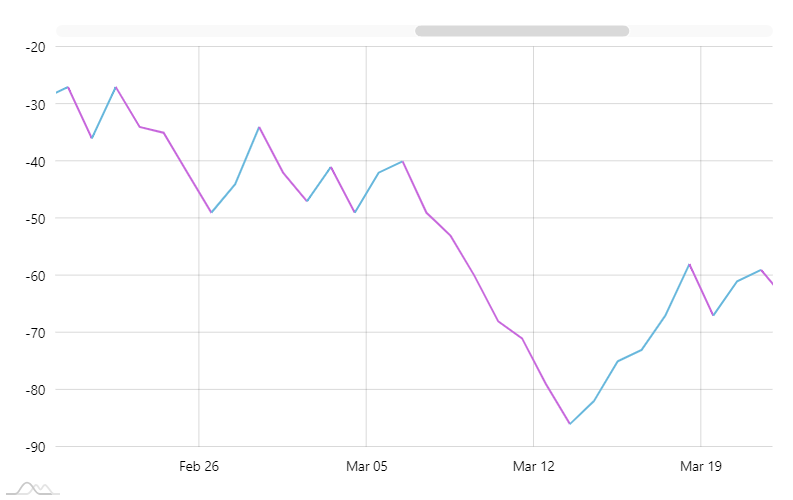
Line with different negative color
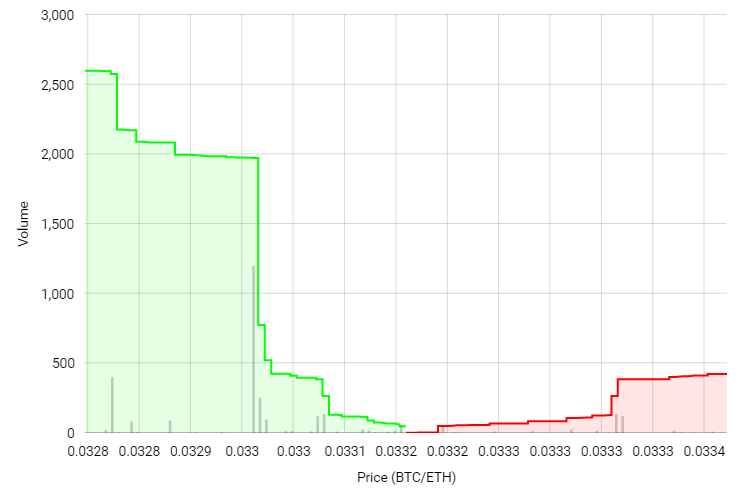
Live order book / depth chart
Live data
Divergent lines
Pie & Donut
Pie Chart
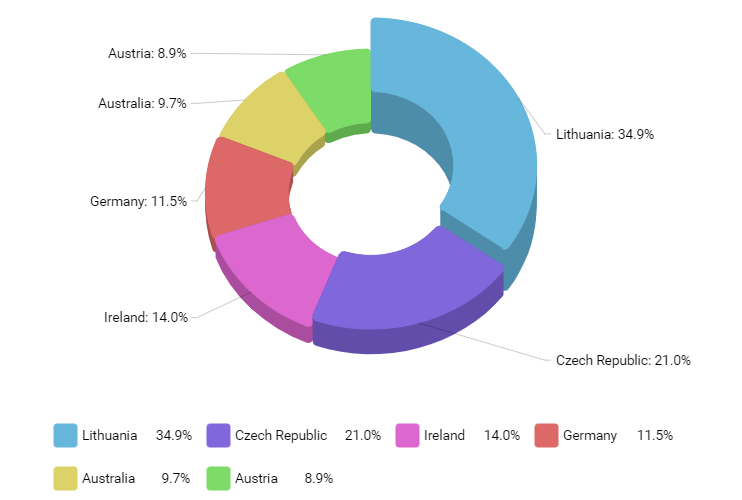
Variable-radius nested donut chart
Two-level pie chart
Donut with radial gradient
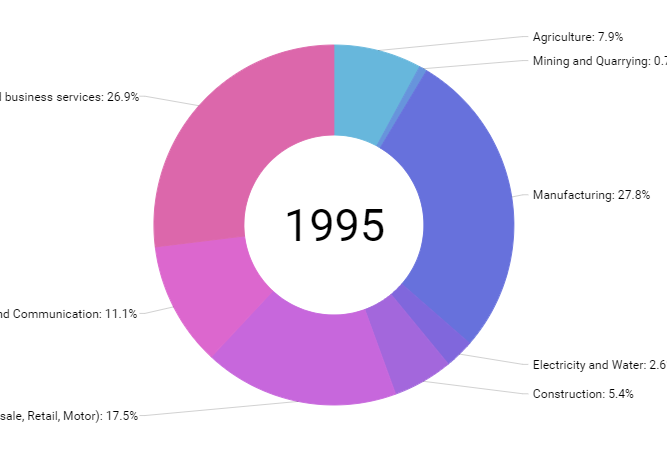
Animated Time-Line Pie Chart
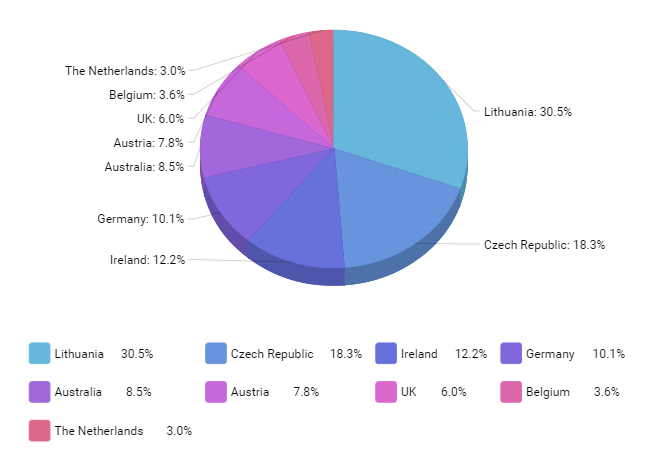
3D Pie Chart
3D Donut Chart
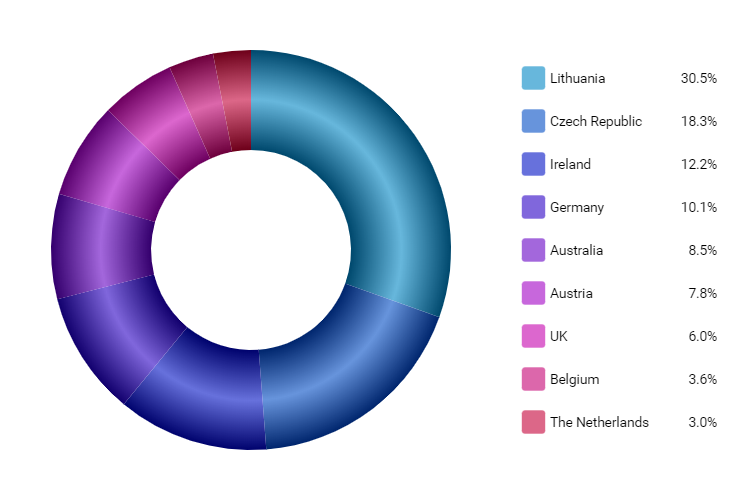
Pie Chart With Legend
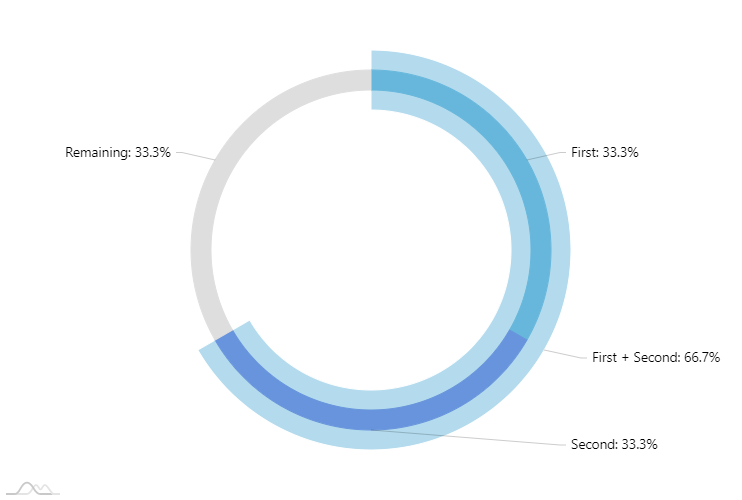
Pie chart with broken down slices
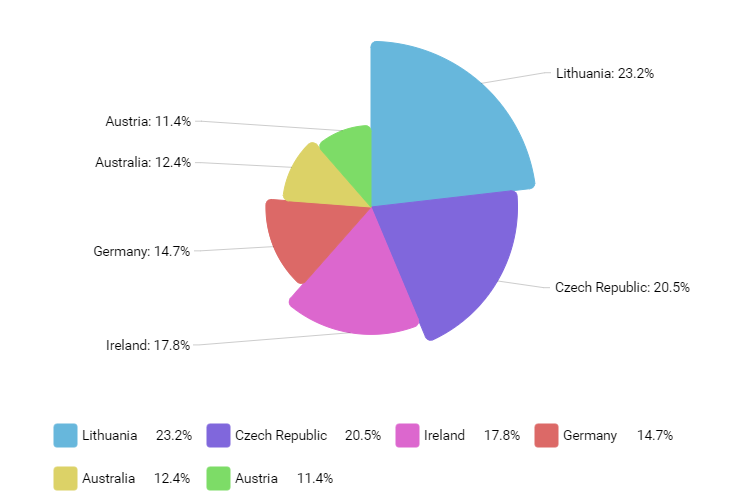
Variable Radius Pie Chart
Variable-height 3D Pie Chart
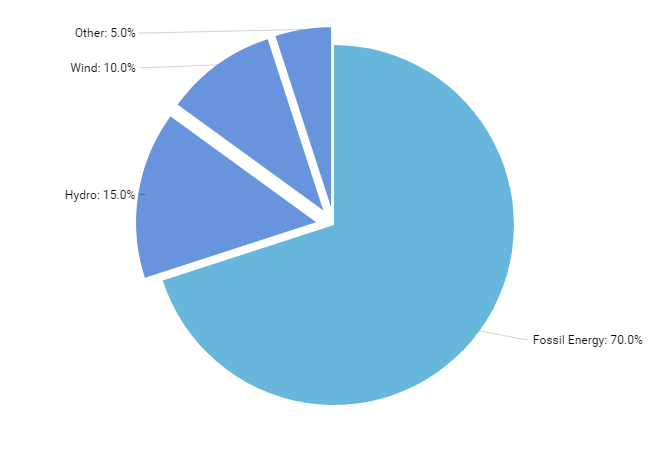
Pie of a Pie (exploding pie chart)
XY & Bubble
Animated XY Bubble Timeline chart
XY chart with date-based axis
Bubble-based heat map
XY Chart with fills to the axis
Zoomable Bubble Chart
XY Error Chart
XY chart with value-based line graphs
Irregular interval XY
Maps
Multi-series map
Pacific-centered map
Rotating globe with circles
Map using D3 projections
Map with pulsating bullets
Animations along lines
Map with curved lines
World time zone map
Zooming to Countries Map
Drill-down to countries
Map With Patterns
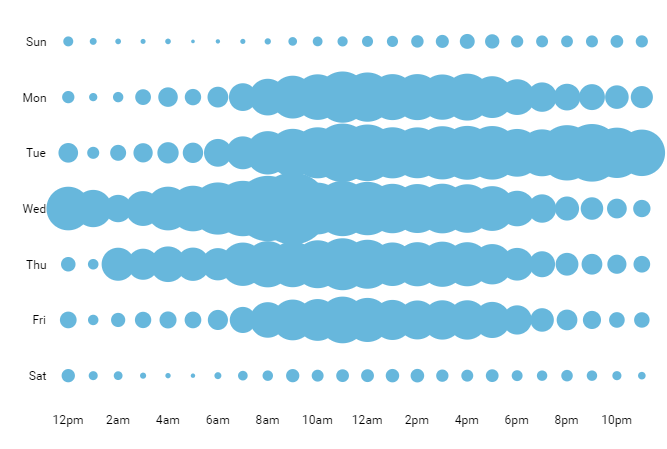
Approximate Working Hours Map
Capitals map
Custom HTML Elements as Map Markers
Flight routes map
Changing map projection
Location-sensitive map
US heat (choropleth) map
One Country morphing to another
Grouped countries map
Drill-down map
Selecting multiple areas map
Map image drill-down
Weather map
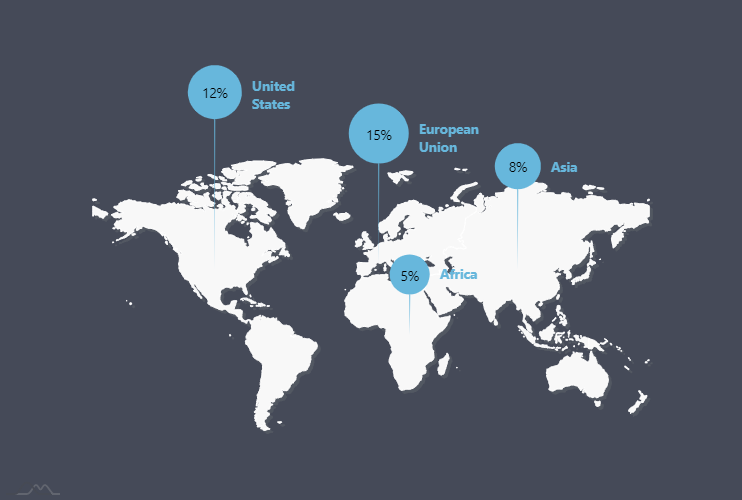
Map with Dynamic Pie Charts
Rotating globe
Map with sized pin bullets
Candlestick & OHLC
Professional Candlesticks
Candlestick chart
Box plot chart
OHLC chart
Stock
Stock chart
Stock chart comparing prices
Stock chart candlesticks
TimeLine
Serpentine Timeline
Stadium track chart
Infinity chart
Horizontal Serpentine chart
Linear process diagram
Spiral Bar chart
Spiral Gantt chart
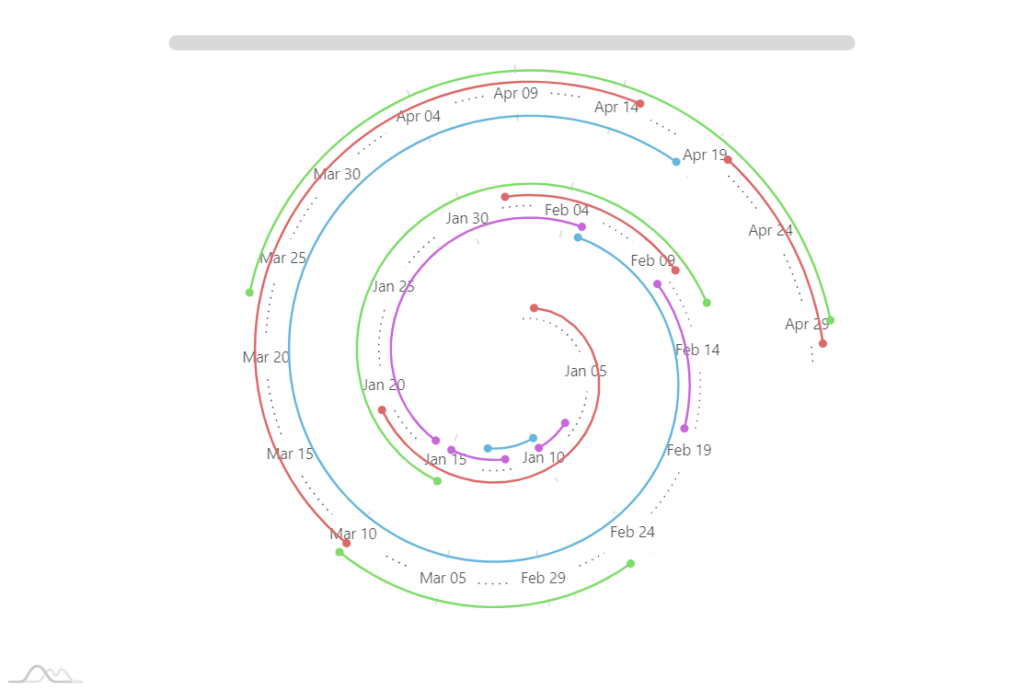
Spiral chart
Road chart
Fishbone timeline
Serpentine Stepline chart
Bent Gantt chart
Pictorial
Pictorial Chart
Horizontal Pictorial Chart
Custom pictorial slice shape
Gauges
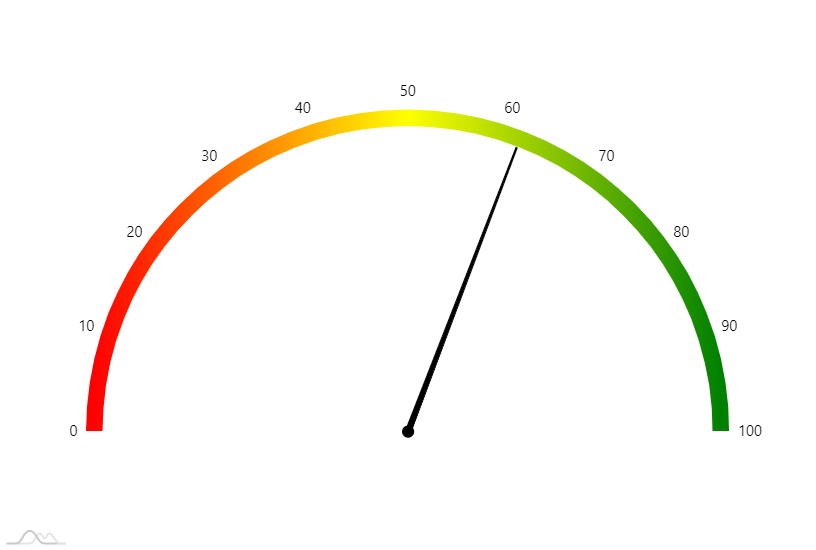
Gauge with gradient fill
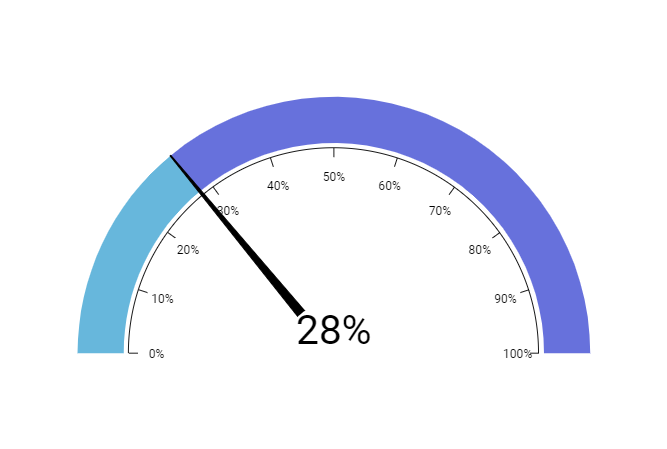
Gauge with bands
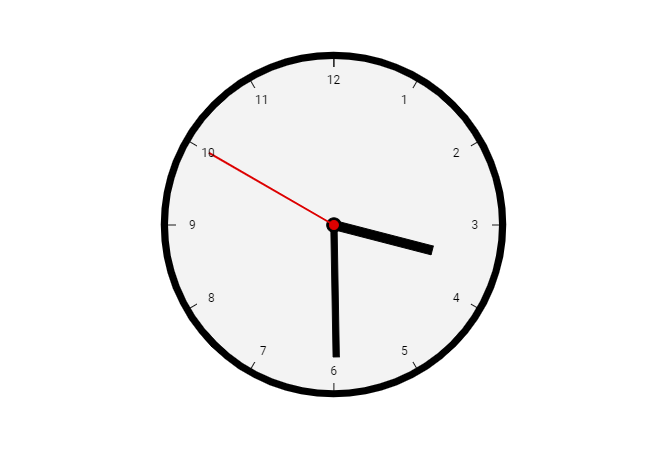
Clock
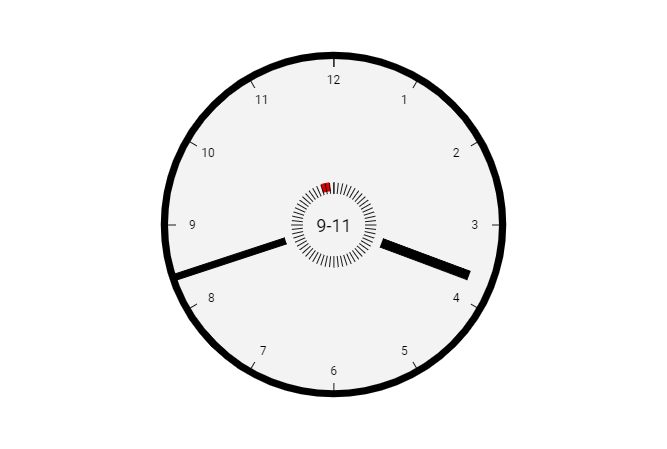
Clock With Two Faces
Animated gauge
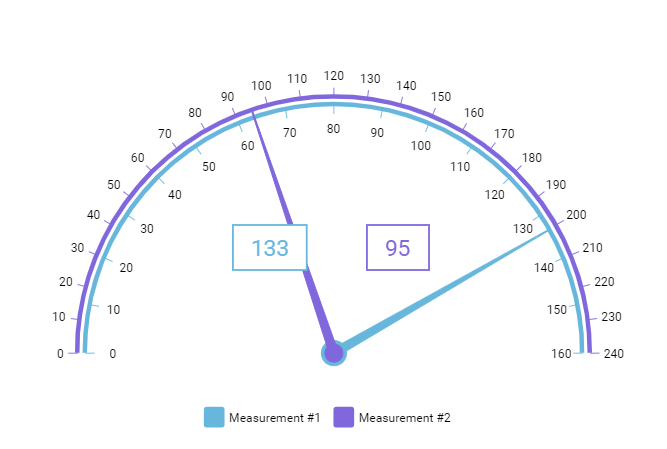
Angular Gauge With Two Axes
Multi-part Gauge
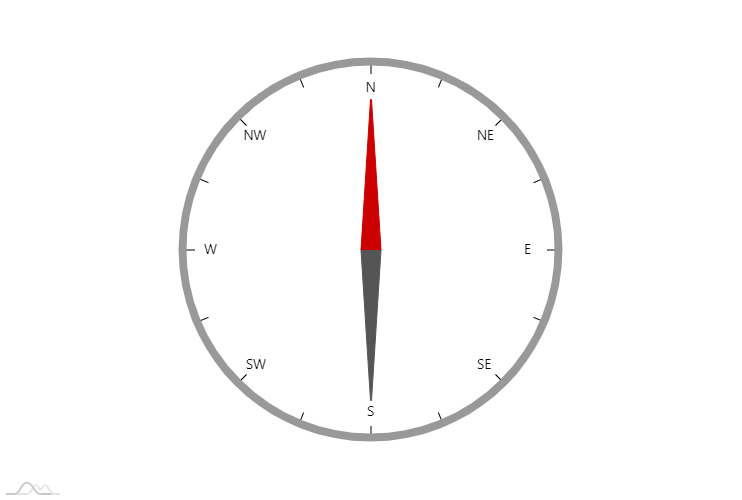
Compass chart
Radar & Polar
Zoomable radar
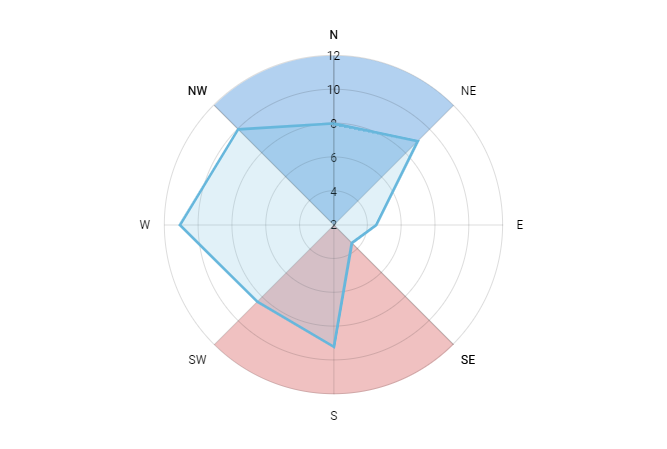
Radar Heat Map
Flower chart
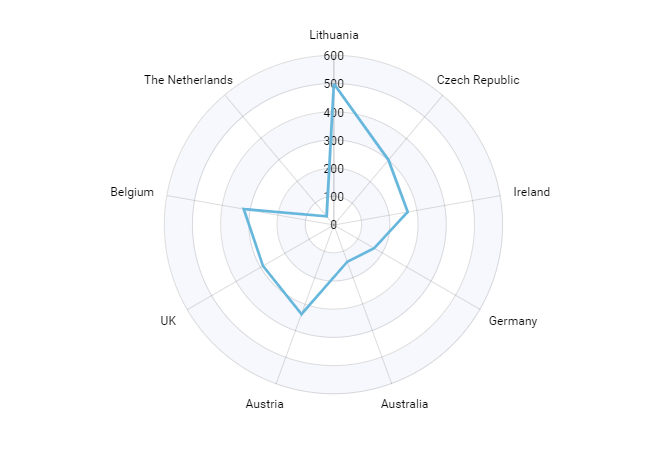
Radar Chart
Polar Chart
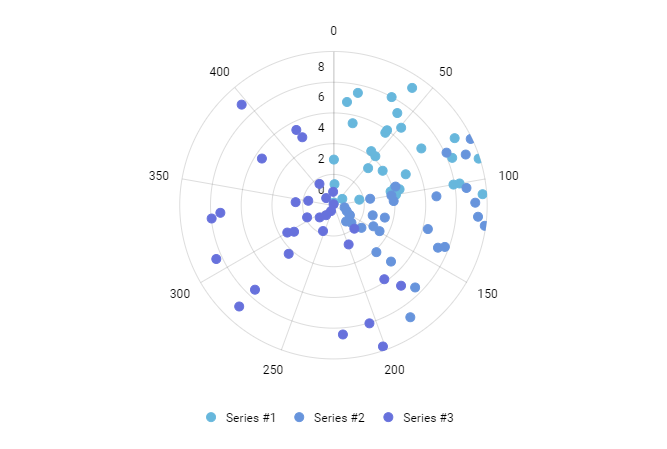
Polar Scatter
Radar with axis break
Stacked area radar
Radar with date axis
Variable-radius radar
Hierarchy
Multilevel Tree Map
Binded Tree Maps
Drill-down Treemap
Dynamic Data Updates on Treemap
Flow
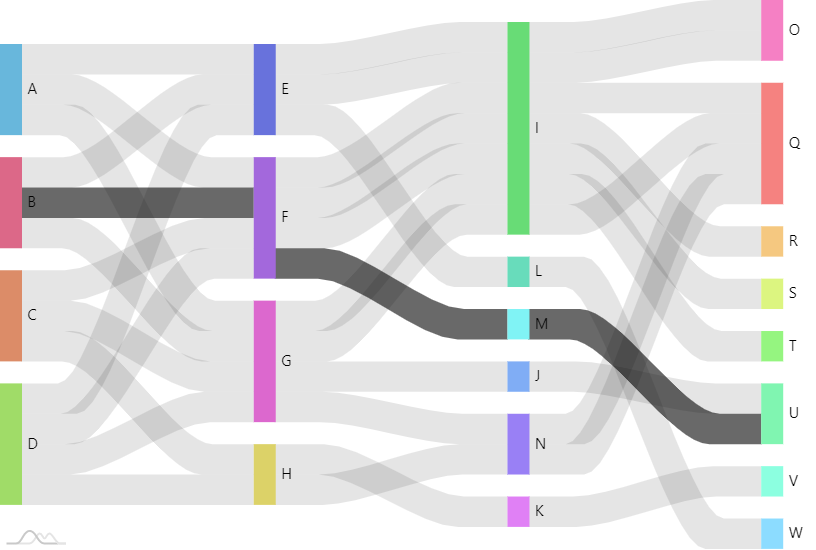
Sankey Diagram
Vertical Sankey Diagram
Traceable Sankey Diagram
Funnel & Pyramid
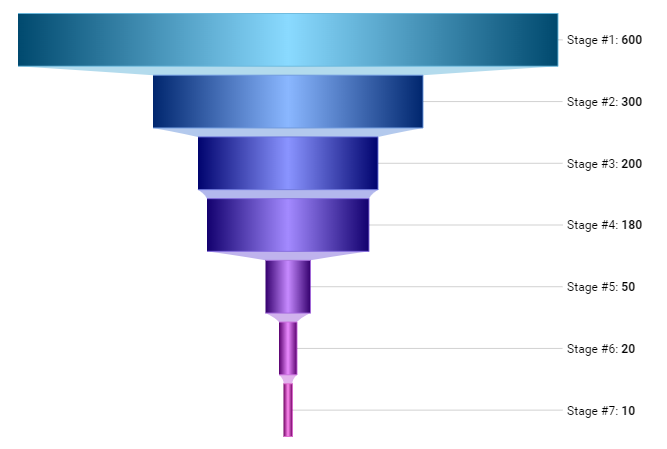
Funnel with Gradient Fill
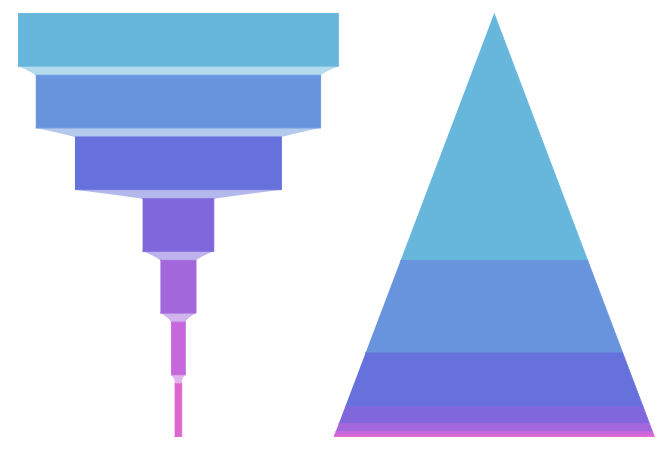
Multi-series Funnel/Pyramid
Horizontal Funnel
Miscellaneous
Horizontal Dumbbell plot
Vertically stacked axes chart
Horizontally stacked axes
Animating text along line series
Sunburst chart
Word Cloud
Changing data of Word cloud
Tag cloud
Historical population pyramid
Collapsible force-directed tree
Force-directed network
Packed circle chart
Force-directed adding links
Annotating Charts
Variance indicators
Force-directed with Pie charts
Bell curve series
Feather Plot
Venn diagram with patterns
Drill-down sunburst chart
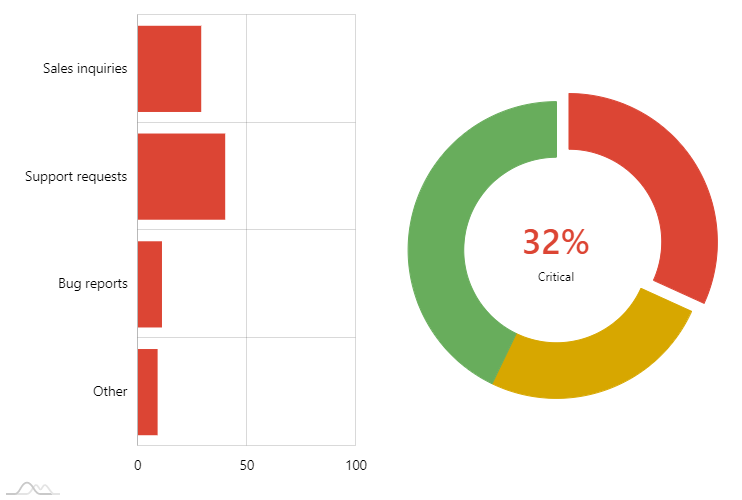
Hybrid drill-down Pie/Bar chart
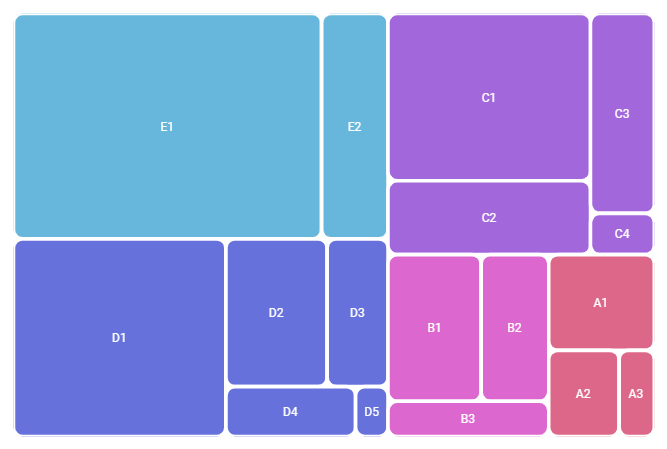
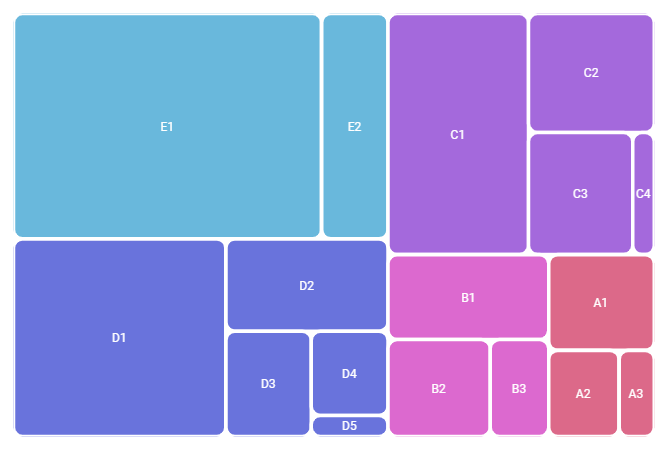
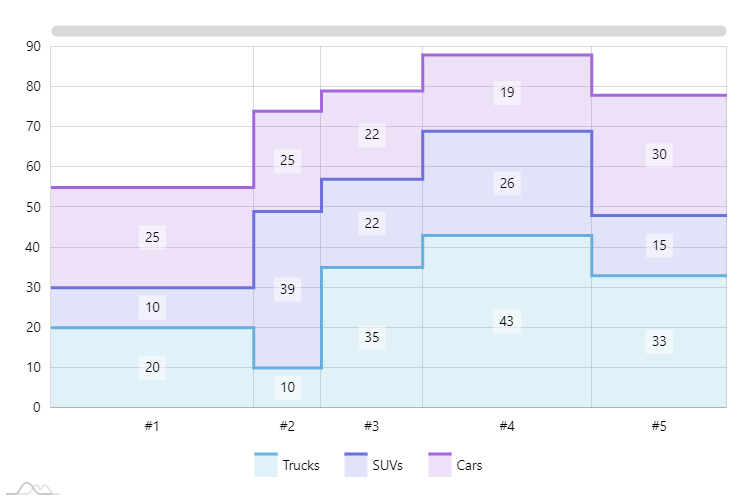
Mekko chart
Using SVG Filters
CSS animations
Combined bullet/column and line graphs with multiple value axes
Exporting chart to image
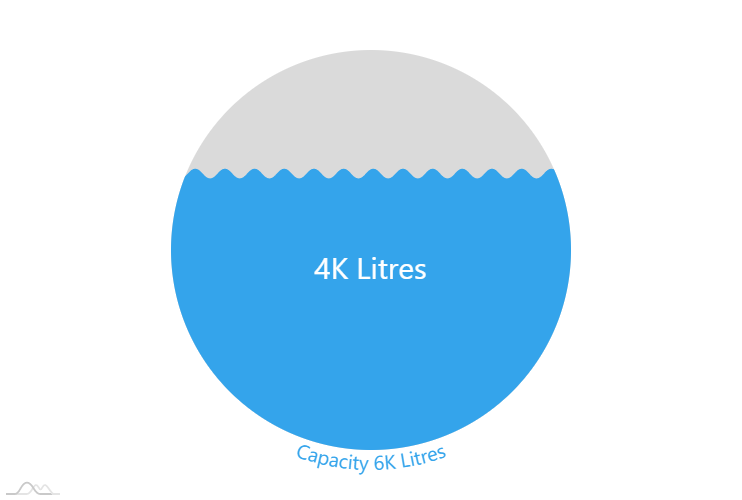
Cylinder gauge
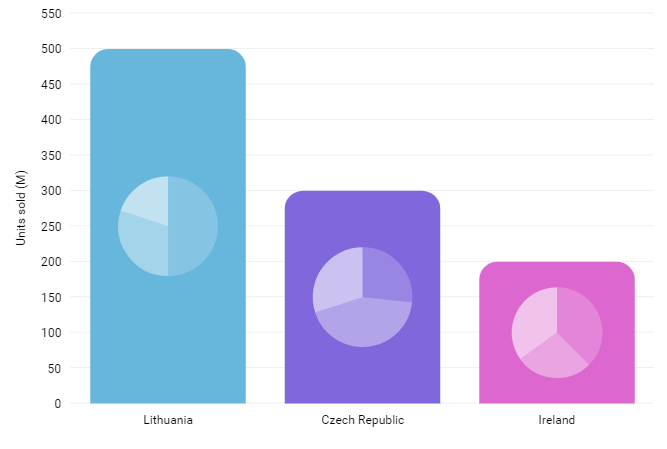
Pie Charts as Bullets
Error Chart
Interactive Wheel of Life
Spectrum Chart
Progress Chart
Forest Plot
Control Chart
Transport (metro) map schema
Drag-ordering of bars