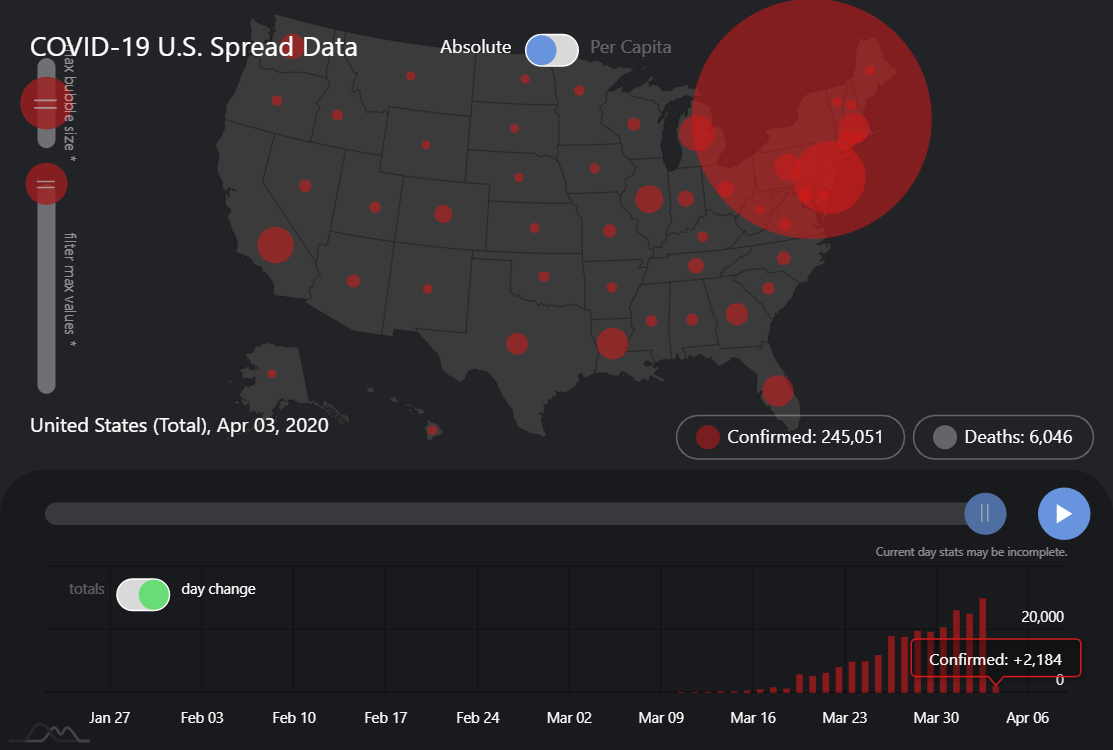
Coronavirus animated dashboard (U.S.)
IMPORTANT! This chart is for reference only. It uses data that is not being updated and therefore is not current.
This demo show sample dashboard to depict timeline data for COVID-19 epidemics in U.S.
Grab full source and data from GitHub
Demo source