Duration on Value Axis
This demo showcases several powerful concepts. Let’s take a look.
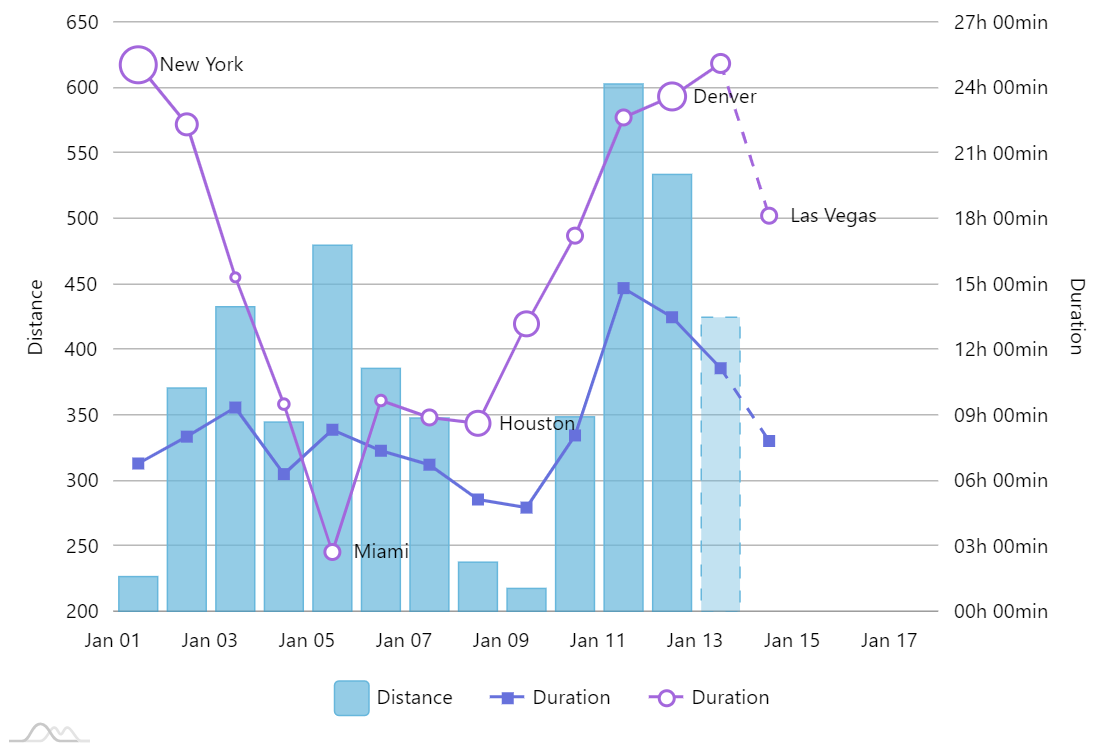
Duration axis
There’s a special type of axis that can reformat the values into any kind of “duration”. The units and formats are fully configurable.
Multiple axis
The chart you see above has three vertical axis (one is intentionally hidden). Each series, which uses data values on the whole different scale, has own axis.
Binding properties of chart elements to data
Size of the bullets on the “Latitude” series is bound to a data, using its “property fields”. This is a very powerful concept, which allows binding any property of any object to a value in data.
In this case we bind radius of the circle bullet to the townSize field in data.
More info about property fields
Demo source