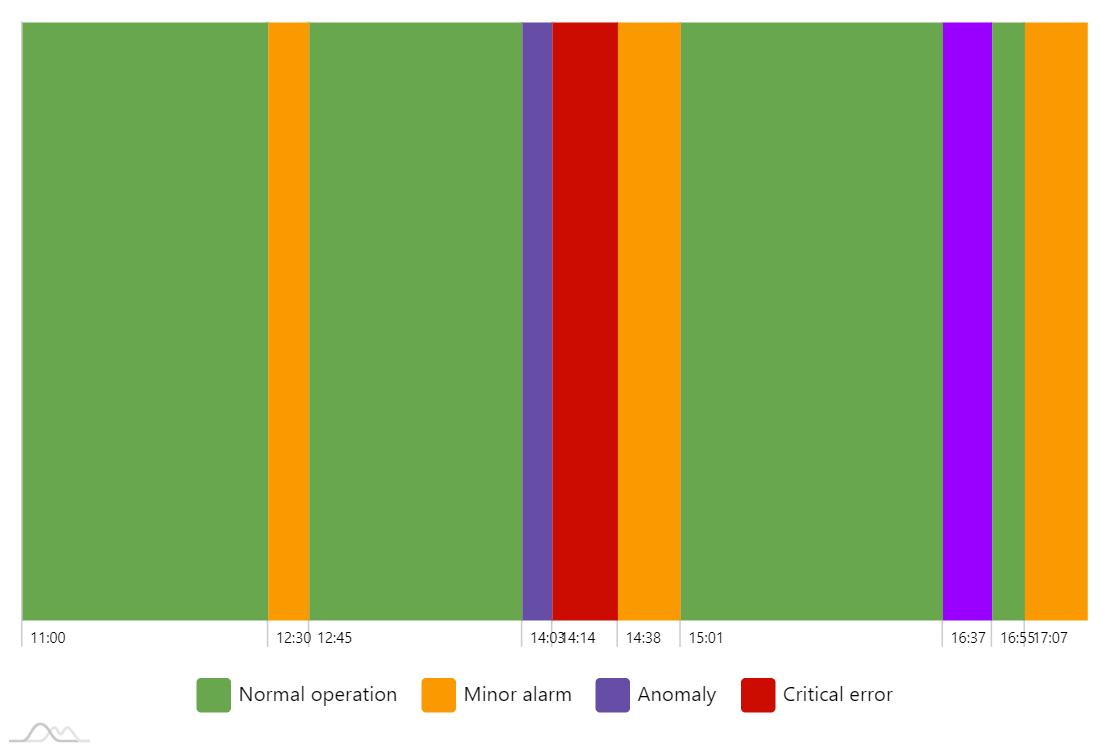
Spectrum Chart
This demo shows how we can leverage single-category ColumnSeries with floating columns, DateAxis, “axis ranges”, and “property fields” to create a Spectrum chart.
Axis range docs Property fields docs
Among other things, it also shows how chart’s Legend can be created with a totally custom items in it.
Demo source