An axis range is a way to define a specific range on an axis, then use that range to override some visual properties of the series to its parts that fall into range, or put visual guides, labels, or bullets to a particular position or a stretch of the axis.
Possible uses
Axis ranges can be used for two things:
- Modify visual properties of part of the series, that falls into specific range, e.g. color parts of the Line series that fall below zero value in red;
- Mark specific values or ranges of values on an axis with a straight line and optionally labels, a.k.a. "guides".
Let's explore both uses.
Using with series
We can use them, for example, to color a chunk of a line series differently by adding a range to its Date axis. Or, fill area series with different color for sections that fall below some threshold value, using ranges on a Value axis.
Unlike axis breaks, those do not have own classes, but rather are added into axis' axisRanges which is a list of objects representing the range.
Each axis type supports ranges, albeit with different properties.
Value axis range
Let's try to look at ranges on a value axis.
Say, we have a column series and we want to fill stretches from certain value to certain value with a slightly different color.
First, to create an axis range we will use axis' method createSeriesRange(series). This method is available for each axis type. It takes a reference to particular series as a parameter, so the axis knows which series to apply range overrides to.
let range = valueAxis.createSeriesRange(series);
range.value = 300;
range.endValue = 1100;
range.contents.stroke = am4core.color("#396478");
range.contents.fill = range.contents.stroke;
var range = valueAxis.createSeriesRange(series);
range.value = 300;
range.endValue = 1100;
range.contents.stroke = am4core.color("#396478");
range.contents.fill = range.contents.stroke;
{
  // ...
  "series": [{
    "type": "ColumnSeries",
    "id": "s1",
    // ...
  }],
  "yAxes": [{
    "type": "ValueAxis",
    // ...
    "axisRanges": [{
      "series": "s1",
      "value": 300,
      "endValue": 1200,
      "contents": {
        "stroke": "#396478",
        "fill": "#396478"
      }
    }]
  }]
}
Now, let's dissect the above.
The value and endValue are pretty self-explanatory. It defines outer edges of the range.
NOTE For Date axis, those would instead be date and endDate, while for Category axis, we'd need to use category and endCategory.
The content part is where you define which series' properties to override for parts that fall within "start" and "end" values (or dates, or categories). The key is property, and the value is the value we want to override it with.
NOTE Important note for JSON users: range needs to be connected to series, hence the need for using id and series properties, to bind the two through a unique id.
Let's see how this looks in action:
See the Pen amCharts V4: Axis ranges (1) by amCharts (@amcharts) on CodePen.
Date axis range
To drive this home, let's try to apply a range to a Date axis, to change part of the line series.
As mentioned earlier, we'll use date and endDate to indicate range start and end. We'll also be setting different contents properties - ones that are relevant to line series.
IMPORTANT Please note that when adding a range to a DateAxis, the date and endDate need to be Date objects.
See the Pen amCharts V4: Axis ranges (2) by amCharts (@amcharts) on CodePen.
Ranges as guides
Ranges as guides work similarly as in previous sections, in that they define start and end position on the axis.
The difference is that they do not modify sections of the series, but rather display a visual guide as a straight line or a band.
Creating a guide
Since we do not have to connect it with any series, we can use simple ranges.create() method to generate new instances of Axis ranges.
let range = valueAxis.axisRanges.create();
range.value = 300;
range.endValue = 1100;
var range = valueAxis.axisRanges.create();
range.value = 300;
range.endValue = 1100;
{
  // ...
  "yAxes": [{
    "type": "ValueAxis",
    // ...
    "axisRanges": [{
      "value": 300,
      "endValue": 1200
    }]
  }]
}
Setting ranges works exactly as with series-bound ranges, so we're not going to repeat the whole shebang again. Please refer the previous sections about value/endValue, date/endDate, and category/endCategory.
Configuring guide's appearance
Now, configuring appearance of the guide's appearance might seem a bit tricky, until you get a hang of it.
Properties, that are available for configuration depend on the type of axis the guide is attached to. Basically, each axis consists of smaller bits - data items that include grid elements and fill in-between.
Guides (or axis ranges) are basically axis data items, and have all the same properties and configuration options.
So, say for Value axis, we would configure a guide as a ValueAxisDataItem. For Category axis - CategoryAxisDataItem, and finally, for Date axis - DateAxisDataItem.
Don't worry if this seems a bit overwhelming, it will be much clearer in a bit.
Let's continue working with a Value axis, and take a look at ValueAxisDataItem.
Among other properties we see axisFill which we will use to set up fills, and grid which defines line elements.
As we see in class reference axisFill is an instance of AxisFill class, which has fill and fillOpacity properties.
And, since we're using a band, we don't need the line itself, so we'll need to disable it.
Ranged fills / bands
Let's try to set those on our newly-created guide and see what happens:
let range = valueAxis.axisRanges.create();
range.value = 300;
range.endValue = 1100;
range.axisFill.fill = am4core.color("#396478");
range.axisFill.fillOpacity = 0.2;
range.grid.strokeOpacity = 0;
var range = valueAxis.axisRanges.create();
range.value = 300;
range.endValue = 1100;
range.axisFill.fill = am4core.color("#396478");
range.axisFill.fillOpacity = 0.2;
range.grid.strokeOpacity = 0;
{
  // ...
  "yAxes": [{
    "type": "ValueAxis",
    // ...
    "axisRanges": [{
      "value": 300,
      "endValue": 1200,
      "axisFill": {
        "fill": "#396478",
        "fillOpacity": 0.2
      },
      "grid": {
        "strokeOpacity": 0
      }
    }]
  }]
}
See the Pen amCharts V4: Axis ranges (3) by amCharts (@amcharts) on CodePen.
Single lines
Now, if wanted to add straight line instead, I could use range's grid property instead, because it deals with grid lines, and that's what we want - a single line.
And, since we don't have to define an actual range, we can only set value. (no need for endValue)
Let's create two lines:
var range = valueAxis.axisRanges.create();
range.value = 1000;
range.grid.stroke = am4core.color("#396478");
range.grid.strokeWidth = 2;
range.grid.strokeOpacity = 1;

var range2 = valueAxis.axisRanges.create();
range2.value = 500;
range2.grid.stroke = am4core.color("#A96478");
range2.grid.strokeWidth = 2;
range2.grid.strokeOpacity = 1;
{
  // ...
  "yAxes": [{
    "type": "ValueAxis",
    // ...
    "axisRanges": [{
      "value": 1000,
      "grid": {
        "stroke": "#396478",
        "strokeWidth": 2,
        "strokeOpacity": 1
      }
    }, {
      "value": 500,
      "grid": {
        "stroke": "#A96478",
        "strokeWidth": 2,
        "strokeOpacity": 1
      }
    }]
  }]
}
See the Pen amCharts V4: Axis ranges (4) by amCharts (@amcharts) on CodePen.
Range over series
Axis ranges, just like axis grid is normally shown behind any series, present on the chart.
If you'd rather have your guide line go over the series, you can set above property of its grid element to true:
range.grid.above = true;
range.grid.above = true;
{
  // ...
  "yAxes": [{
    "type": "ValueAxis",
    // ...
    "axisRanges": [{
      // ...
      "grid": {
        // ...
        "above": true
      }
    }, {
      // ...
      "grid": {
        // ...
        "above": true
      }
    }]
  }]
}

Default behavior 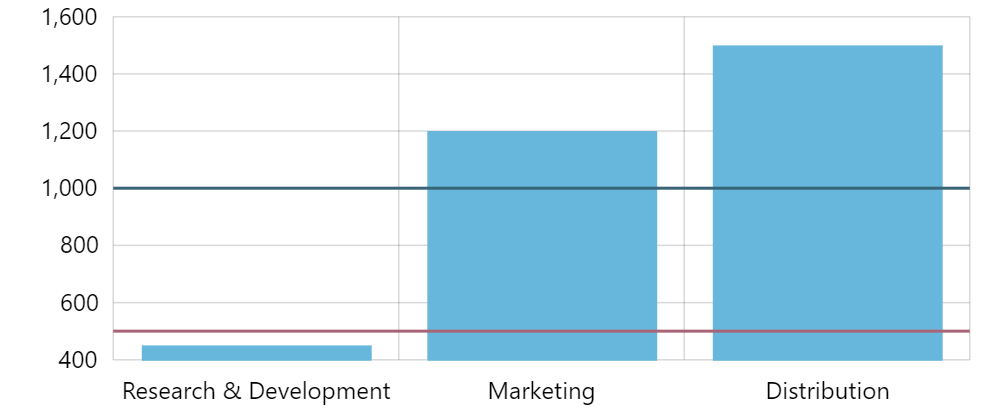
range.grid.above = true
Range labels
Adding guide labels
You may also want to add some accompanying text to your guides.
Again, we turn to axis' data item, and see it has a label property. We can use that!
Now, label is an object of type Label, which means we can do all kinds of beautiful (and nasty) things to it to make it look just like we want it to.
let range = valueAxis.axisRanges.create();
range.value = 1000;
range.grid.stroke = am4core.color("#396478");
range.grid.strokeWidth = 2;
range.grid.strokeOpacity = 1;
range.label.inside = true;
range.label.text = "Goal";
range.label.fill = range.grid.stroke;
//range.label.align = "right";
range.label.verticalCenter = "bottom";

let range2 = valueAxis.axisRanges.create();
range2.value = 500;
range2.grid.stroke = am4core.color("#A96478");
range2.grid.strokeWidth = 2;
range2.grid.strokeOpacity = 1;
range2.label.inside = true;
range2.label.text = "Threshold";
range2.label.fill = range2.grid.stroke;
//range2.label.align = "right";
range2.label.verticalCenter = "bottom";
var range = valueAxis.axisRanges.create();
range.value = 1000;
range.grid.stroke = am4core.color("#396478");
range.grid.strokeWidth = 2;
range.grid.strokeOpacity = 1;
range.label.inside = true;
range.label.text = "Goal";
range.label.fill = range.grid.stroke;
//range.label.align = "right";
range.label.verticalCenter = "bottom";

var range2 = valueAxis.axisRanges.create();
range2.value = 500;
range2.grid.stroke = am4core.color("#A96478");
range2.grid.strokeWidth = 2;
range2.grid.strokeOpacity = 1;
range2.label.inside = true;
range2.label.text = "Threshold";
range2.label.fill = range2.grid.stroke;
//range2.label.align = "right";
range2.label.verticalCenter = "bottom";
{
  // ...
  "yAxes": [{
    "type": "ValueAxis",
    // ...
    "axisRanges": [{
      "value": 1000,
      "grid": {
        "stroke": "#396478",
        "strokeWidth": 2,
        "strokeOpacity": 1
      },
      "label": {
        "inside": true,
        "text": "Goal",
        "fill": "#396478",
        "verticalCenter": "bottom"
      }
    }, {
      "value": 500,
      "grid": {
        "stroke": "#A96478",
        "strokeWidth": 2,
        "strokeOpacity": 1
      },
      "label": {
        "inside": true,
        "text": "Threshold",
        "fill": "#A96478",
        "verticalCenter": "bottom"
      }
    }]
  }]
}
See the Pen amCharts V4: Axis ranges (5) by amCharts (@amcharts) on CodePen.
Adding ranged label
Guides are not the only Axis range types that can make use of labels. You can add those to Axis ranges that span several values.
In such cases the label will be positioned right in the middle of the range.
Important Axis renderer will override label's horizontalCenter and verticalCenter to correctly position it in the middle. If we want to modify those properties, we'll need to set up an Adapter to override it back.
let range = valueAxis.axisRanges.create();
range.value = 0;
range.endValue = 2000;
range.label.text = "Positive";
range.label.disabled = false;
range.label.rotation = 90;
range.label.fill = am4core.color("#0c0");
range.label.adapter.add("horizontalCenter", function() {
  return "middle";
});
var range = valueAxis.axisRanges.create();
range.value = 0;
range.endValue = 2000;
range.label.text = "Positive";
range.label.disabled = false;
range.label.rotation = 90;
range.label.fill = am4core.color("#0c0");
range.label.adapter.add("horizontalCenter", function() {
  return "middle";
});
{
  // ...
  "yAxes": [{
    "type": "ValueAxis",
    // ...
    "axisRanges": [{
      "value": 0,
      "endValue": 2000,
      "label": {
        "text": "Positive",
        "disabled": false,
        "rotation": 90,
        "fill": "#0c0",
        "adapter": {
          "horizontalCenter": function() {
            return "middle";
          }
        }
      }
    }]
  }]
}
See the Pen amCharts V4: Axis ranges (6) by amCharts (@amcharts) on CodePen.
Guide labels on category axis
There's one caveat about adding guide (range) labels on a Category axis.
Axis range on a Category axis will inherit data item of the category it is placed on. The label attached to this range will firstly look into data item for the text, causing it to mistakenly display category label rather then what you have set in range's text property.
At some point we might fix that, but for now a simple workaround trick will work - setting text directly on range's dataItem:
range.dataItem.text = "My custom label";
range.dataItem.text = "My custom label";
// This will not work on JSON.
// We can use adapter approach:
{
  // ...
  "yAxes": [{
    "type": "CategoryAxis",
    // ...
    "axisRanges": [{
      // ...
      "label": {
        // ...
        "adapter": {
          "text": function() {
            return "My custom label";
          }
        }
      }
    }]
  }]
}
Here's an example:
See the Pen amCharts 4: Adding labels on CategoryAxis by amCharts (@amcharts) on CodePen.
Positioning labels
There are three main guide label settings that affect their position: location, align, and valign.
Let's explore how each of those is used.
Relative position within axis cell
Say, we have an axis range with a label. Normally, it will be displayed positioned like any label would be positioned on that axis, e.g. in the middle of the axis cell, or at the beginning if it's a Date axis.
You can control that relative position within cell using location property. The value goes from 0 (start of the cell) to 1 (end of the cell).
On horizontal axes, it affects horizontal position. On vertical ones - vertical position.
Alignment within plot area
Normally, labels are placed just outside the axis line. Say we want to place them on an opposite site.
Before we can do that, we need to set the label to be inside plot area by setting its inside property to true.
Then we can control label's alignment within plot area using its align (for positioning horizontally), and valign (for positioning vertically).
let range = categoryAxis.axisRanges.create();
// ...
range.label.inside = true;
range.label.valign = "top";
var range = categoryAxis.axisRanges.create();
// ...
range.label.inside = true;
range.label.valign = "top";
{
  // ...
  "xAxes": [{
    "type": "CategoryAxis",
    // ...
    "axisRanges": [{
      // ...
      "label": {
        // ...
        "inside": true,
        "valign": "top"
      }
    }]
  }]
}
Range bullets
Since version 4.5.9 an Axis range, along label, grid line and fill, can now have a bullet attached to it.
It allows placing bullets directly on the axis - any place you would place an axis range itself.
Adding a bullet to an axis range is as easy as assigning an instance of some Sprite element to range's bullet property.
Let's see how it works with examples.
Creating range with bullet
As we already briefly mentioned, placing a bullet on an axis is just assigning Sprite instance to bullet property of the range.
The object can be any element or a special AxisBullet element, which besides all the usual characteristics of a Container also has some dedicated properties meant to fine-tune position of the label. We'll see about it later.
For start, let's try creating an axis range on a DateAxis on a specific date:
let event = dateAxis.axisRanges.create();
event.date = new Date(2018, 0, 3, 12);
event.bullet = new am4core.Triangle();
event.bullet.width = 15;
event.bullet.height = 11;
event.bullet.fill = am4core.color("#c00");
var event = dateAxis.axisRanges.create();
event.date = new Date(2018, 0, 3, 12);
event.bullet = new am4core.Triangle();
event.bullet.width = 15;
event.bullet.height = 11;
event.bullet.fill = am4core.color("#c00");
{
  // ...
  "xAxes": [{
    "type": "DateAxis",
    // ...
    "axisRanges": [{
      "date": new Date(2018, 0, 3, 12),
      "bullet": {
        "type": "Triangle",
        "width": 15,
        "height": 11,
        "fill": "#c00"
      }
    }]
  }]
}
IMPORTANT Please note that when adding a range to a DateAxis, the date and endDate need to be Date objects.
As per above code we should now have a red triangle, placed in the middle of January 3rd (notice fourth parameter in Date constructor - it indicates hours).
Here's what we get:
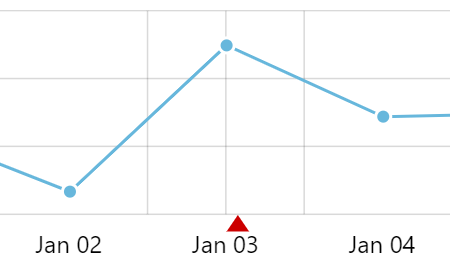
There's a red triangle like we expected. However, there are a few things that require fixing.
- The default vertical grid line which accompanies each axis range must go.
- The triangle's tip is not aligned to the exact middle.
Let's fix those.
The first one can be done by setting disabled on a range's grid element.
For the latter we just need to indicate that our triangle's horizontal center is it's middle.
let event = dateAxis.axisRanges.create();
event.date = new Date(2018, 0, 3, 12);
event.grid.disabled = true;
event.bullet = new am4core.Triangle();
event.bullet.width = 15;
event.bullet.height = 11;
event.bullet.fill = am4core.color("#c00");
event.bullet.horizontalCenter = "middle";
var event = dateAxis.axisRanges.create();
event.date = new Date(2018, 0, 3, 12);
event.grid.disabled = true;
event.bullet = new am4core.Triangle();
event.bullet.width = 15;
event.bullet.height = 11;
event.bullet.fill = am4core.color("#c00");
event.bullet.horizontalCenter = "middle";
{
  // ...
  "xAxes": [{
    "type": "DateAxis",
    // ...
    "axisRanges": [{
      "date": new Date(2018, 0, 3, 12),
      "grid": {
        "disabled": true
      },
      "bullet": {
        "type": "Triangle",
        "width": 15,
        "height": 11,
        "fill": "#c00",
        "horizontalCenter": "middle"
      }
    }]
  }]
}
How does it look now?

Perfect. Here's the live chart if you'd like to see it in action:
See the Pen amCharts 4: Axis bullets by amCharts team (@amcharts) on CodePen.
Using with Bullets plugin
You already know that we can insert anything as a bullet. This means that we can use our Bullets plugin, to create exciting event indicators on our axis.
For the sake of the exercise and change of scenery, let's put some photographic pins on a vertical ValueAxis:
// Create range
let event = valueAxis.axisRanges.create();
event.value = 550;
event.grid.disabled = true;

// Create a Pin bullet
let pin = new am4plugins_bullets.PinBullet();
event.bullet = pin;

// Configure
pin.background.pointerAngle = 0;
pin.background.radius = 20;
pin.background.fill = am4core.color("#c00");
pin.image = new am4core.Image();
pin.image.href = "https://s3-us-west-2.amazonaws.com/s.cdpn.io/t-160/cat.png";
// Create range
var event = valueAxis.axisRanges.create();
event.value = 550;
event.grid.disabled = true;

// Create a Pin bullet
var pin = new am4plugins_bullets.PinBullet();
event.bullet = pin;

// Configure
pin.background.pointerAngle = 0;
pin.background.radius = 20;
pin.background.fill = am4core.color("#c00");
pin.image = new am4core.Image();
pin.image.href = "https://s3-us-west-2.amazonaws.com/s.cdpn.io/t-160/cat.png";
{
  // ...
  "yAxes": [{
    "type": "ValueAxis",
    // ...
    "axisRanges": [{
      "value": 550,
      "grid": {
        "disabled": true
      },
      "bullet": {
        "type": "PinBullet",
        "background": {
          "pointerAngle": 0,
           "radius": 20,
         "fill": "#c00"
        },
        "image": {
          "type": "Image",
          "href": "https://s3-us-west-2.amazonaws.com/s.cdpn.io/t-160/cat.png"
        }
      }
    }]
  }]
}
See the Pen amCharts 4: Axis bullets by amCharts team (@amcharts) on CodePen.
Positioning axis bullet
Default bullet positioning
As we already saw, the axis range bullet will be placed directly on the axis range position.
If axis range has both start and end positions, the bullet will be placed right in the middle.

date = new Date(2018, 0, 3)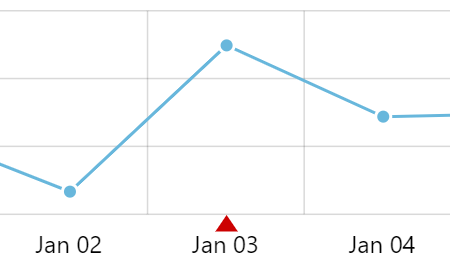
date = new Date(2018, 0, 3, 12)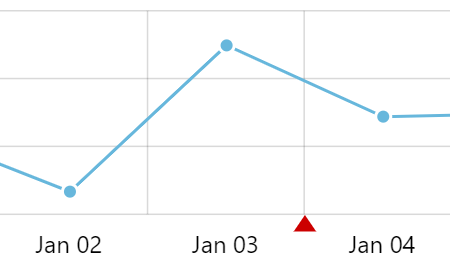
date = new Date(2018, 0, 3, 24)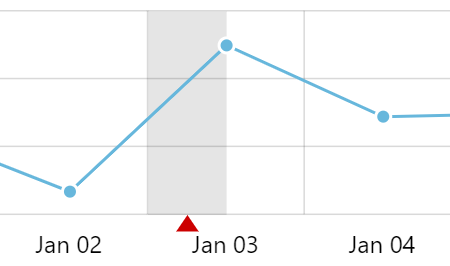
date = new Date(2018, 0, 3)endDate = new Date(2018, 0, 3, 12)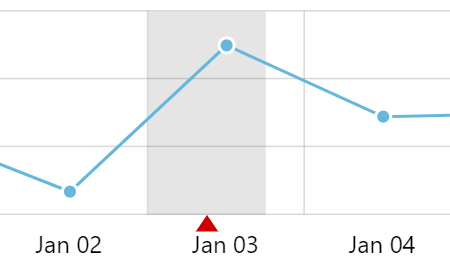
date = new Date(2018, 0, 3)endDate = new Date(2018, 0, 3, 18)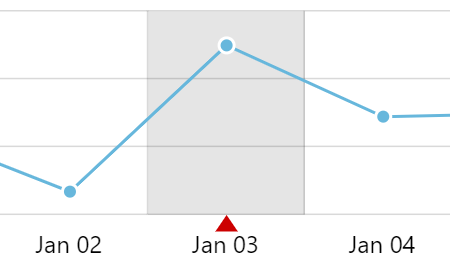
date = new Date(2018, 0, 3)endDate = new Date(2018, 0, 3, 24)
This always-in-the-center positioning works on any axis type.
Next chapter will show how we can use special class AxisBullet to control relative position of the bullet within the axis range.
Relative positioning
Basically, AxisBullet is a container that you can add other stuff to it, but with one useful feature: it has a location property, which you can use to set bullet's (and in turn all of its contents) position relatively to the span of the range.
So, if you want your bullet to be at 80% the span of the range, you'd set location = 0.8.
Let's see how this works code-wise:
let event = dateAxis.axisRanges.create();
event.date = new Date(2018, 0, 3);
event.endDate = new Date(2018, 0, 3, 24);
event.grid.disabled = true;
event.axisFill.fillOpacity = 0.1;

let bullet = new am4charts.AxisBullet();
bullet.location = 0.8;
event.bullet = bullet;

let triangle = event.bullet.createChild(am4core.Triangle);
triangle.width = 15;
triangle.height = 11;
triangle.fill = am4core.color("#c00");
triangle.horizontalCenter = "middle";
var event = dateAxis.axisRanges.create();
event.date = new Date(2018, 0, 3);
event.endDate = new Date(2018, 0, 3, 24);
event.grid.disabled = true;
event.axisFill.fillOpacity = 0.1;

var bullet = new am4charts.AxisBullet();
bullet.location = 0.8;
event.bullet = bullet;

var triangle = event.bullet.createChild(am4core.Triangle);
triangle.width = 15;
triangle.height = 11;
triangle.fill = am4core.color("#c00");
triangle.horizontalCenter = "middle";
{
  // ...
  "xAxes": [{
    "type": "DateAxis",
    // ...
    "axisRanges": [{
      "date": new Date(2018, 0, 3, 12),
      "grid": {
        "disabled": true
      },
      "bullet": {
        "type": "AxisBullet",
        "location": 0.8,
        "children": [{
          "type": "Triangle",
          "width": 15,
          "height": 11,
          "fill": "#c00",
          "horizontalCenter": "middle"
        }]
      }
    }]
  }]
}
If we run this code, we'll notice that our triangle is no longer in the middle of the axis range, but rather off to towards the end of the range:
See the Pen amCharts 4: Axis bullets by amCharts team (@amcharts) on CodePen.
Bullet inside/outside plot area
There is no setting to place a bullet inside or outside plot area.
The bullet is placed right on the point of the axis line.
The actual position of the bullet then is determined by verticalCenter of the element itself.
Most of the elements have their verticalCenter set to "top", so when placed on horizontal axis, they will appear below it.
Place it to "bottom" ant the element will move above it.
Some elements, like say FlagBullet or PinBullet which we already know, do not have dimension, so center settings will not have affect on them. Their actual position/direction will depend on other settings, such as poleHeight for FlagBullet (negative height will produce flipped over flag), or background.pointerAngle for PinBullet.

pin.background.pointerAngle = 90(default)flag.poleHeight = 10(default)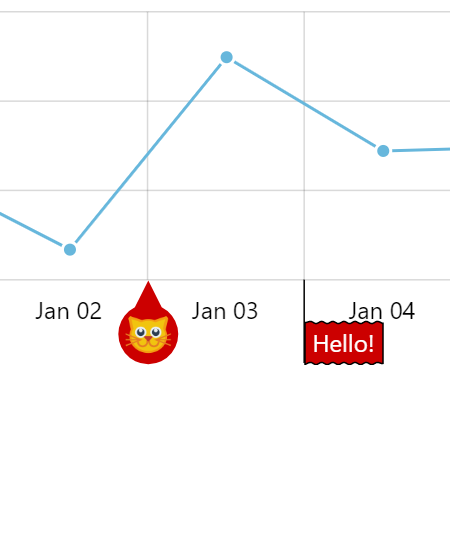
pin.background.pointerAngle = 270flag.poleHeight = -28
Fine-tuning bullet position
Finally, you can use bullet's dx and dy properties to achieve that perfect precision.
dx will adjust bullet's horizontal position by X pixels (negative number will move it to left), and dy will similarly affect bullet's vertical placement.
Series-less timelines
You can use bulleted ranges to create timelines even without adding any series.
All you need to do is to set a min and max for your DateAxis.
We won't go into much of the detail. Here's an example:
See the Pen amCharts 4: Axis bullets as a timeline by amCharts team (@amcharts) on CodePen.
Range locations
Some axis types, like Date axis or Category axis, are divided in clear increments. For a Date axis it's a minimum period, like a day. For Category axis, it's a category.
When a Range goes from one increment (date or category) to another (as defined date/category and endDate/endCategory) they will span from the beginning of the start increment to the ending of the end increment.
Here's an example of a Category axis Range:
let range = categoryAxis.axisRanges.create();
range.category = "B";
range.endCategory = "D";
range.axisFill.fill = am4core.color("#396478");
range.axisFill.fillOpacity = 0.3;
var range = categoryAxis.axisRanges.create();
range.category = "B";
range.endCategory = "D";
range.axisFill.fill = am4core.color("#396478");
range.axisFill.fillOpacity = 0.3;
{
  // ...
  "xAxes": [{
    "type": "CategoryAxis",
    // ...
    "axisRanges": [{
      "category": "B",
      "endCategory": "D",
      "axisFill": {
        "fill": "#396478",
        "fillOpacity": 0.3
      }
    }]
  }]
}
Notice, how Range's fill starts from the beginning of "B" and fills all the way to the ending of "D":
See the Pen amCharts V4: Axis ranges (6) by amCharts (@amcharts) on CodePen.
While it is the default behavior, it is within our power to make Range start at any point within the date or category.
That's what Range has property locations for.
locations is an object, which for Date axis will have properties date and endDate, while for Category axis, it will have category and endCategory.
Those hold not actual date or category but a relative location within that specific increment. A relative location is a number between 0 (zero) and 1 (one), with the former meaning beginning and the latter the end.
So, the default locations for a Category axis Range is:
{
  "category": 0,
  "endCategory": 1
}
Which means "start at the beginning (0) of the start category and end at the ending (1) of the end category".
Let's say we want to start the fill at 20% of the "B" and end at 80% of the "D". Our locations would have to be 0.2 and 0.8 respectively:
let range = categoryAxis.axisRanges.create();
range.category = "B";
range.endCategory = "D";
range.axisFill.fill = am4core.color("#396478");
range.axisFill.fillOpacity = 0.3;
range.locations.category = 0.2;
range.locations.endCategory = 0.8;
var range = categoryAxis.axisRanges.create();
range.category = "B";
range.endCategory = "D";
range.axisFill.fill = am4core.color("#396478");
range.axisFill.fillOpacity = 0.3;
range.locations.category = 0.2;
range.locations.endCategory = 0.8;
{
  // ...
  "xAxes": [{
    "type": "CategoryAxis",
    // ...
    "axisRanges": [{
      "category": "B",
      "endCategory": "D",
      "axisFill": {
        "fill": "#396478",
        "fillOpacity": 0.3
      },
      "locations": {
        "category": 0.2,
        "endCategory": 0.8
      }
    }]
  }]
}
Let's see how that affects our Range:
See the Pen amCharts V4: Axis ranges (7) by amCharts (@amcharts) on CodePen.
Removing ranges
To remove an individual axis range, simply remove it from respective axis axisRanges:
valueAxis.axisRanges.removeValue(range);
valueAxis.axisRanges.removeValue(range);
Doing so will automatically will remove and dispose axis range object.
And since axisRanges is a List, you can just clear() to remove them all at once.
valueAxis.axisRanges.clear();
valueAxis.axisRanges.clear();
Tooltips on ranges
There might be some times where you want to display a tooltip when user hovers an axis range.
amCharts 4 allows adding a tooltip easily on any object using its tooltipText property. You just set it to whatever text you want to appear when element is hovered, and that's it.
However, with axis ranges there are a few other hoops you'll need to jump first.
In order for ranges to not interfere with other elements, they have their interactivity disabled by default. We'll need to re-enable it.
To save precious CPU cycles, axis ranges also do not have their dimensions measured by default. Those are needed to correctly place the tooltip. That's another thing we'll need to re-enable.
range.axisFill.tooltip = new am4core.Tooltip();
range.axisFill.tooltipText = "Range:\n[bold]{category}[] to [bold]{endCategory}[/]";
range.axisFill.interactionsEnabled = true;
range.axisFill.isMeasured = true;
range.axisFill.tooltip = new am4core.Tooltip();
range.axisFill.tooltipText = "Range:\n[bold]{category}[] to [bold]{endCategory}[/]";
range.axisFill.interactionsEnabled = true;
range.axisFill.isMeasured = true;
{
  // ...
  "xAxes": [{
    // ...
    "axisRanges": [{
      // ...
      "axisFill": {
        // ...
        "tooltip": {
          "type": "Tooltip"
        },
        "tooltipText": "Range:\n[bold]{category}[] to [bold]{endCategory}[/]",
        "interactionsEnabled": true,
        "isMeasured": true
      }
    }]
  }]
}
See the Pen amCharts V4: Axis ranges (6) by amCharts team (@amcharts) on CodePen.
NOTE The reason we are creating a separate tooltip instance is that otherwise range would try reuse its axis' tooltip, which is positioned along the axis, not over the range.


