All SVG textual labels displayed on the chart pass via TextFormatter before making onto screen. The formatter looks for special placeholder codes to replace either with real data or apply visual formatting.
Intro
Basically, it goes like this: whenever amCharts 4 displays a text, it passes it via text processor we call Text formatter. During the process anything contained within curly brackets { ... } is treated as a reference to some data value and is replaced with relative data. Similarly everything that goes within square brackets [ ... ] is treated as text formatting options, and again is not displayed but rather parsed for text styling instructions.
Let's take this text for example:
"Quick [fox] jumps over lazy {dog}"
Naturally, we might expect to get a text like that. However, that won't be the case.
What will happen is that formatter will try to figure out how it can format text using "fox", fail and just omit the whole block altogether. It will next try to look for "dog" in related data, fail again, and will omit this block as well. Which will result in the following text label:
"Quick jumps over lazy"
Which kinda makes sense in a "the quick and the dead" kind of way, but it's not what we wanted. In order to use square and curly brackets in text they need to be escaped. For that we have a section at the end of this article.
Meanwhile, let's figure out how both types of blocks - square brackets for applying styles and curly brackets for binding to data - work.
Data placeholders
Among other things TextFormatter will look for and will try to replace any data placeholders with real data.
Data placeholders are enclosed within curly brackets, and contain reference to what needs to be displayed. E.g.: {valueY}, {categoryX}, etc.
Data source
Now, where TextFormatter is looking for an actual data is a subject to a bit of a fuzzy logic.
Basically, when some object in the chart is trying to format a label, and its TextFormatter encounters a data placeholder, it goes like this:
- Can I find a value with such key in my own
dataItem? (if there's one) - Can I find a value with such key in my immediate parent's
dataItem? (if there's a parent and it has a data item) - Can I find a value with such key among my own properties?
- Can I find a value with such key among my parent's properties? What about other ancestors in the ascendancy ladder?
Whenever an existing value is encountered, it stops looking forward, applies appropriate Formatter to it (e.g. if it's a numeric value, NumberFormatter will be applied), then replaces it in a target string.
Placeholder examples
Let's explore data placeholders with an example.
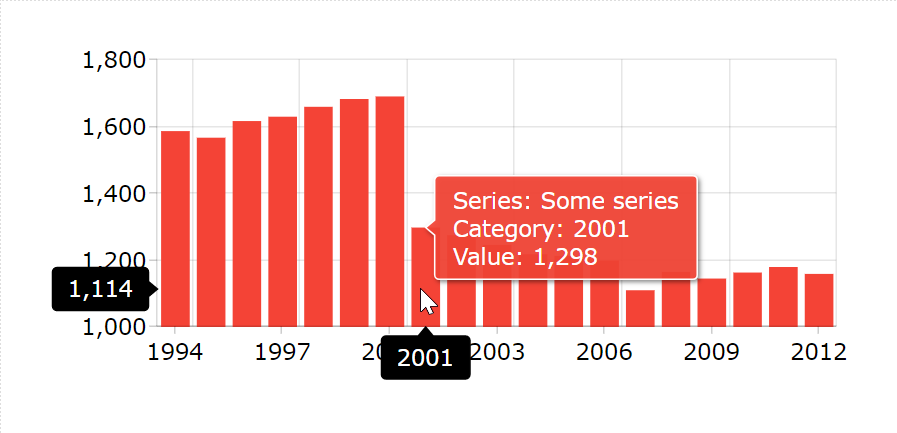
Say we have an XY chart with a ColumnSeries. We want to make the tooltip for each column in the series to display the following information:
- Name of the series;
- Category of the column;
- Value of the column.
To set a template for the tooltip contents, we can use series' tooltipText property.
Code-wise, this would look like this:
series.tooltipText = "Series: {name}\nCategory: {categoryX}\nValue: {valueY}";
series.tooltipText = "Series: {name}\nCategory: {categoryX}\nValue: {valueY}";
{
  // ...
  "series": [{
    "type": "ColumnSeries",
    "tooltipText": "Series: {name}\nCategory: {categoryX}\nValue: {valueY}"
  }]
}
Now, let's explore what happens when TextFormatter is populating this string template.
- Encounters
"name". There's no property with such key in neither each individual column, nor their respective data items. Formatter looks in the column's parent, which is ColumnSeries, which does have a propertyname. - Encounters
"categoryX". Now, there's a property in columns data item with such key, a category value is extracted. - Encounters
"valueY". Same like with category, this is too present in columnds individual data item.
An voila, we've got ourselves a tooltip with dynamically populated data from a number of different sources:
series.tooltipTextX/Y in placeholders
As you noticed, most of the fields are identified by either "X" or "Y" suffix. Let's figure those out.
In amCharts 4, any chart axis - vertical (Y) or horizontal (X) - can be any axis type.
Typically, a Series will be attached to one horizontal and one vertical axis.
The suffix in the data placeholder identifies which scale we are looking for our values. It is regulated by the type of axes.
Taking the previous example, the horizontal axis is a CategoryAxis. Since category axes have only static categories, and the axis is horizontal, we can extract series' individual columns category via {categoryX} placeholder.
If we had category axis as vertical axis, we'd use {categoryY}.
Similarly, we have a ValueAxis for a vertical axis. Since ValueAxis contains numeric value scale, and it's vertical, we are referring to the value using {valueY} placeholder.
Placeholders for numeric values
A special note about numeric placeholders. (valueX and valueY)
You can use those just like that, like we saw in all previous examples, if all you need to is to display it's source value.
However, the numeric value object contains pre-calculated derivative values, like say previousChange, or sum. Such aggregate values can be accessed by appending a modifier to a data placeholder name, like this: {valueY.previousChange}.
NOTE The calculated values are for current selection only, not the whole data range.
Here's the full list of modifiers:
| Key | Example | Comment |
|---|---|---|
value |
valueX.value |
Input value. (the same as using without modifier) |
open |
valueX.open |
Open value of the item or series. |
high |
valueX.high |
Biggest value of the item or series, within current selection. |
low |
valueX.low |
Smallest value of the item or series, within current selection. |
close |
valueX.close |
Close value of the item or series. (alias to value) |
sum |
valueX.sum |
Sum of all values in a series, within current selection. |
count |
valueX.count |
Number data items in series, within current selection. |
average |
valueX.average |
Average values in a series, within current selection. |
percent |
valueX.percent |
Indicates percent part of data item's value is within the sum of all series data items, within current selection.
NOTE For |
change |
valueX.change |
Difference between items open and close values. |
changePercent |
valueX.changePercent |
Difference between items open and close values in percent. |
previousChange |
valueX.previousChange |
Difference between value of current and previous items. |
previousChangePercent |
valueX.previousChangePercent |
Difference between value of current and previous items, in percent. |
total |
valueX.total |
STACKED SERIES ONLY Sum of all values in a series.NOTE This is only calculated if related Axis' calculateTotals is set to true. |
totalPercent |
valueX.totalPercent |
STACKED SERIES ONLY Sum of all values in a series.NOTE This is only calculated if related Axis' calculateTotals is set to true. |
stack |
valueX.stack |
STACKED SERIES ONLY Value this item is stacked onto. |
In-line formatting
In most cases, when using data placeholders, the chart will automatically know how to format values according to its type or source.
You can, however, override format or force type using in-line formatting functions for the placeholders.
The syntax goes like this: {reference.formattingFunction(parameters).
E.g.: {valueY.formatDuration('mmm')}.
This allows forcing not only specific format, but also telling which formatter to use.
Below is the list of available such functions, with links for more information.
| Function | Example | Comment |
|---|---|---|
formatDate() |
{dateX.formatDate('yyyy-MM-dd')} |
More info |
formatDuration() |
{valueY.formatDuration('mm:ss')} |
More info |
formatNumber() |
{valueY.formatNumber('###.00')} |
More info |
urlEncode() |
https://www.google.com/?s={category.urlEncode()} |
More info |
Limitations
NOTE Please note that when using placeholders to reference actual data keys, round brackets are not supported, since they are reserved for in-line formatting functions. E.g. this will not work: {Budget (USD)} even if data contains such keys.
Visual formatting
As we briefly touched in out our introductory article on Formatters, style directives are enclosed in in square brackets:
series.tooltipText = "{dateX}: [bold]{valueY}[/]";
series.tooltipText = "{dateX}: [bold]{valueY}[/]";
"series": [{
  // ...
  "tooltipText": "{dateX}: [bold]{valueY}[/]"
]}
As expected, the above [bold]...[/] enclosure will ensure that any text, including dynamically populated data, will be displayed in bold.
Closing bracket
A brief note about the closing [/] bracket.
Since style directives can be combined, there's no need to match closing bracket to the opening one. The following is wrong: [bold]...[/bold][bold]...[/].
Closing bracket is also optional. If there's no closing bracket following opening one the style will be automatically terminated by either next opening style block or end of the string, whichever come first.
The following is perfectly valid: [bold red]Value is: [#0f0]{valueY.value}.
List of codes
| Code | Example | Example output | Comment |
|---|---|---|---|
"bold" |
Hello [bold]world[/]! |
Hello world! | Makes enclosed text bold. |
Named color |
Hello [red]world[/]! |
Hello world! | Paints enclosed text using named color. |
RGB |
Hello [#00ff00]world[/]! |
Hello world! | Paints enclosed text using an RGB color code. |
In-line CSS |
Hello [font-size: 30px]world[/]! |
Hello world! | Applies any style attribute(s), just like you would add them directly to style property of the element. |
Combining styles
You can combine several style directives into one, e.g. [bold #f00 font-size: 30px]...[/].
Line breaks
To insert a simple line break use JS-standard \n symbol., e.g. So it begins...\nand ends on a second line..
Example
Here's a working example demonstrating all of the above formatting options in action:
See the Pen amCharts 4: Text formatter (1) by amCharts (@amcharts) on CodePen.
Escaping
Let's come back to the fox/dog example we used in the introductory part of this article:
"Quick [fox] jumps over lazy {dog}"
As we mentioned before, both square and curly brackets need to be escaped if we wanted to use them as they are.
Escaping is done by duplicating the bracket:
"Quick [[fox]] jumps over lazy {{dog}}"
Now, when we use that in a label, the formatter will know, that we wanted to display the brackets, not denote formatting/data blocks.
let label1 = container.createChild(am4core.Label);
label1.text = "Quick [fox] jumps over lazy {dog}";

let label2 = container.createChild(am4core.Label);
label2.text = "Quick [[fox]] jumps over lazy {{dog}}";
var label1 = container.createChild(am4core.Label);
label1.text = "Quick [fox] jumps over lazy {dog}";

var label2 = container.createChild(am4core.Label);
label2.text = "Quick [[fox]] jumps over lazy {{dog}}";
"series": [{
  // ...
  "children": [{
    "type": "Label",
    "text": "Quick [fox] jumps over lazy {dog}"
  }]
]}
Let's try that in a very simple demo:
See the Pen amCharts 4: Text formatter by amCharts (@amcharts) on CodePen.
All characters that do not represent a pattern code will be left as is.
Bracket syntax errors
IMPORTANT Formatters aren't concerned with validating the actual brackets, whether individually, in pairs, or so on. Invalid, unescaped brackets will have unpredictable results, e.g. my IDE/editor does code completion, so as I type [, it closes it with ], but I forget that, continue typing, ending up with: []bold]NOT YELLING, JUST SAYING.. That just prints bold, instead of the intended sentence. So be sure the use of brackets are valid.
Relation to value/date formats
This is important, so read up!
Whenever the label includes some data value (via curly brackets) the value is formatted via separate formatter, that is relevant to the format of the value.
For example numeric values are pre-formatted by a Number formatter. Dates are formatted by Date formatter.
Additional/different rules may apply there, so make sure you read about each of those in their own articles. (linked above)