This article will explain how to implement feature-rich maps with amCharts 4.
Creating a Map
As with any other chart type, Map Chart requires an instance object to be able to do anything. To create a chart, we'll use MapChart class.
A Map to be useful will at least need to have these elements:
- Map chart instance
- Map definition (in GeoJSON format);
- At least one map series.
We'll walk you through these basics before jumping on to more advanced topics.
Importing modules/scripts
Needless to say, before you can use amcharts4 module/object, you need to make sure all required modules (in TypeScript or ES6), or files (in JavaScript) are imported. Please refer to our Getting started articles for more details:
For a Map chart, we'll need to import core (main module), maps module, and a map file in GeoJSON format.
import * as am4core from "@amcharts/amcharts4/core";
import * as am4maps from "@amcharts/amcharts4/maps";
import am4geodata_worldLow from "@amcharts/amcharts4-geodata/worldLow";
<script src="//cdn.amcharts.com/lib/4/core.js"></script>
<script src="//cdn.amcharts.com/lib/4/maps.js"></script>
<script src="//cdn.amcharts.com/lib/4/geodata/worldLow.js"></script>
We'll be importing and referring these as am4core and am4maps in the course of this article, and overally in our demos and tutorials.
As for map geodata, we'll be using am4geodata_[map name] syntax.
Map data
In amCharts 4, actual map data (map files) are located separately from the actual libraries.
The reason for this is that map files tend to be big, and there are a lot of them. We don't want you to have to download tens of megabytes of map data, if all you want to do is to draw a Pie chart, do we?
TypeScript/ES6
If you are using TypeScript/ES, import files from a separate package: @amcharts/amcharts4-geodata.
JavaScript
If you are using amCharts CDN to load the files, you're all set.
If you are installing all files on your own server, please make sure to download a separate ZIP file containing all the map data files.
Creating map instance
To create an instance we'll use am4core.create() function. (or am4core.createFromConfig() if you are using JSON-based config approach)
let map = am4core.create("chartdiv", am4maps.MapChart);
var map = am4core.create("chartdiv", am4maps.MapChart);
var map = am4core.createFromConfig({
  // ... map config
}, "chartdiv", am4maps.MapChart);
Map definition
There's an important distinction between "Map chart" and "Map definition".
The first is an instance, an object, like any other chart type, which we use to configure our map control.
The latter is a data file, which contains actual geographical data, used to draw map, like contours of countries, etc. amCharts 4 accepts map definitions in GeoJSON format.
About GeoJSON
"GeoJSON is a format for encoding a variety of geographic data structures." - that's how its creators describe it.
We chose it to be used in our library because
- It's open (no corporation behind it);
- Has a lot of sources for free, ready-made maps;
- Is widely adopted in the industry;
- There is a lot of geo software tools that can be used to create and edit maps.
MORE INFO Check official GeoJSON website and their RFC specs.
Using map definition
To make the Map chart use specific map definition, simply set map instance's geodata property.
If you are using TypeScript or ES6 modules, the loaded definition will be in whatever name you specified during import. For plain JavaScript all bundled map definitions end up in am4geodata_[map name] object, and are accessible via map name as key.
map.geodata = am4geodata_worldLow;
map.geodata = am4geodata_worldLow;
var map = am4core.createFromConfig({
  "geodata": am4geodata_worldLow,
  // Alternatively we could do this:
  // "geodata": "worldLow",
  // ... map config
}, "chartdiv", am4maps.MapChart);
NOTE ABOUT JSON In JSON-based setup, it's possible to specify the map by its name: geodata: "worldLow". If your map is loaded via <script> tag, it will automatically replace the contents of geodata with proper JSON.
Regional and county maps
Since version 4.0.12 geodata package contains county maps for the U.S.
They are located in region/usa subdirectory, and are accessed somewhat differently than regular maps.
Please read this tutorial for further information.
Loading external maps
You're not limited to just using bundled maps. You can use any map definition in GeoJSON format you can lay your hands on.
To make your Map chart automatically load such external file, use geodataSource.url setting instead of geodata.
Here's how it would look:
map.geodataSource.url = "/path/to/myCustomMap.json";
map.geodataSource.url = "/path/to/myCustomMap.json";
{
  // ...
  "geodataSource": {
    "url": "/path/to/myCustomMap.json"
  }
}
For the purpose of this article we are going to be using bundled maps and geodata. But if you'd rather go with geodataSource approach, everything in this article will still apply and work for you.
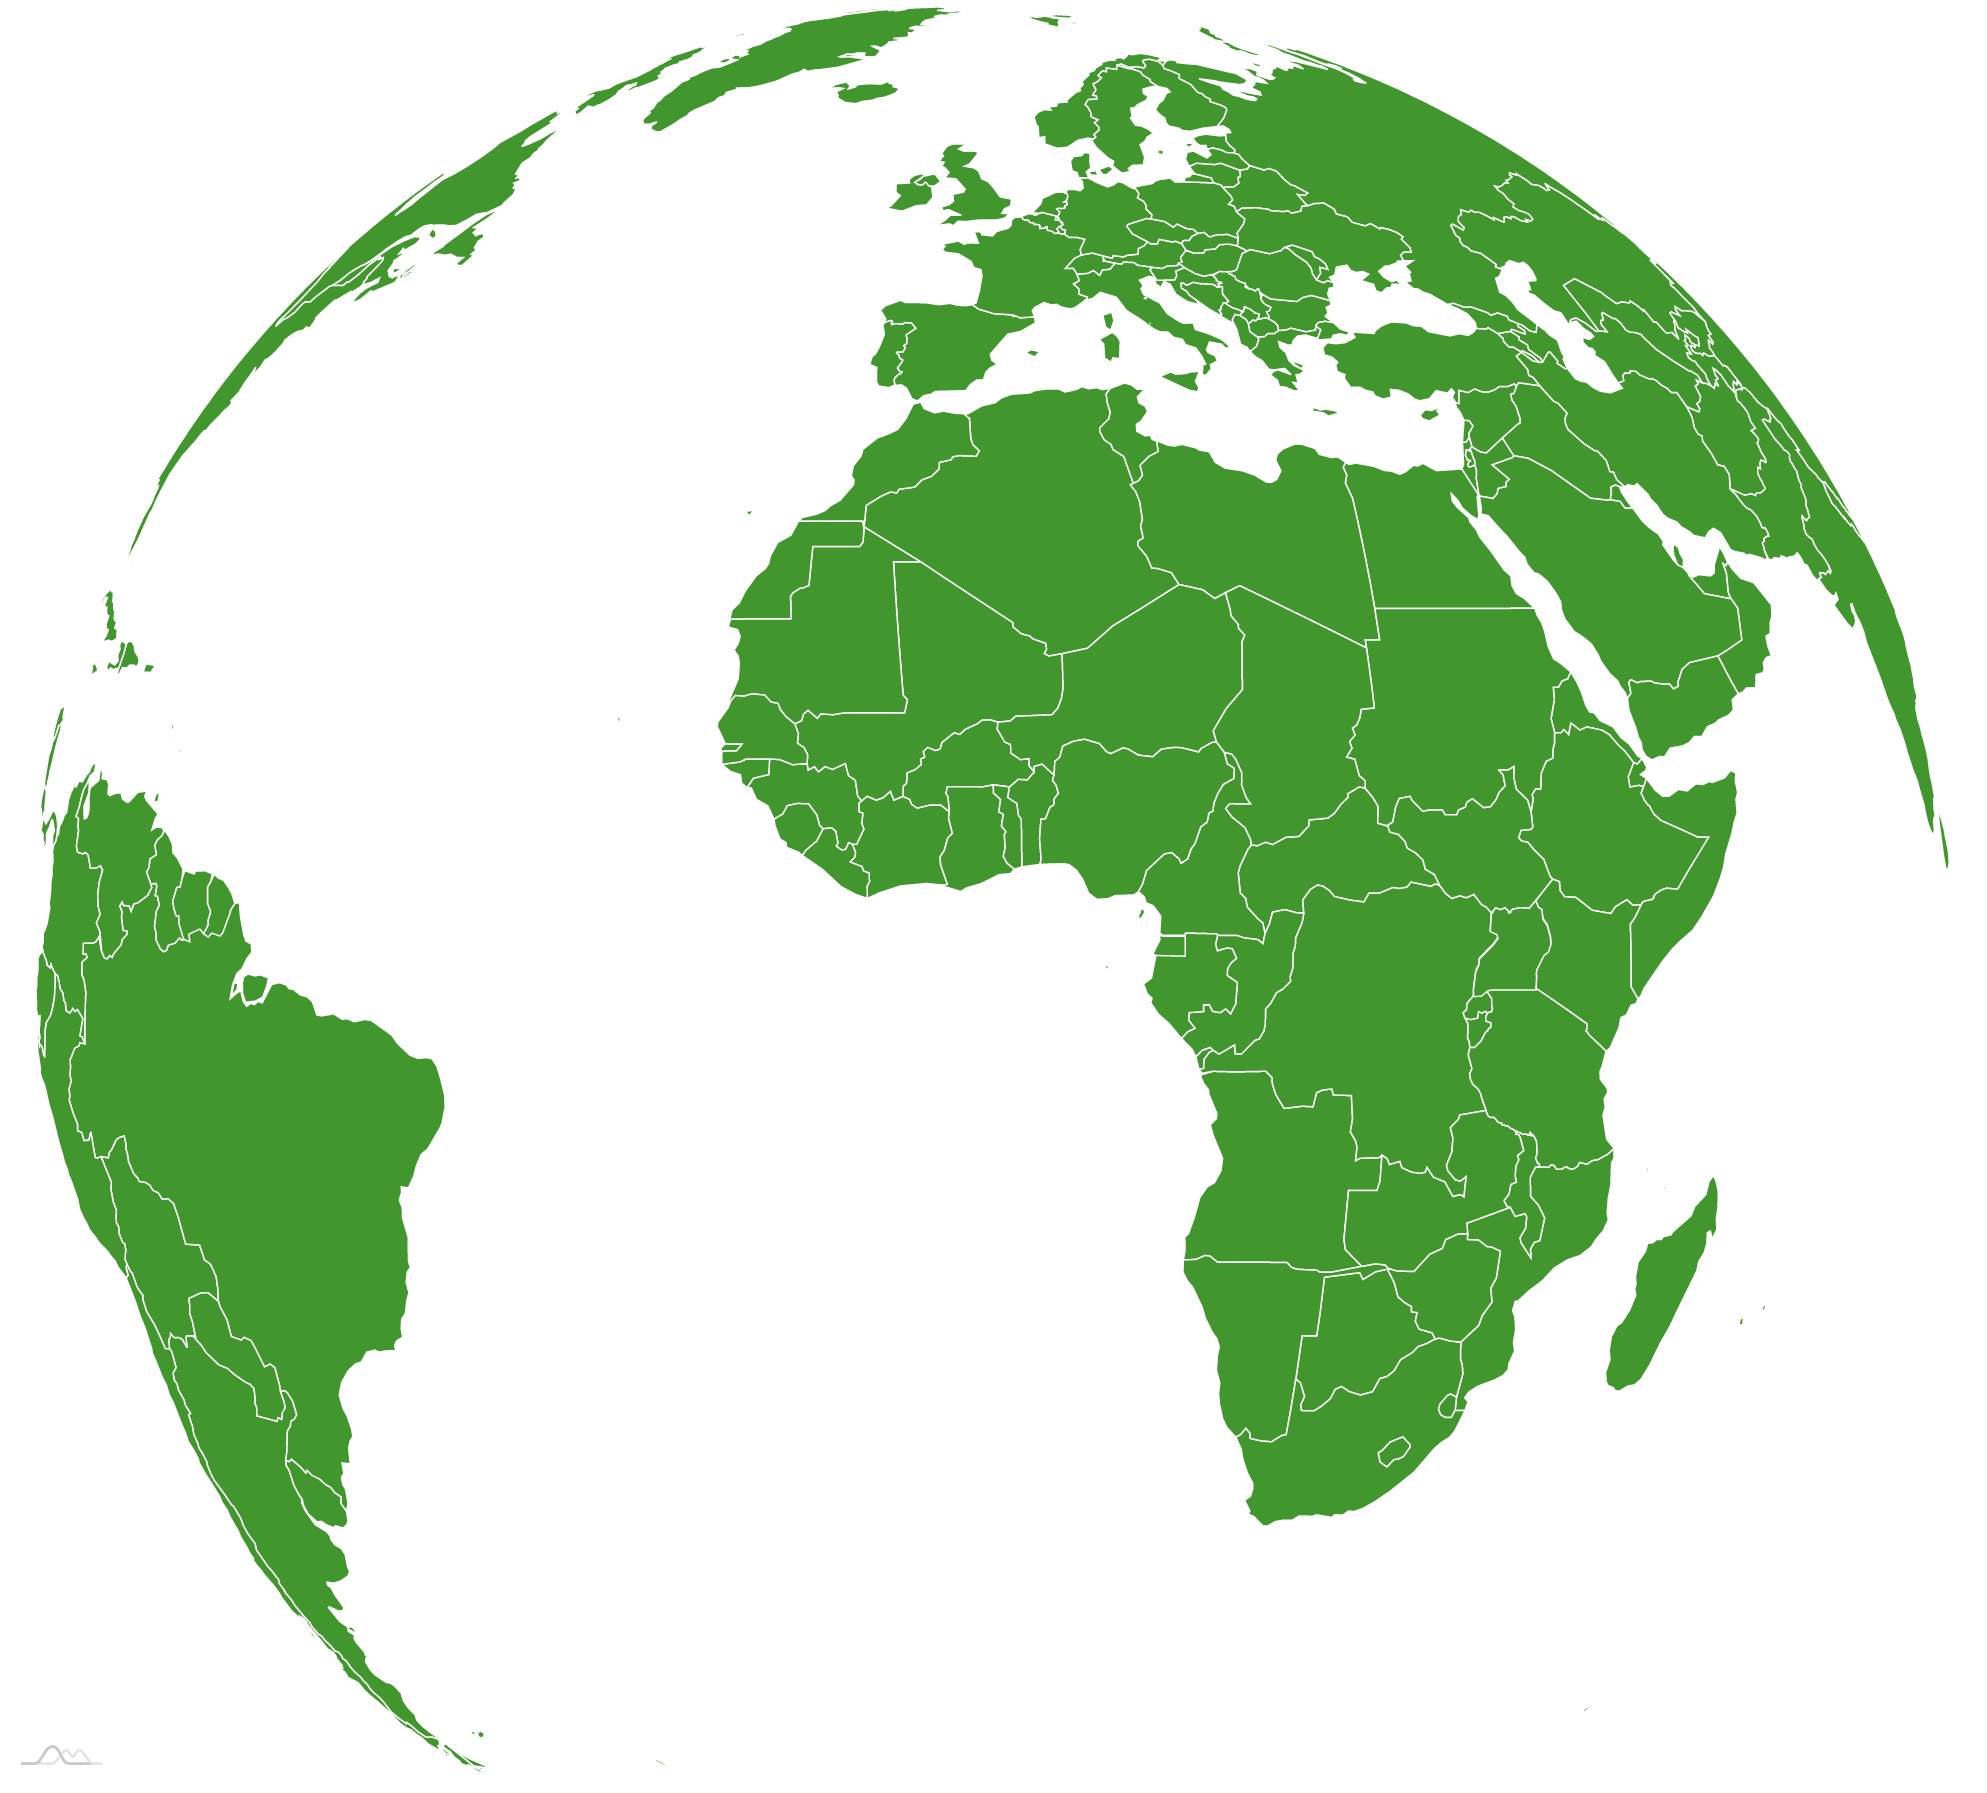
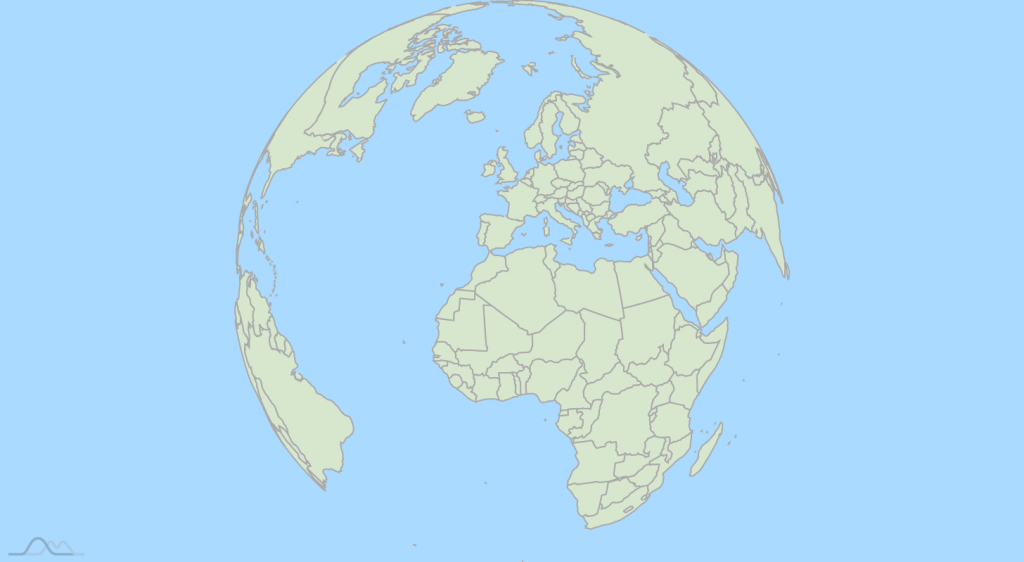
Setting projection
There's no proper way to "flatten out" a globe into a 2-dimensional sheet without severely distorting it.
Mapping community has been dealing with this issue since the dawn of maps. There are numerous ways and techniques to do that, and they are called "projections".
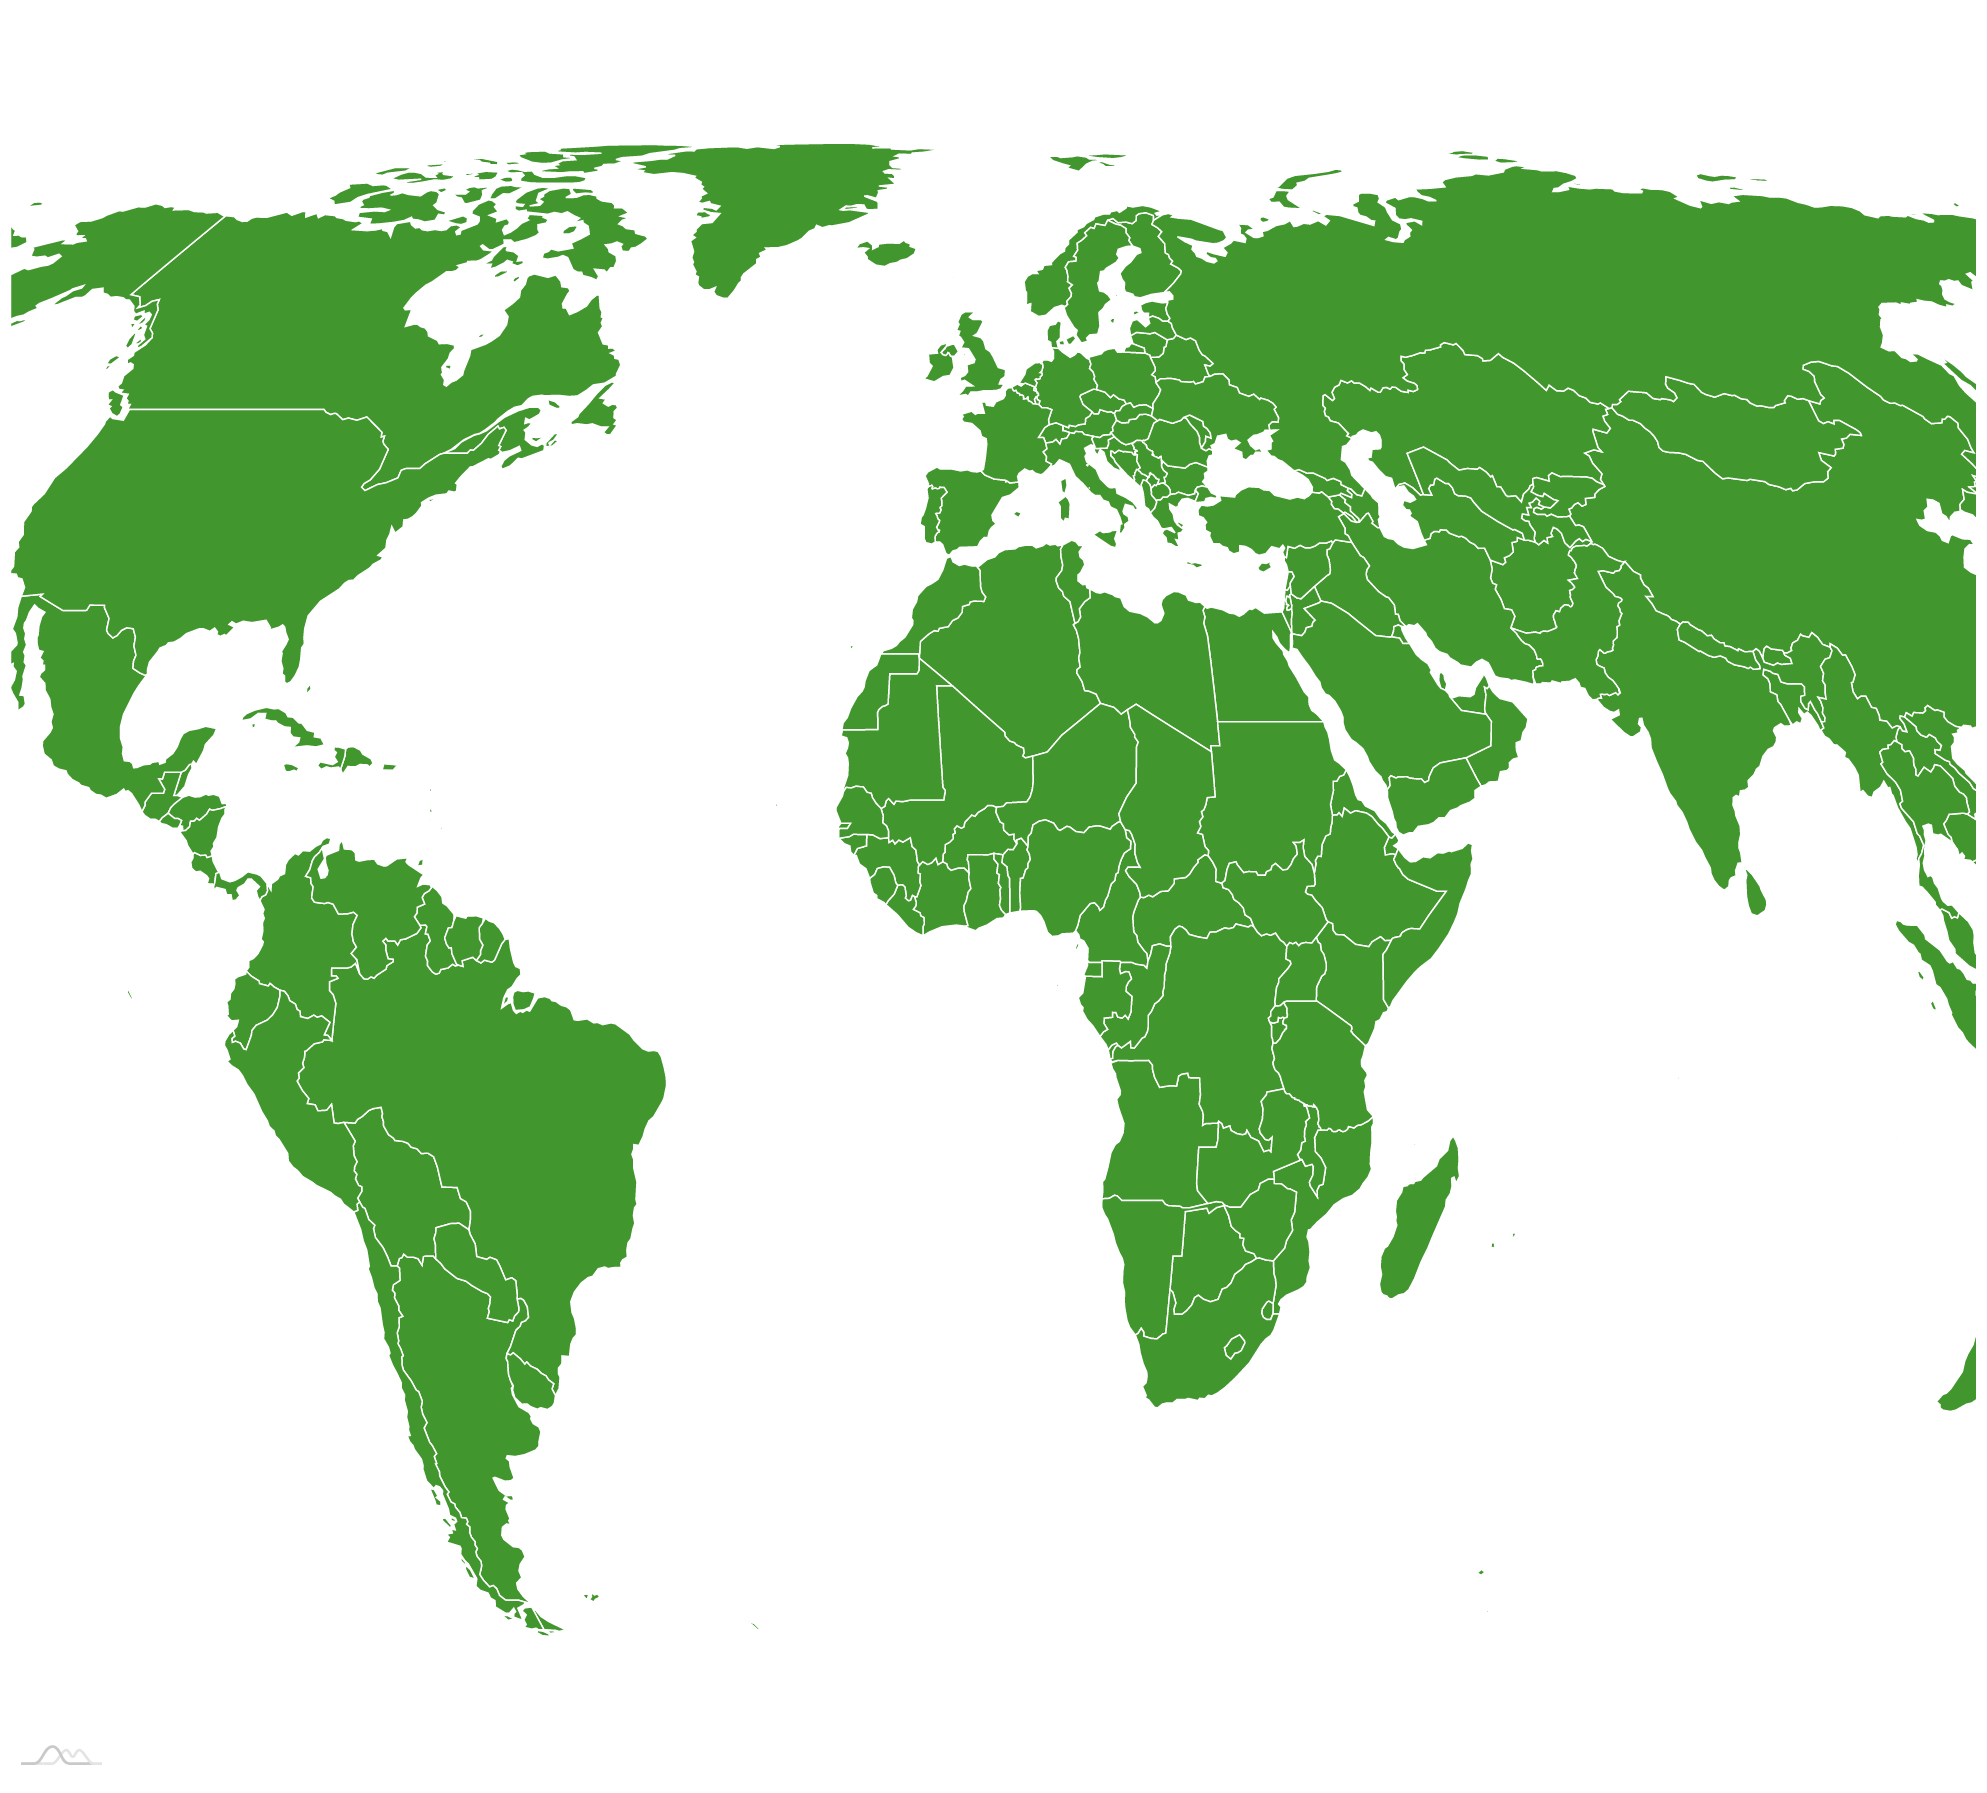
In amCharts 4, by default all maps are displayed in Equirectangular projection.
To display a map in some other projection, use maps' projection property. In amCharts 4 all projection class definitions are accessible via am4maps.projections variable. We just need to instantiate a proper one as object, and assign to projection property.
At this moment we support following projections:
am4maps.projections.Albers (since 4.3.0) |
 |
am4maps.projections.AlbersUsa (since 4.3.0; more info) |
 |
am4maps.projections.AzimuthalEqualArea (since 4.3.0) |
 |
am4maps.projections.Eckert6 |
 |
am4maps.projections.EqualEarth (since 4.3.0) |
 |
am4maps.projections.Projection (default "Equirectangular" projection) |
 |
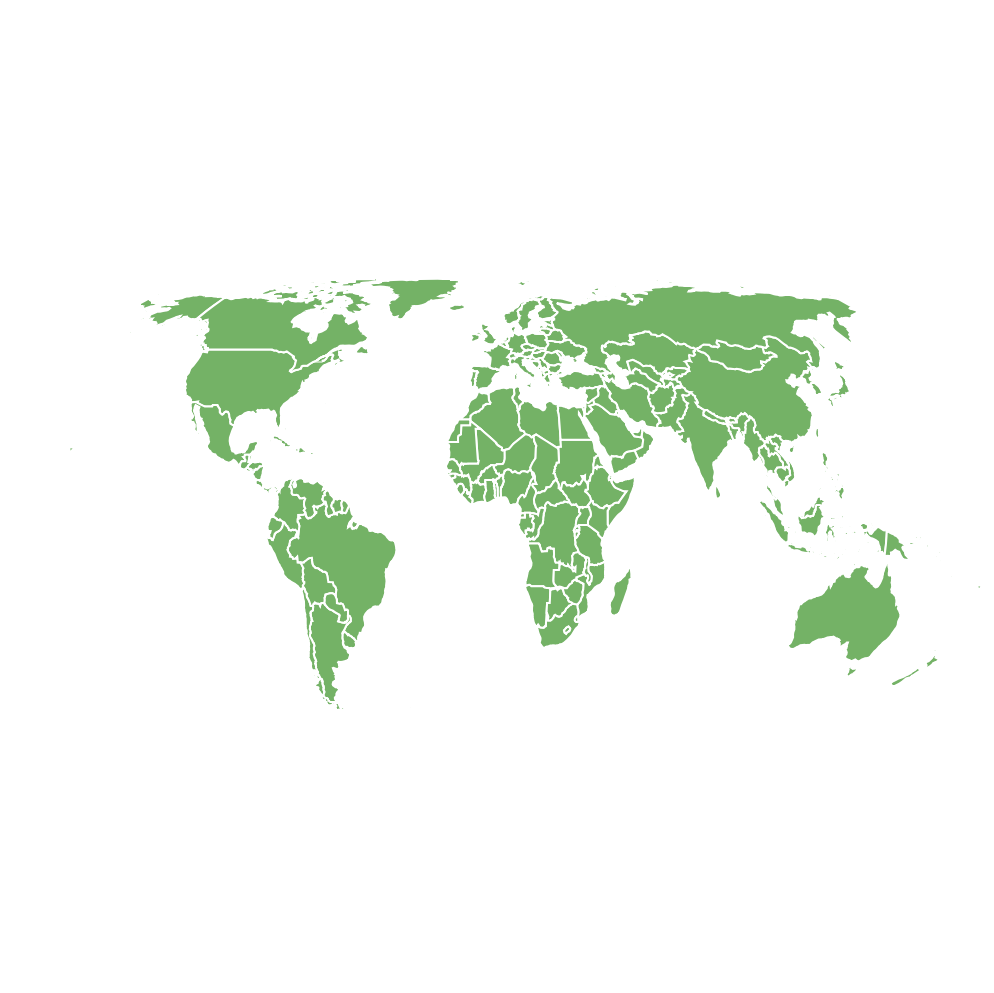
am4maps.projections.Mercator |
 |
am4maps.projections.Miller |
 |
am4maps.projections.NaturalEarth1 (since 4.3.0) |
 |
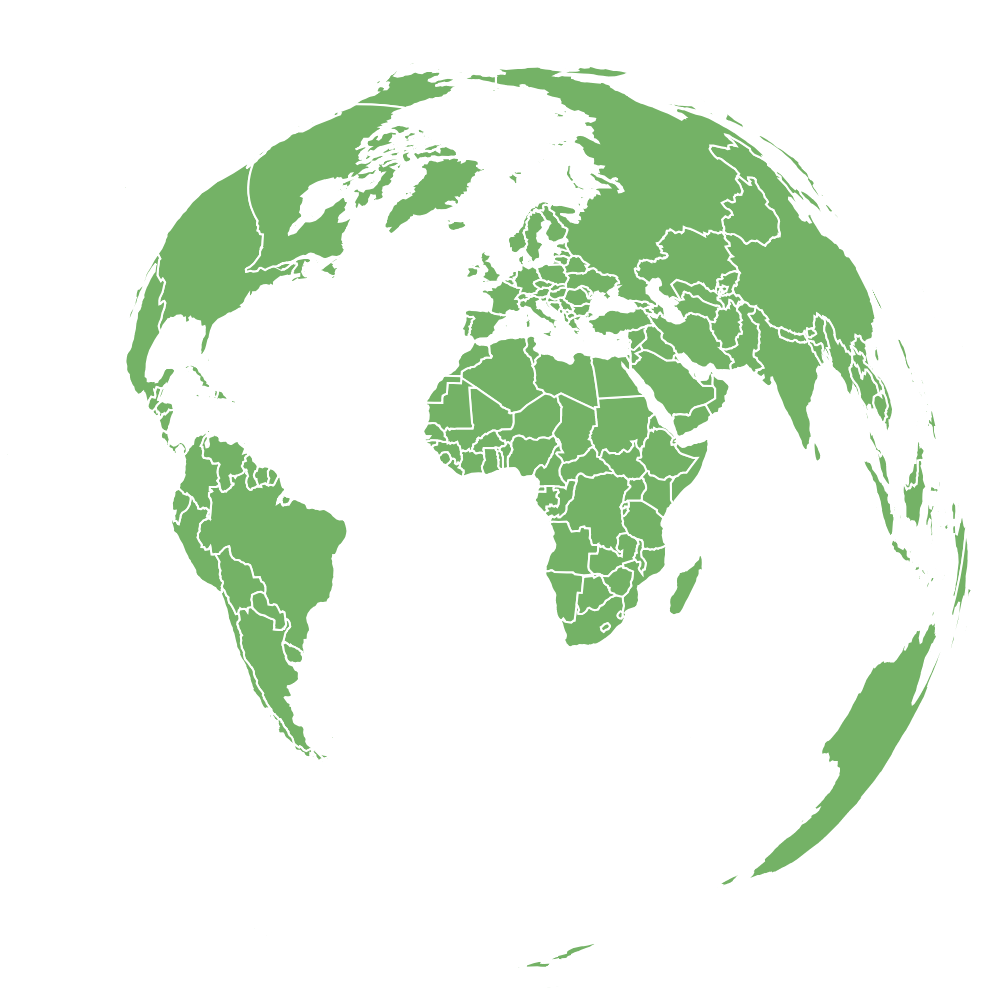
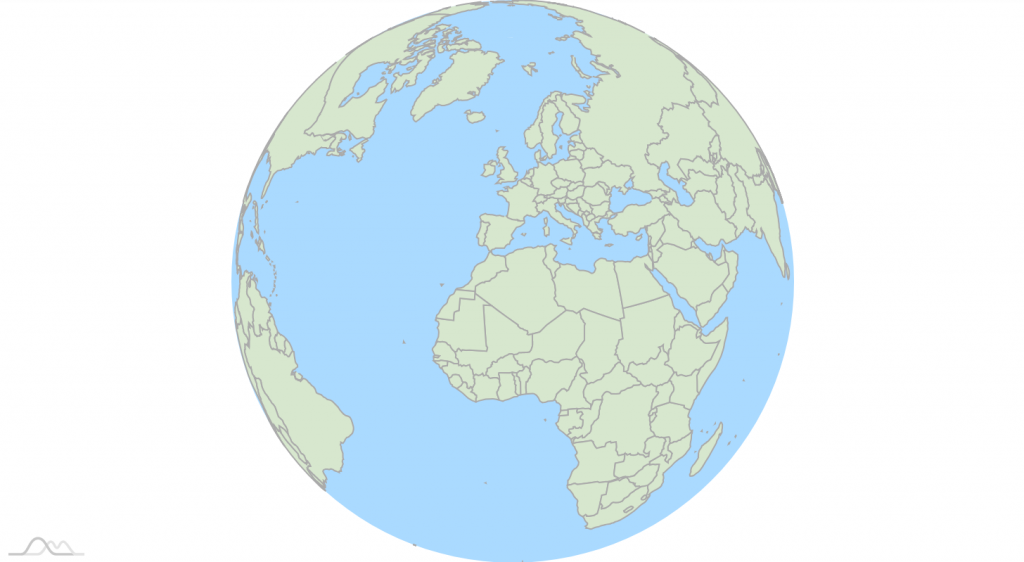
am4maps.projections.Orthographic |
 |
am4maps.projections.Stereographic (since 4.3.0) |
 |
Let's set our map to use "Miller" projection:
map.projection = new am4maps.projections.Miller();
map.projection = new am4maps.projections.Miller();
var map = am4core.createFromConfig({
  "geodata": am4geodata_worldLow,
  "projection": "Miller",
  // ... map config
}, "chartdiv", am4maps.MapChart);
NOTE Not finding projection you need? You can also use any of the D3's projections in amCharts 4.
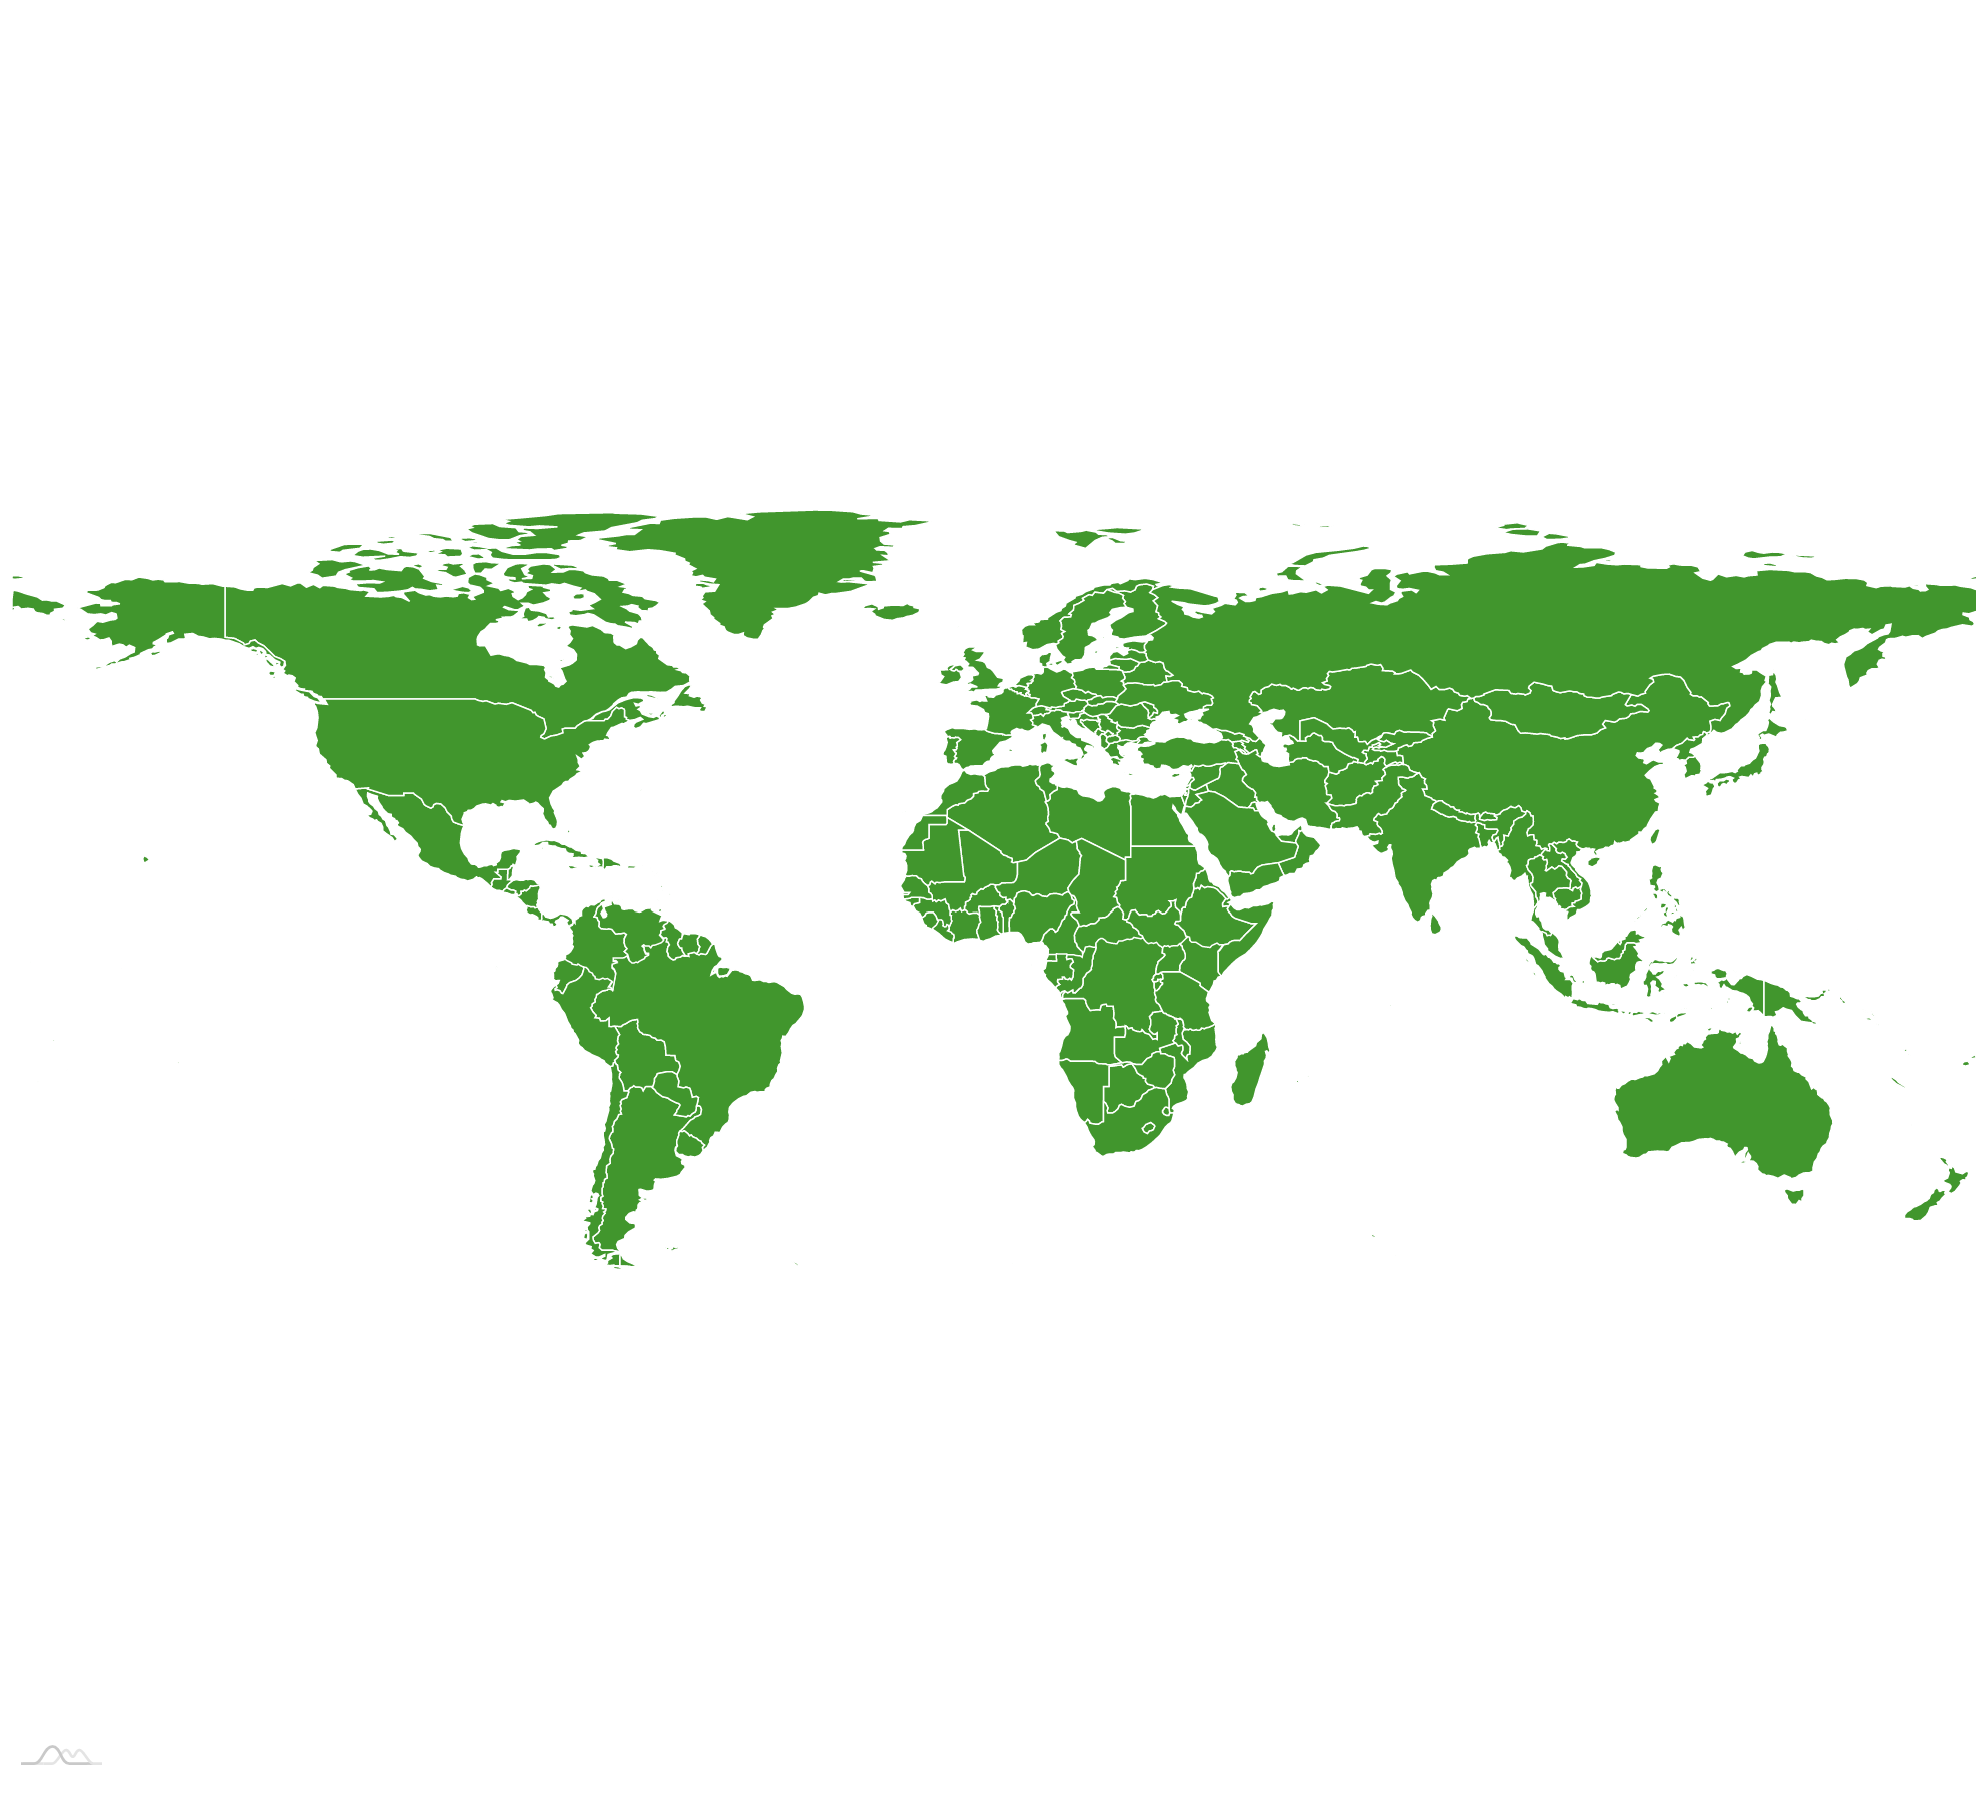
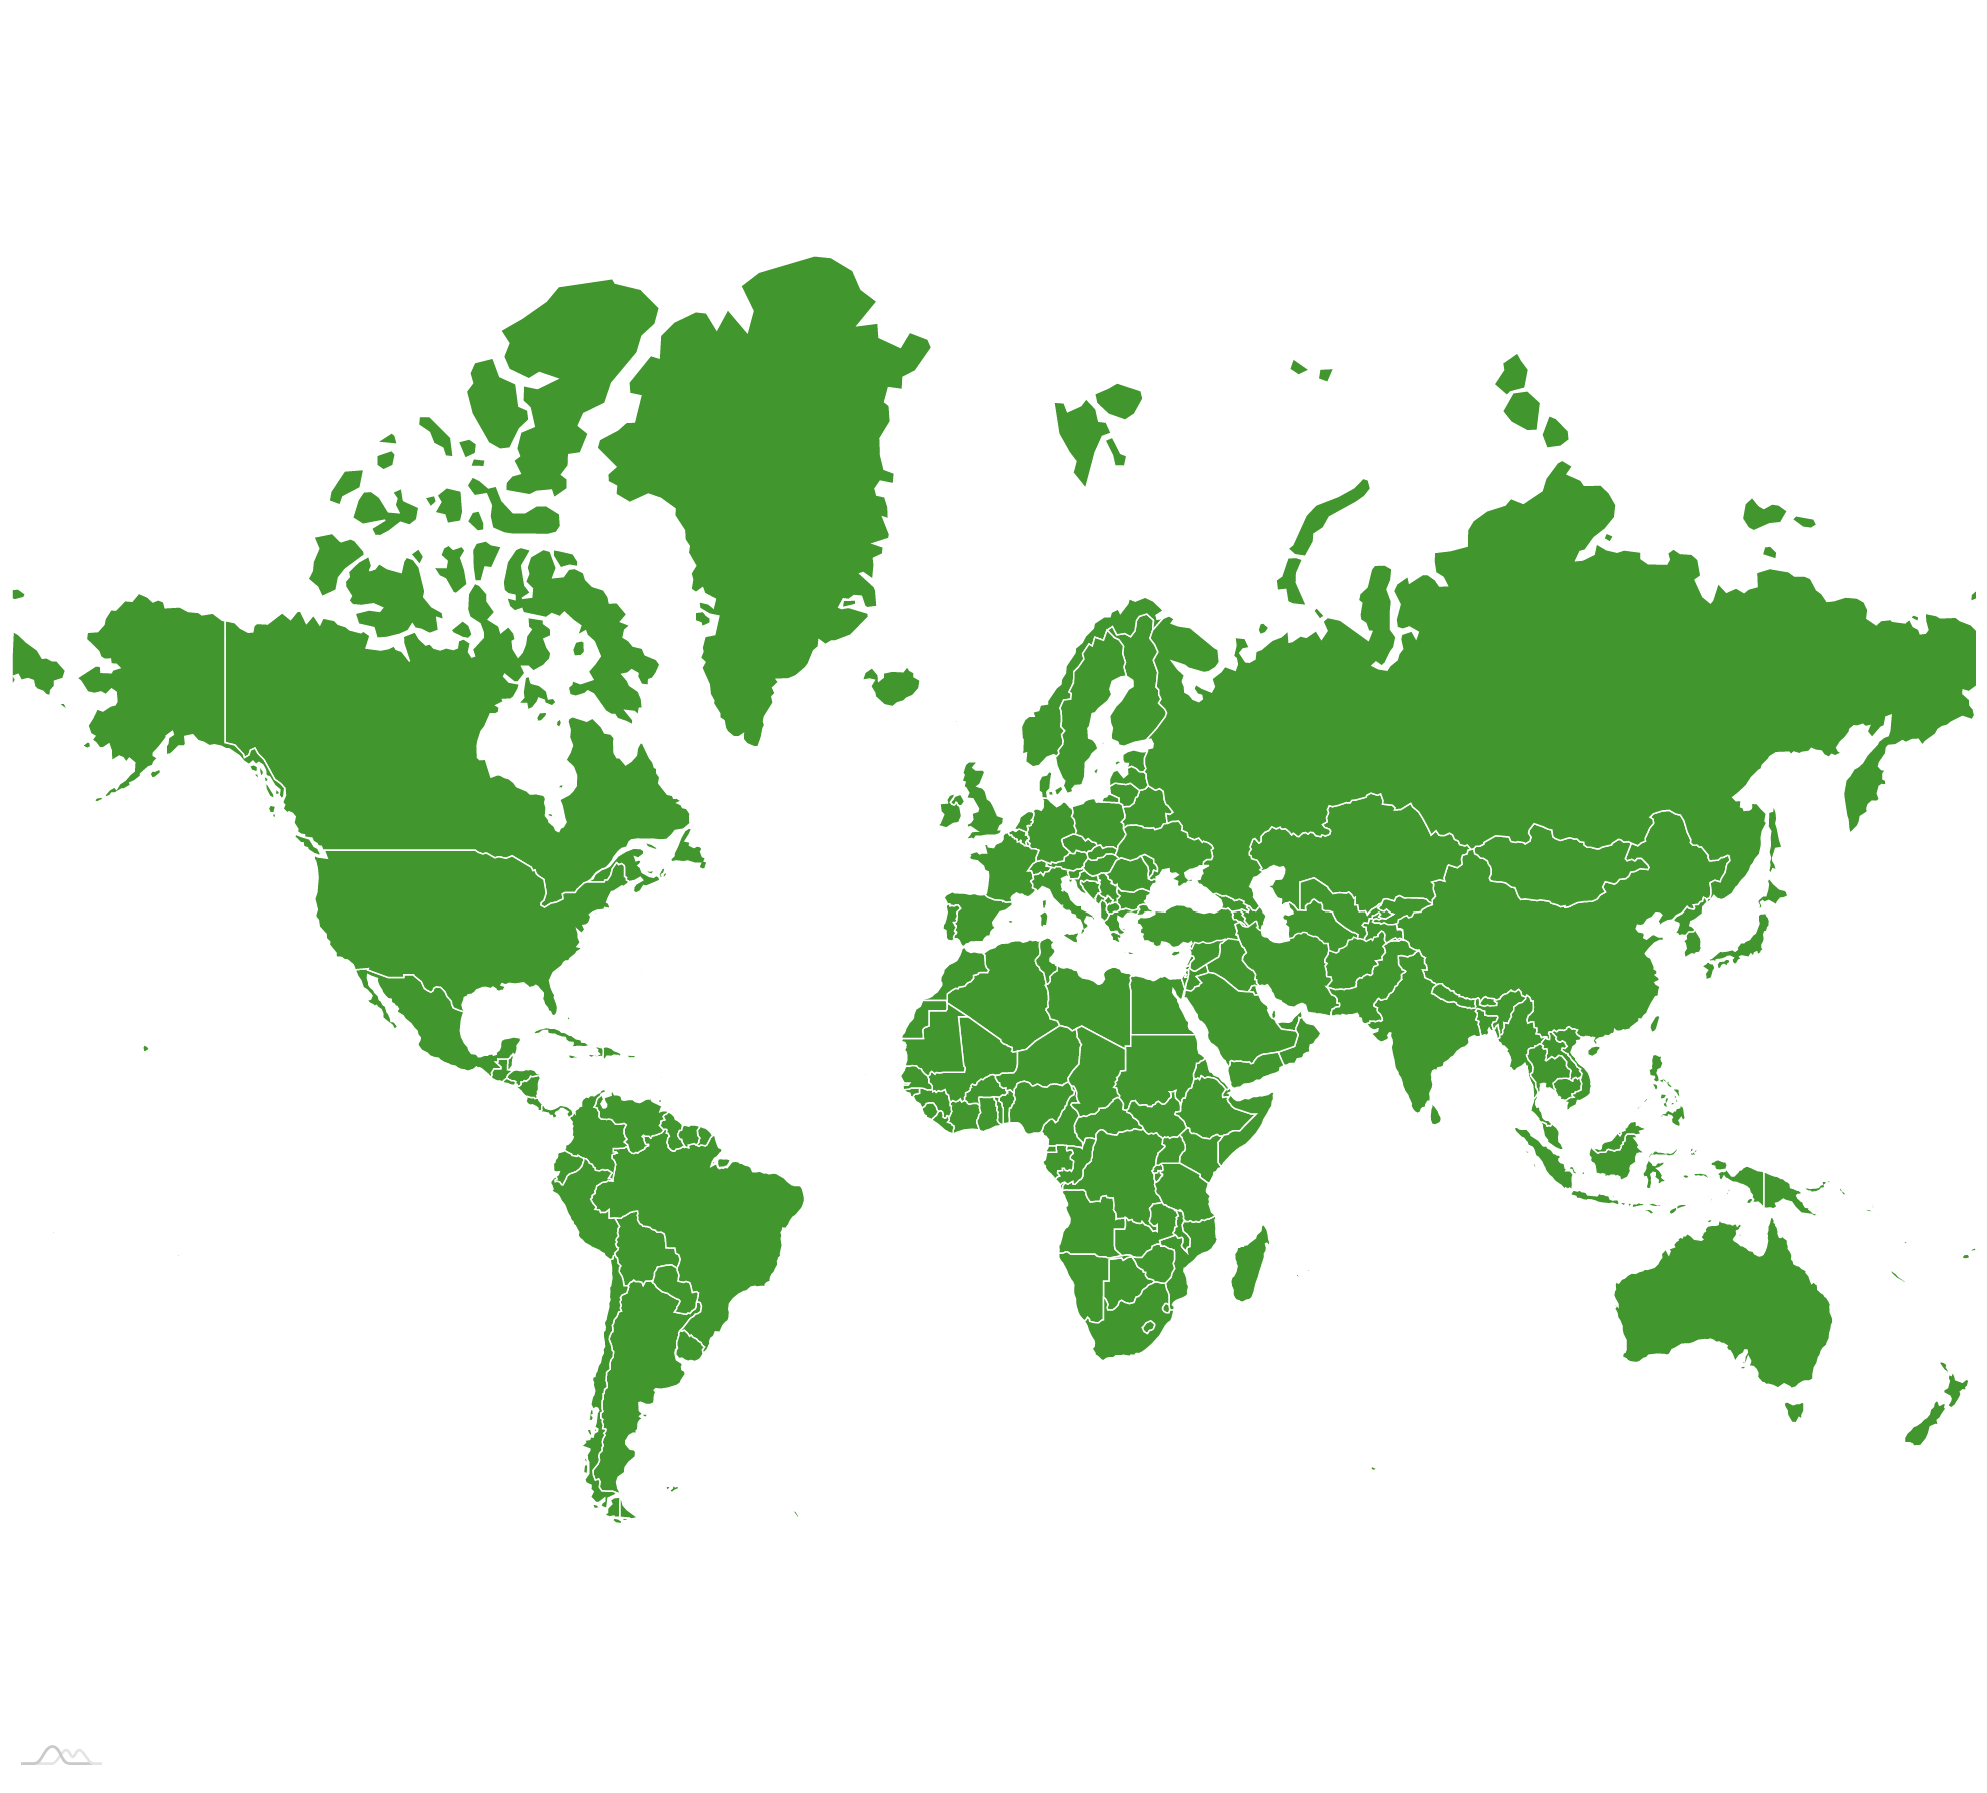
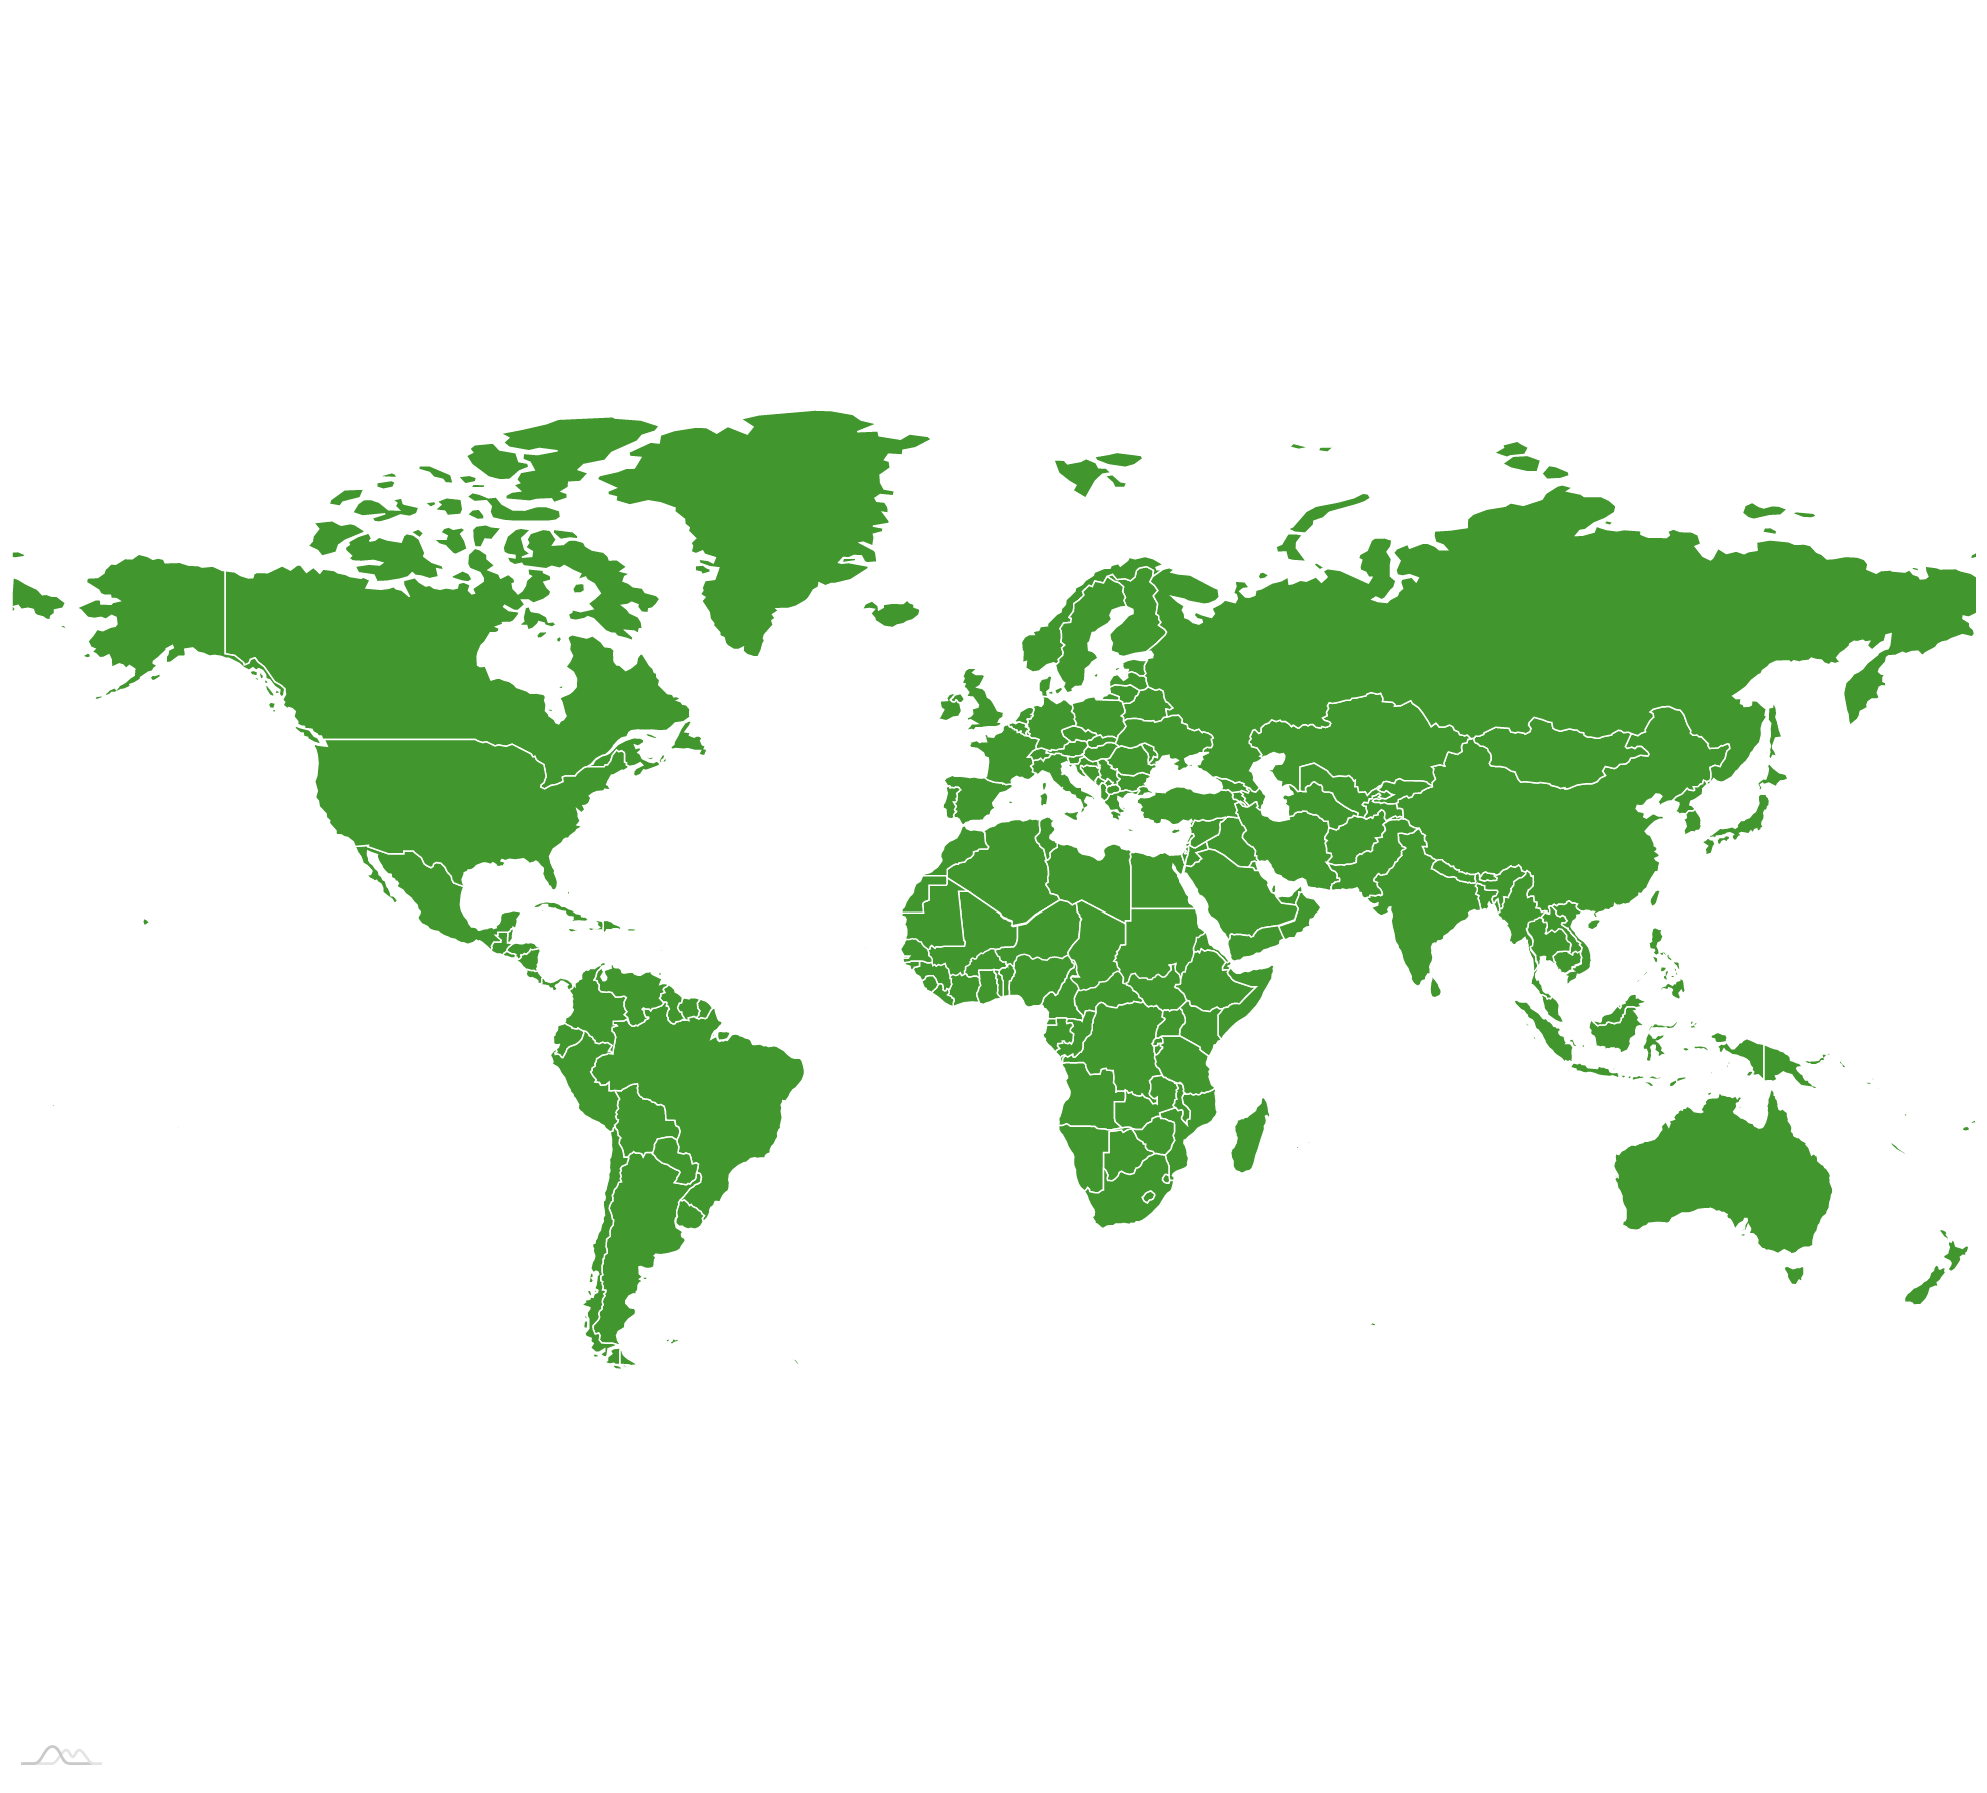
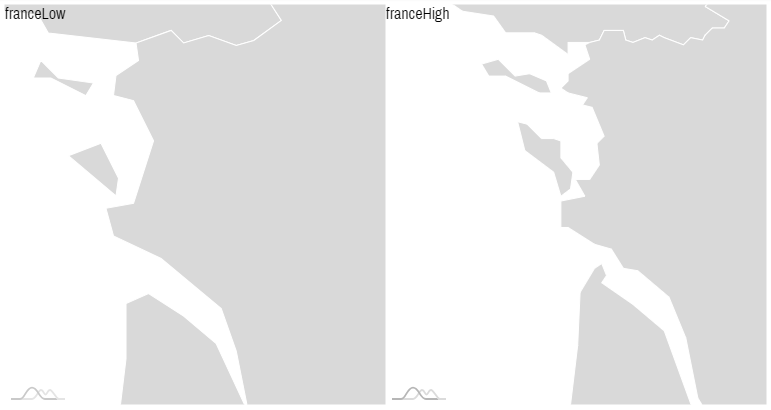
Bundled maps
Most of maps, bundled with amCharts 4 come in two flavors: high detail and low detail. The modules/files are indicated with "High" and "Low" suffixes respectively.
High-detail versions provides finer border and coastal lines, but they are significantly larger.
Low-detail ones are much smaller in size, but at the expense on details. Since map lines are generalized, using low-detail maps may plot some coastal markers off-shore.
It's up to you to decide which one of the trade-offs suit your requirements best.
NOTE We're constantly adding new maps. Check currently available maps here.
Low vs high-detail
The choice between low or high detail map version comes down to your personal preferences and requirements.
Do you need it to load super fast and don't need a lot of detail? Low-detail version might seem a better choice.
That said, low-detail version has lines simplified to the point where small hooks, creeks, and even smaller islands might become unrecognizable or even vanish altogether.
If that seems to be a problem, opt for the high-detail version of the map.
Below is a side-by-side comparison of two versions of the map of France:
See the Pen amCharts V4: Map (Low vs High detail) by amCharts (@amcharts) on CodePen.
Please note, that while both maps might seem relatively fine when fully zoomed out, the difference become more and more prominent when zooming in:
Ultra-high detail
Since version 4.0.28 of geodata package, most world and region maps come also in "ultra high" detail. File names for those have *Ultra suffix, e.g. worldUltra.
Please note that higher-detail comes with extra file sizes, so make sure you really need all that detail before jumping in.
One final note: Ultra-detail on world/region maps are generated using same detail level as High-detail versions of country maps, so they are a good match for pairing, as it is described in "Overlaying multiple maps" section of this article.
Finding more maps
@todo Information being prepared.
Creating custom maps
Please refer to this article on creating custom maps.
Map series
The map differs from other chart types in such regard that it does not use standalone data. All of its data is passed in using various types of MapSeries, like MapPolygonSeries for configuring map geographical areas, such as countries.
We add series to map by instantiating an object out of the proper series class, then pushing them into map's series list.
NOTE We are going to use polygon series (MapPolygonSeries) in this section to explain generic concepts of the map series. Then, later on we will examine each different type of map series in detail.
Polygon (area) series
Creating polygon series
Map areas (countries, states, etc.) are represented by objects MapPolygonSeries.
Unless you like empty maps, a map has to have one or more polygon series, so it knows what to draw. Let's create one:
let polygonSeries = new am4maps.MapPolygonSeries();
map.series.push(polygonSeries);
var polygonSeries = new am4maps.MapPolygonSeries();
map.series.push(polygonSeries);
var map = am4core.createFromConfig({
  // ... map config
  "series": [{
    "type": "MapPolygonSeries"
  }]
}, "chartdiv", am4maps.MapChart);
Loading series data
Now, for the series to be really useful, we need data for it. The data can either come from the map definition (GeoJSON), be set directly to series via its data property, or, like you will see in a moment, combined from the two sources.
Obviously, for polygon series we need the geographical data defining the curvature of their outlines. While you can add that directly to data it would be super inconvenient.
For this job we have a handy series' setting: useGeodata. Set it to true and it will load data for all polygons available in map definition we have already loaded earlier in this article.
let polygonSeries = new am4maps.MapPolygonSeries();
polygonSeries.useGeodata = true;
map.series.push(polygonSeries);
var polygonSeries = new am4maps.MapPolygonSeries();
polygonSeries.useGeodata = true;
map.series.push(polygonSeries);
var map = am4core.createFromConfig({
  // ... map config
  "series": [{
    "type": "MapPolygonSeries",
    "useGeodata": true
  }]
}, "chartdiv", am4maps.MapChart);
Let's see how this looks like:
See the Pen amCharts V4: Map (simple, step 1) by amCharts (@amcharts) on CodePen.
Configuring series
Like with most series in amCharts 4, we configure appearance and behavior of its items by accessing templates.
Template for polygon services resides in its mapPolygons property. The series' mapPolygons.template is a "template" object of type MapPolygon. You can set any property there and it will be automatically applied to all map polygons in the series.
To make the map more interactive let's set tooltipText so that it would display a tooltip, as well as fill to exchange bland gray into something more lively, and finally, add a slightly darker shade for hovered polygons by adding "hover" state:
// Configure series
let polygonTemplate = polygonSeries.mapPolygons.template;
polygonTemplate.tooltipText = "{name}";
polygonTemplate.fill = am4core.color("#74B266");

// Create hover state and set alternative fill color
let hs = polygonTemplate.states.create("hover");
hs.properties.fill = am4core.color("#367B25");
// Configure series
var polygonTemplate = polygonSeries.mapPolygons.template;
polygonTemplate.tooltipText = "{name}";
polygonTemplate.fill = am4core.color("#74B266");

// Create hover state and set alternative fill color
var hs = polygonTemplate.states.create("hover");
hs.properties.fill = am4core.color("#367B25");
{
  // ... map config
  "series": [{
    "type": "MapPolygonSeries",
    "useGeodata": true,
    "mapPolygons": {
      "tooltipText": "{name}",
      "fill": "#74B266",
      "states": {
        "hover": {
          "properties": {
            "fill": "#367B25"
          }
        }
      }
    }
  }]
}
Let's see how it turned out:
See the Pen amCharts V4: Map (simple, step 2) by amCharts (@amcharts) on CodePen.
MORE INFO For more about binding data in tooltip visit "Formatters" article.
MORE INFO For more about visual object states visit "States" article.
Object identifiers
Before we go any further, let's stop for a moment to talk about object identifiers.
Most of amCharts maps use ISO2 standard for ID'ing countries and their states.
For multi-country maps, this means all polygons will have a two letter code, e.g. "US" for United States, "FR" for France, and so on.
Country subdivisions use the following identification principle: [ISO2 country code]-[ISO state code]. E.g. "US-NY" for New York state.
Including and excluding objects
OK, but what if I need only few objects out of the whole map? Or I want to get rid of a few items?
For that series have include and exclude arrays. If you add any object ids to include the series will only load those objects and ignore anything else.
If you add some ids to exclude, the series will not load data for those specific objects from map definition.
To illustrate the point, let's get rid of Antarctica from our map. (Antarctica's ISO2 code is "AQ" by the way)
polygonSeries.exclude = ["AQ"];
polygonSeries.exclude = ["AQ"];
{
  // ... map config
  "series": [{
    "type": "MapPolygonSeries",
    // ...
    "exclude": ["AQ"]
  }]
}
See the Pen amCharts V4: Map (simple, step 3) by amCharts (@amcharts) on CodePen.
Similarly, if I wanted to include only certain countries, I could use include instead:
polygonSeries.include = ["PT", "ES", "FR", "DE", "BE", "NL", "IT", "AT", "GB", "IE", "CH", "LU"];
polygonSeries.include = ["PT", "ES", "FR", "DE", "BE", "NL", "IT", "AT", "GB", "IE", "CH", "LU"];
{
  // ... map config
  "series": [{
    "type": "MapPolygonSeries",
    // ...
    "include": ["PT", "ES", "FR", "DE", "BE", "NL", "IT", "AT", "GB", "IE", "CH", "LU"]
  }]
}
The above will automatically include countries from the Western Europe, and will position/zoom map to accommodate that:
See the Pen amCharts V4: Map (simple, 4) by amCharts (@amcharts) on CodePen.
In-line data
Nice, so why do we need data at all?
If all we require is to display a map like the one above, we don't. However, most often we'll need to attach some additional data to polygons that is not available in the GeoJSON.
For example, we can add values to countries for a heat map. Or, override a country name. Or, set a different rollover information, color, you name it.
That's where data comes in.
Just like with regular charts, map series' data is an array of objects. Each object represents a map object of some type - as dictated by series type.
[{
  "id": "US",
  "name": "United States",
  "value": 100
}, {
  "id": "FR",
  "name": "France",
  "value": 50
}]
With a data like above the series will now associate value 100 with the U.S. and 50 with France.
Now, since I have additional data attached to those countries, I can use it in a number of ways, like display it in tooltip:
polygonTemplate.tooltipText = "{name}: {value}";
polygonTemplate.tooltipText = "{name}: {value}";
{
  // ... map config
  "series": [{
    "type": "MapPolygonSeries",
    // ...
    "mapPolygons": {
      "tooltipText": "{name}: {value}",
      // ...
    }
  }]
}
NOTE Other type of series might act a bit differently, for example line series (MapLineSeries) will use the data objects to draw lines on the map.
Binding properties to data
Series' data can be used in a number of ways, not just displaying additional data in a tooltip.
Among such advanced usage is the capability to bind object properties to fields in data.
For that we can use template's propertyFields object. Basically, every entry in that object will tell: look for value in related data item using this key and apply to this property.
Say we want to enhance our previous demo to apply different fill colors to the U.S. and France.
polygonSeries.data = [{
  "id": "US",
  "name": "United States",
  "value": 100,
  "fill": am4core.color("#F05C5C")
}, {
  "id": "FR",
  "name": "France",
  "value": 50,
  "fill": am4core.color("#5C5CFF")
}];

polygonTemplate.propertyFields.fill = "fill";
polygonSeries.data = [{
  "id": "US",
  "name": "United States",
  "value": 100,
  "fill": am4core.color("#F05C5C")
}, {
  "id": "FR",
  "name": "France",
  "value": 50,
  "fill": am4core.color("#5C5CFF")
}];

polygonTemplate.propertyFields.fill = "fill";
{
  // ... map config
  "series": [{
    "type": "MapPolygonSeries",
    "data": [{
      "id": "US",
      "name": "United States",
      "value": 100,
      "fill": am4core.color("#F05C5C")
    }, {
      "id": "FR",
      "name": "France",
      "value": 50,
      "fill": am4core.color("#5C5CFF")
    }],
    // ...
    "mapPolygons": {
      "tooltipText": "{name}: {value}",
      // ...
      "propertyFields": {
        "fill": "fill"
      }
    }
  }]
}
See the Pen amCharts V4: Map (simple, step 5) by amCharts (@amcharts) on CodePen.
NOTE Using data is not the only way. You can create series objects one by one. Please refer to chapter "Using objects" at the end of this article for further info.
Custom polygon series
It is possible to create completely custom shapes on the map by providing inline data for their corners. For more info and examples, please refer to "Custom polygons on Map Chart" tutorial.
Note about data mutation
MapPolygonSeries is unique in that it will modify the array assigned to its data. So if you're using that array elsewhere in your app, you'll want to assign a copy of the array. Here's a simple way of doing this if there are no custom objects (like am4core.color) in your array:
polygonSeries.data = JSON.parse(JSON.stringify(dataArray));
polygonSeries.data = JSON.parse(JSON.stringify(dataArray));
{
  // ...
  "data": JSON.parse(JSON.stringify(dataArray))
}
Multiple polygon series
When creating a map, you are not limited to using just one polygon series. Depending on your data structure and target functionality, you may add as many series as you need.
Each series, can reuse the same geodata, but use different include.
The following example shows how we can build a functional map of regions of Europe:
See the Pen amCharts V4: Using multiple map series by amCharts (@amcharts) on CodePen.
NOTE As a nice added bonus side-effect of using multiple series, we can now use a regular Legend, complete with automatic rendering, and even toggling.
Overlaying multiple maps
It is possible to have several actual maps (geodata) to be shown on a single map instance.
Up until now, we have been using single geodata (or geodataSource) on the chart object.
It is also possible to set geodata (or geodataSource) directly on the Map series. Since we can have multiple Polygon series, we can have multiple maps nicely overlaid over each other, allowing the creation of nested setups.
As an example, let's create a World map with a US state map overlaid over it, creating a World map with US states.
/**
 * Series for the World map
 * It will use `chart.geodata`
 */
let worldSeries = chart.series.push(new am4maps.MapPolygonSeries());
worldSeries.exclude = ["AQ"];
worldSeries.useGeodata = true;

/**
 * Series for the U.S. map
 * It will use its own `geodata`
 */
let usaSeries = chart.series.push(new am4maps.MapPolygonSeries());
usaSeries.geodata = am4geodata_usaLow
/**
 * Series for the World map
 * It will use `chart.geodata`
 */
var worldSeries = chart.series.push(new am4maps.MapPolygonSeries());
worldSeries.exclude = ["AQ"];
worldSeries.useGeodata = true;

/**
 * Series for the U.S. map
 * It will use its own `geodata`
 */
var usaSeries = chart.series.push(new am4maps.MapPolygonSeries());
usaSeries.geodata = am4geodata_usaLow
{
  // ... map config
  "series": [{
    "type": "MapPolygonSeries",
    "useGeodata": true,
    // ...
  }, {
    "type": "MapPolygonSeries",
    "geodata": "usaLow"
    // ...
  }]
}
Here's how it turned out:
See the Pen amCharts 4: Overlaying multiple maps and series by amCharts (@amcharts) on CodePen.
Sorting polygons
By default, polygons in the series are automatically sorted by size. This is done to ensure that smaller polygons are not obstructed by larger ones.
This also affects their selection when focusing polygons using TAB key (accessibility feature). In this case ordering by size might seem pretty random to user.
Please refer to the tutorial "Ordering map polygons" for further information.
Image series
Image series is used to add any visual object (let's call them markers) anywhere on the map. And by "any object" we literally mean anything.
It could be something as simple as a circle, a label, or image. Or it could be a full-fledged chart. As long as the object is a descendant of Sprite class (which describes almost any visual element in amCharts 4), it can be used as a marker in maps.
Technically, GeoJSON format allows incorporating images and can be loaded using useGeodata. However, it's not very common, so, for the purpose of this article, we'll be using just data.
Image object
As we briefly mentioned in the intro to this section, a map marker can be anything. It's represented by a MapImage class (which essentially is an empty container you can add anything to). Map images are collected into MapImageSeries.
Creating image series
Image series is created like any other series, by instantiating of a proper class, in this case MapImageSeries.
let imageSeries = chart.series.push(new am4maps.MapImageSeries());
var imageSeries = chart.series.push(new am4maps.MapImageSeries());
{
  // ... map config
  "series": [{
    "type": "MapPolygonSeries",
    // ...
  }, {
    "type": "MapImageSeries",
    // ...
  }]
}
Configuring image series
Once the series is created, we can configure it and assign data.
There are two important configuration aspects in images series: data fields and appearance.
Just like with other map series, we configure using "template" object. As we mentioned earlier, it holds a MapImage object, which, essentially, is an empty container, you can add anything in it. To start off simple, let's add a basic Circle to it.
let imageSeriesTemplate = imageSeries.mapImages.template;
let circle = imageSeriesTemplate.createChild(am4core.Circle);
circle.radius = 4;
circle.fill = am4core.color("#B27799");
circle.stroke = am4core.color("#FFFFFF");
circle.strokeWidth = 2;
circle.nonScaling = true;
circle.tooltipText = "{title}";
var imageSeriesTemplate = imageSeries.mapImages.template;
var circle = imageSeriesTemplate.createChild(am4core.Circle);
circle.radius = 4;
circle.fill = am4core.color("#B27799");
circle.stroke = am4core.color("#FFFFFF");
circle.strokeWidth = 2;
circle.nonScaling = true;
circle.tooltipText = "{title}";
{
  // ... map config
  "series": [{
    "type": "MapPolygonSeries",
    // ...
  }, {
    "type": "MapImageSeries",
    "mapImages": {
      "children": [{
        "type": "Circle",
        "radius": 4,
        "stroke" : "#B27799",
        "strokeWidth": 2,
        "nonScaling": true,
        "tooltipText": "{title}"
      }]
    }
  }]
}
Note, that radius, stroke, and other properties are Circle properties. Other objects will have their own properties.
Now, whenever a series is creating a new marker, it will create purple circle with a white outline.
Binding marker properties to data
What we also need to do, is to bind specific images properties to data.
As we saw with polygon series, we bind series' items' properties to data using propertyFields.
So, for example, if we want to bind latitude and longitude properties to "latitude" and "longitude" keys in data, we'll do something like this:
imageSeriesTemplate.propertyFields.latitude = "latitude";
imageSeriesTemplate.propertyFields.longitude = "longitude";
imageSeriesTemplate.propertyFields.latitude = "latitude";
imageSeriesTemplate.propertyFields.longitude = "longitude";
{
  // ... map config
  "series": [{
    "type": "MapPolygonSeries",
    // ...
  }, {
    "type": "MapImageSeries",
    // ...
    "mapImages": {
      "propertyFields": {
        "latitude": "latitude",
        "longitude": "longitude"
      }
    }
  }]
}
Image data
Now, all we need to do is to top it off with actual data.
Let's add a marker for Paris (48.856614, 2.352222) to New York City (40.712775, -74.005973) to Vancouver (49.282729, -123.120738).
imageSeries.data = [{
  "latitude": 48.856614,
  "longitude": 2.352222,
  "title": "Paris"
}, {
  "latitude": 40.712775,
  "longitude": -74.005973,
  "title": "New York"
}, {
  "latitude": 49.282729,
  "longitude": -123.120738,
  "title": "Vancouver"
}];
imageSeries.data = [{
  "latitude": 48.856614,
  "longitude": 2.352222,
  "title": "Paris"
}, {
  "latitude": 40.712775,
  "longitude": -74.005973,
  "title": "New York"
}, {
  "latitude": 49.282729,
  "longitude": -123.120738,
  "title": "Vancouver"
}];
{
  // ... map config
  "series": [{
    "type": "MapPolygonSeries",
    // ...
  }, {
    "type": "MapImageSeries",
    // ...
    "data": [{
      "latitude": 48.856614,
      "longitude": 2.352222,
      "title": "Paris"
    }, {
      "latitude": 40.712775,
      "longitude": -74.005973,
      "title": "New York"
    }, {
      "latitude": 49.282729,
      "longitude": -123.120738,
      "title": "Vancouver"
    }]
  }]
}
And, let's see how it went:
See the Pen amCharts V4: Map (simple, step 5) by amCharts (@amcharts) on CodePen.
NOTE Using data is not the only way. You can create series objects one by one. Please refer to chapter "Using objects" at the end of this article for further info.
Using actual images
Please refer to "Using actual images in MapImageSeries" tutorial for info and examples on how you can use various images for map markers.
Line series
The map can draw a number of lines connecting two or more points. They are assembled into line series.
Lines can be straight (MapLineSeries), arched (MapArcSeries), or smoothely curved (MapSplineSeries; please note for lines to be curved they must pass through at least 3 points).
As with polygons and images, lines can also be loaded from map definition (GeoJSON) using useGeodata, although is much less common. In the course of this article we'll be adding lines using just in-line data.
Line object
Probably the most common way to draw a line is to fill its multiGeoLine array with "geo point" coordinates. A geo point is a simple object with two properties: latitude and longitude.
Each geo point in array represents a line point. There should be at least two. If you have more than two, the series will draw multi-segment line.
Let's draw a line connecting our three cities from the images - Paris, New York City, and Vancouver.
[{
  "multiGeoLine": [
    [
      { "latitude": 48.856614, "longitude": 2.352222 },
      { "latitude": 40.712775, "longitude": -74.005973 },
      { "latitude": 49.282729, "longitude": -123.120738 }
    ]
  ]
}]
The above defines data for map line series. It contains one data for one line.
Notice, how the multiGeoLine is an array of array. This is not a mistake but rather clever way (inherited from GeoJSON standard) to define multiple clusters of multi-segmented lines.
This can be used if you want to introduce a break in the multi-segmented line, i.e. some points to not be connected by an actual line:
[{
  "multiGeoLine": [
    [
      // points for the first cluster of segments
    ],
    [
      // points for the second cluster of segments
    ],
    [
      // points for the third cluster of segments
    ]
  ]
}]
Creating line series
Line series is created just like polygon series:
let lineSeries = chart.series.push(new am4maps.MapLineSeries());
lineSeries.data = [{
  "multiGeoLine": [
    [
      { "latitude": 48.856614, "longitude": 2.352222 },
      { "latitude": 40.712775, "longitude": -74.005973 },
      { "latitude": 49.282729, "longitude": -123.120738 }
    ]
  ]
}];
var lineSeries = chart.series.push(new am4maps.MapLineSeries());
lineSeries.data = [{
  "multiGeoLine": [
    [
      { "latitude": 48.856614, "longitude": 2.352222 },
      { "latitude": 40.712775, "longitude": -74.005973 },
      { "latitude": 49.282729, "longitude": -123.120738 }
    ]
  ]
}];
{
  // ... map config
  "series": [{
    "type": "MapPolygonSeries",
    // ...
  }, {
    "type": "MapLineSeries",
    "data": [{
      "multiGeoLine": [
        [
          { "latitude": 48.856614, "longitude": 2.352222 },
          { "latitude": 40.712775, "longitude": -74.005973 },
          { "latitude": 49.282729, "longitude": -123.120738 }
        ]
      ]
    }]
  }]
}
Let's see if we have a line connecting our three awesome cities:
See the Pen amCharts V4: Map (simple, step 6) by amCharts (@amcharts) on CodePen.
NOTE Notice, in the code of the example, we have images section after lines. The map adds elements i the order they are set to the map, which affects the order of display. We want lines to be behind markers, hence lines code must come first.
NOTE Using data is not the only way. You can create series objects one by one. Please refer to chapter "Using objects" at the end of this article for further info.
Configuring line appearance
As with other map object series, Line series elements are configured via series' templates.
In this case it's the mapLines.template.line object.
Notice we are using line property of the template. Regardless of what type of line series we have, the template will contain a lineproperty, which will have an actual line element of the relative type, we can use to configure appearance of.
For MapLineSeries it'll be an object of type Polyline. For MapArcSeries it'll be a Polyarc, etc.
You can set properties like stroke (line color), strokeWidth (line thickness in pixels), strokeOpacity (line opacity), strokeDasharray (to make line dashed), and some other settings. E.g.:
lineSeries.mapLines.template.line.stroke = am4core.color("#5C5CFF");
lineSeries.mapLines.template.line.strokeOpacity = 0.5;
lineSeries.mapLines.template.line.strokeWidth = 4;
lineSeries.mapLines.template.line.strokeDasharray = "3,3";
lineSeries.mapLines.template.line.stroke = am4core.color("#5C5CFF");
lineSeries.mapLines.template.line.strokeOpacity = 0.5;
lineSeries.mapLines.template.line.strokeWidth = 4;
lineSeries.mapLines.template.line.strokeDasharray = "3,3";
{
  // ... map config
  "series": [{
    "type": "MapPolygonSeries",
    // ...
  }, {
    "type": "MapLineSeries",
    // ...
    "mapLines": {
      "line": {
        "stroke": "#5C5CFF",
        "strokeOpacity": 0.5,
        "strokeWidth": 4,
        "strokeDasharray": "3,3"
      }
    }
  }]
}
See the Pen amCharts V4: Map (simple, step 7) by amCharts (@amcharts) on CodePen.
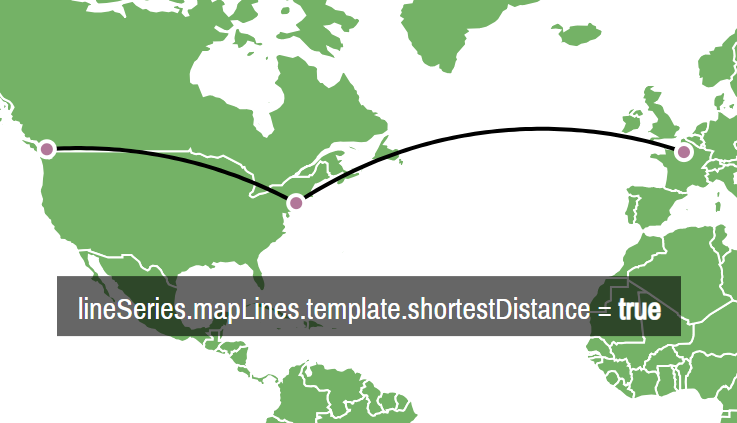
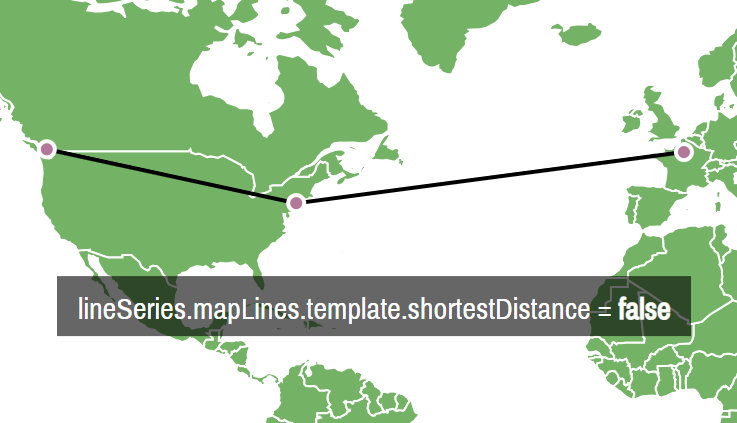
Curved vs. straight lines
By now, you might be wondering why our "lines" are not straight, but rather slightly curved.
The answer is simple - they follow the curvature of the Earth. While they might look like they are taking longer route between point A and point B on screen, in reality they plot the shortest course between the two points.
The distortion comes in because the actual flattened map introduces certain modifications.
If you'd like your lines look straight on screen, simply set line's (or MapLineSeries template's) shortestDistance = false.
Using images as line points
If your lines are connecting actual markers (map images), you can skip the multiGeoLine property, and use imagesToConnect instead.
This property is an array of references to MapImage objects. E.g.:
let paris = imageSeries.mapImages.create();
paris.latitude = 48.856614;
paris.longitude = 2.352222;

let nyc = imageSeries.mapImages.create();
nyc.latitude = 40.712776;
nyc.longitude = -74.005973;

let paris_nyc = lineSeries.mapLines.create();
paris_nyc.imagesToConnect = [paris, nyc];
var paris = imageSeries.mapImages.create();
paris.latitude = 48.856614;
paris.longitude = 2.352222;

var nyc = imageSeries.mapImages.create();
nyc.latitude = 40.712776;
nyc.longitude = -74.005973;

var paris_nyc = lineSeries.mapLines.create();
paris_nyc.imagesToConnect = [paris, nyc];
Line series types
MORE INFO Please refer to the separate "Map Lines" article for detailed description, demos and code, explaining different types of Line series used on Map chart.
Built-in separator lines
Some maps have separator line information built-in. Please refer to "Maps with separator lines" tutorial for more info.
Additional controls
As with any chart type, Map chart allows adding some specific controls.
Zoom control
Adding zoom control, is as simple as instantiating an object of ZoomControl class and assigning it to map's zoomControl property:
chart.zoomControl = new am4maps.ZoomControl();
chart.zoomControl = new am4maps.ZoomControl();
{
  // ... map config
  "zoomControl": {
    // No need to set `type` here.
    // There's only one type of zoom control, so the map
    // will be able to figure it out by itself.
    // ...
  }
}
Please refer to the reference of ZoomControl for available configuration options.
Normally zoom control would show only zoom in and out buttons.
It can also show a neat slider in-between. To enable it simply set its height:
chart.zoomControl.slider.height = 100;
chart.zoomControl.slider.height = 100;
{
  // ... map config
  "zoomControl": {
    "slider": {
      "height": 100
    }
  }
}
Small map
Same is with a small map - a tiny control that will display a mini version of the full map as well as highlight your current view port.
However, before it can be useful, we need to configure it, by providing what to show in it. Since it is essentially a small version of the map, we need to assign map series to small map to show.
If we wanted, we could create and show any new series in the small map. For simplicity, let's just replicate our polygon series we already have on the map.
chart.smallMap = new am4maps.SmallMap();
chart.smallMap.series.push(polygonSeries);
chart.smallMap = new am4maps.SmallMap();
chart.smallMap.series.push(polygonSeries);
{
  // ... map config
  "series": [{
    "type": "MapPolygonSeries"
    "id": "s1", // setting id so we can reference it in `smallMap`
    // ...
  }],
  "smallMap": {
    "series": ["s1"]
  }
}
Please refer to the reference of SmallMap for available configuration options.
MORE INFO For more options about how to configure Small map check out "Configuring Small Map".
Full map demo
See the Pen amCharts V4: Map (simple, step 7) by amCharts (@amcharts) on CodePen.
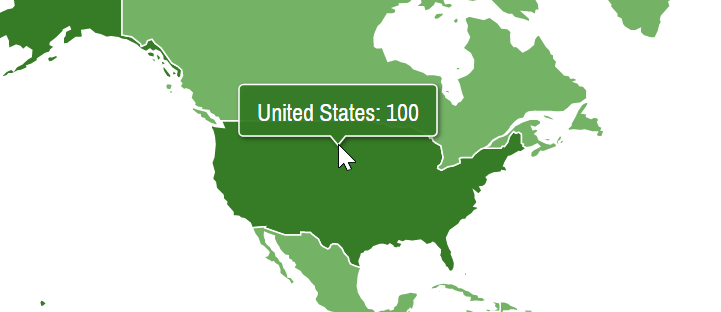
Geographical heat-maps
The map can automatically set filll color (and any other quantitative value for that matter) based on some arbitrary value, which allows us creating geographical heat-maps.
The functionality, which is not limited to just maps, is called "heat rules", or (heatRules) and can be applied to any series, including series for map objects.
REQUIRED READING There's a special section "Heat-maps" in our Series tutorial. Make sure you read it, because we'll spare you the details here.
We're going to assume you did read the Series article section linked above. Now, let's put this into the context of maps.
Creating heat rules
Creating heat rules for map series is identical to creating heat rules for any series: you just specify start and end values, as well as the property, and what object, you need to be controlled by the rule:
polygonSeries.heatRules.push({
  "property": "fill",
  "target": polygonSeries.mapPolygons.template,
  "min": am4core.color("#ffffff"),
  "max": am4core.color("#AAAA00")
});
polygonSeries.heatRules.push({
  "property": "fill",
  "target": polygonSeries.mapPolygons.template,
  "min": am4core.color("#ffffff"),
  "max": am4core.color("#AAAA00")
});
{
  // ...
  "series": [{
    "type": "MapPolygonSeries",
    // ...
    "heatRules": [{
      "target": "mapPolygons.template",
      "property": "fill",
      "min": "#ffffff",
      "max": "#AAAA00"
    }]
  }]
}
This basically instructs the series to "check "value" field in data for each polygon, and color it between white and greenish based on where that value stands in the spectrum of the whole range of values in the series".
Here's how it turned out:
See the Pen amCharts V4: Map (heat-map) by amCharts (@amcharts) on CodePen.
Logarithmic rules
Regular heat rules might work when you have values of comparable scale. However, should there be even one value that is significantly larger than other values, it would skew the whole heat map, since all other values would look very small in comparison, and thus would use basically the same color.
That's where logarithmic rules come in.
If logarithmic: true is set for the rule, the value's "mass" in the whole spectrum would be calculated not linear but logarithmic scale.
polygonSeries.heatRules.push({
  "property": "fill",
  "target": polygonSeries.mapPolygons.template,
  "min": am4core.color("#ffffff"),
  "max": am4core.color("#AAAA00"),
  "logarithmic": true
});
polygonSeries.heatRules.push({
  "property": "fill",
  "target": polygonSeries.mapPolygons.template,
  "min": am4core.color("#ffffff"),
  "max": am4core.color("#AAAA00"),
  "logarithmic": true
});
{
  // ...
  "series": [{
    "type": "MapPolygonSeries",
    // ...
    "heatRules": [{
      "target": "mapPolygons.template",
      "property": "fill",
      "min": "#ffffff",
      "max": "#AAAA00",
      "logarithmic": true
    }]
  }]
}
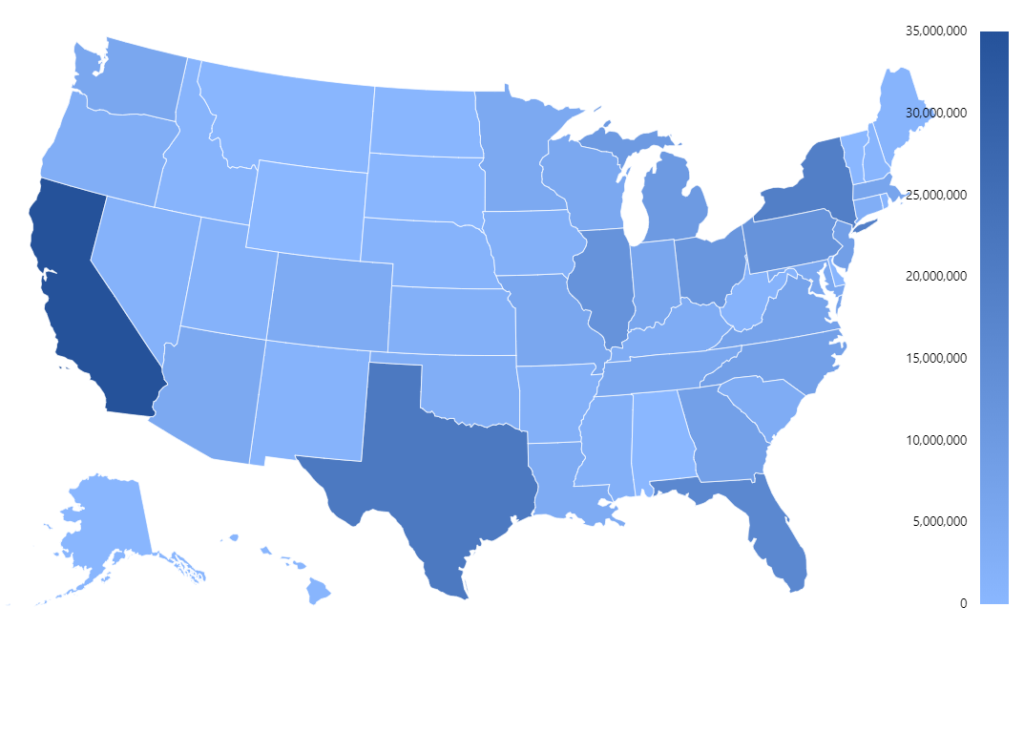
Linear heat rule 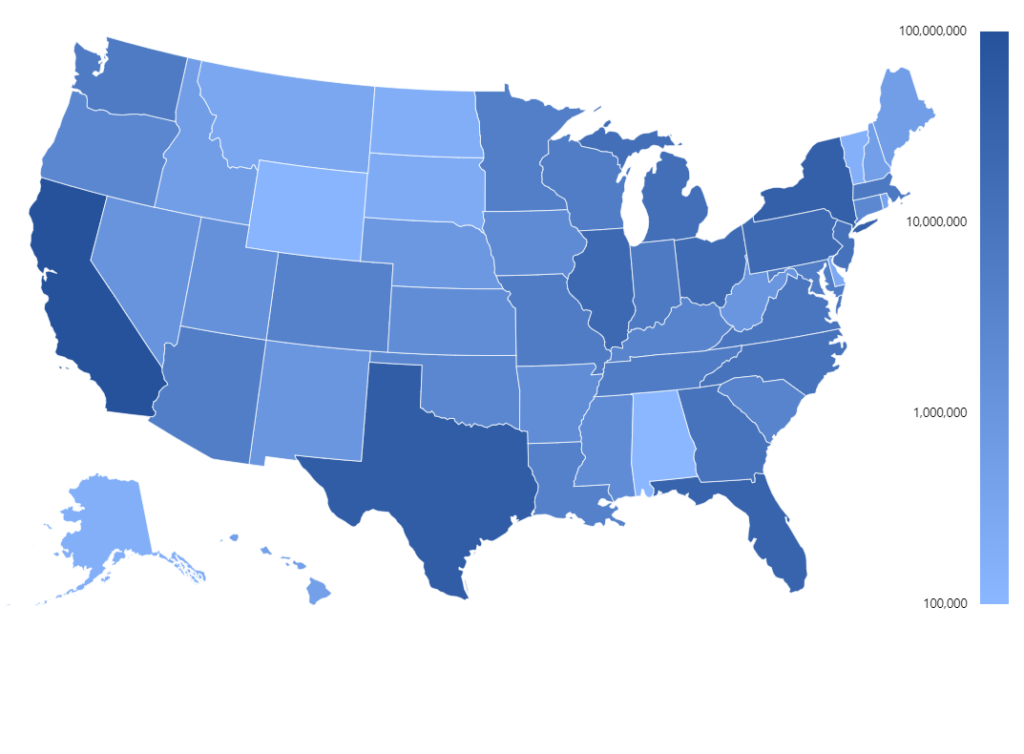
Logarithmic heat rule
As you can see in the first example above, just a few large-value polygons, makes difference between the rest of them nearly indistinguishable.
Enabling logarithmic scale fixes that.
Live example:
See the Pen US heat (choropleth) map by amCharts team (@amcharts) on CodePen.
IMPORTANT If you are using a heat legend (next chapter) you will need to enable logarithmic scale for it individually. See "Heat Legend" article for more details.
Adding a heat legend
You know what goes well with a heat-map? Yes, a Heat Legend.
It's a special kind of Legend, that instead of showing individual items, shows a spectrum of colors, available in some selected series.
REQUIRED READING Again, we'll have to drop some required reading on you, as we have a dedicated "Heat Legend".
There's absolutely nothing special with adding Head Legend to a map: you create an instance of HeatLegend, you add it to one of the chart containers as a child, you hook the legend up with your map series, so that it knows where to get its data from:
let heatLegend = chart.createChild(am4maps.HeatLegend);
heatLegend.series = polygonSeries;
heatLegend.width = am4core.percent(100);
var heatLegend = chart.createChild(am4maps.HeatLegend);
heatLegend.series = polygonSeries;
heatLegend.width = am4core.percent(100);
{
  // ...
  "series": [{
    "id": "s1",
    // ...
  }],
  // ...
  "children": [{
    "type": "HeatLegend",
    "series": "s1",
    "width": "100%"
  }]
}
And, if we're especially generous with our users, we might also add some interactivity, so that when user rolls over some polygon, we show where in the overall spectrum of values it stands:
polygonSeries.mapPolygons.template.events.on("over", function(ev) {
  if (!isNaN(ev.target.dataItem.value)) {
    heatLegend.valueAxis.showTooltipAt(ev.target.dataItem.value)
  }
  else {
    heatLegend.valueAxis.hideTooltip();
  }
});

polygonSeries.mapPolygons.template.events.on("out", function(ev) {
  heatLegend.valueAxis.hideTooltip();
});
Let's see how that went:
See the Pen amCharts V4: Map (heat-map, 2) by amCharts (@amcharts) on CodePen.
IMPORTANT If you are using a heat legend (next chapter) you will need to enable logarithmic scale for it individually. See "Heat Legend" article for more details.
Adding a custom legend
You can also add a Legend with custom items in it. For more details and a working demo, check out "Adding custom Items" section in our "Legend" article.
Using objects
So far we have shown you how to use map series' data property to add map objects like polygons, lines and markers.
It's a convenient way to add a lot of data to map. However, there's another way - creating objects of appropriate type, then setting their properties directly.
Since you're setting properties directly on the object, there's no need to map fields like "latitude" and "longitude" to data. That's the most valuable advantage of using objects over data.
Creating series object
The most common way to create an object in the series is to use its create() method:
let france = polygonSeries.mapPolygons.create();
france.id = "FR";

let paris = imageSeries.mapImages.create();
paris.latitude = 48.856614;
paris.longitude = 2.352222;

let nyc = imageSeries.mapImages.create();
nyc.latitude = 40.712776;
nyc.longitude = -74.005973;

let paris_nyc = lineSeries.mapLines.create();
paris_nyc.imagesToConnect = [paris, nyc];
var france = polygonSeries.mapPolygons.create();
france.id = "FR";

var paris = imageSeries.mapImages.create();
paris.latitude = 48.856614;
paris.longitude = 2.352222;

var nyc = imageSeries.mapImages.create();
nyc.latitude = 40.712776;
nyc.longitude = -74.005973;
There is no need to push() newly created objects into series - create() will take care of that.
Calling create() will create a new object out of the series template, like we've shown you earlier. So you might want to configure templates before starting creating objects.
Specifying map line points directly
If you didn't specify line series points via series data, or do not have images which you can use in imagesToConnect, you can set line's multiGeoLine property directly:
let line = lineSeries.mapLines.create();

line.multiGeoLine = [[
  { "latitude": 48.856614, "longitude": 2.352222 },
  { "latitude": 40.712775, "longitude": -74.005973 },
  { "latitude": 49.282729, "longitude": -123.120738 }
]];
var line = lineSeries.mapLines.create();

line.multiGeoLine = [[
  { "latitude": 48.856614, "longitude": 2.352222 },
  { "latitude": 40.712775, "longitude": -74.005973 },
  { "latitude": 49.282729, "longitude": -123.120738 }
]];
{
  // ...
  "series": [{
    "type": "MapLineSeries",
    "mapLines": [{
      "multiGeoLine": [[
        { "latitude": 48.856614, "longitude": 2.352222 },
        { "latitude": 40.712775, "longitude": -74.005973 },
        { "latitude": 49.282729, "longitude": -123.120738 }
      ]]
    }]
  }]
}
Controlling scaling of map objects
By default all objects on the map - polygons, images, and lines - will scale in size when you zoom in the map.
To disable such scaling we do have to configure relative templates.
To prevent map images from scaling we have to set nonScaling = true on the template of the map images.
Similarly, to prevent map lines to getting thicker with zoom, we can set nonScalingStroke = true on their respective templates.
imageSeries.mapImages.template.nonScaling = true;
// ...
lineSeries.mapImages.template.nonScalingStroke = true;
imageSeries.mapLines.template.nonScaling = true;
// ...
lineSeries.mapLines.template.nonScalingStroke = true;
{
  // ...
  "series": [{
    "type": "MapImageSeries",
    // ...
    "mapImages": {
      // ...
      "nonScaling": true
    }
  }, {
    "type": "MapLineSeries",
    // ...
    "mapLines": {
      // ...
      "nonScalingStroke": true
    }
  }]
}
Map background
In some cases, you might want to to give your map a background.
Static fill
Sure, you can give your whole Map Chart a fill background using its background property:
chart.background.fill = am4core.color("#aadaff");
chart.background.fillOpacity = 1;
chart.background.fill = am4core.color("#aadaff");
chart.background.fillOpacity = 1;
{
  // ...
  "background": {
    "fill": "#aadaff",
    "fillOpacity": 1
  }
}
However, that would fill the whole area of the map, which in some projections could look a bit off:
Background series
The solution is to use "background series", that are readily accessible via map's backgroundSeries property.
It holds a Series of MapPolygonSeries so you can configure its appearance just like a regular Polygon series.
The difference is that it will automatically add a polygon, shaped exactly as the map, so you don't have to add any data into it - just configure its polygon template:
chart.backgroundSeries.mapPolygons.template.polygon.fill = am4core.color("#aadaff");
chart.backgroundSeries.mapPolygons.template.polygon.fillOpacity = 1;
chart.backgroundSeries.mapPolygons.template.polygon.fill = am4core.color("#aadaff");
chart.backgroundSeries.mapPolygons.template.polygon.fillOpacity = 1;
{
  // ...
  "backgroundSeries": {
    "mapPolygons": {
      "polygon": {
        "fill": "#aadaff",
        "fillOpacity": 1
      }
    }
  }
}
backgroundSeries to apply fillBetter, isn't it?
See the Pen amCharts 4: backgroundSeries by amCharts team (@amcharts) on CodePen.
Map rotation
Since version 4.3.0 Map Chart supports rotation around any of its axes: vertical (Y), horizontal (X), and perpendicular (Z).
While the map starts off centered perfectly - like you are used to seeing the maps - it can be rotated in any of the directions around any of its axes using deltaLongitude, deltaLatitude, and deltaGamma properties respectively.
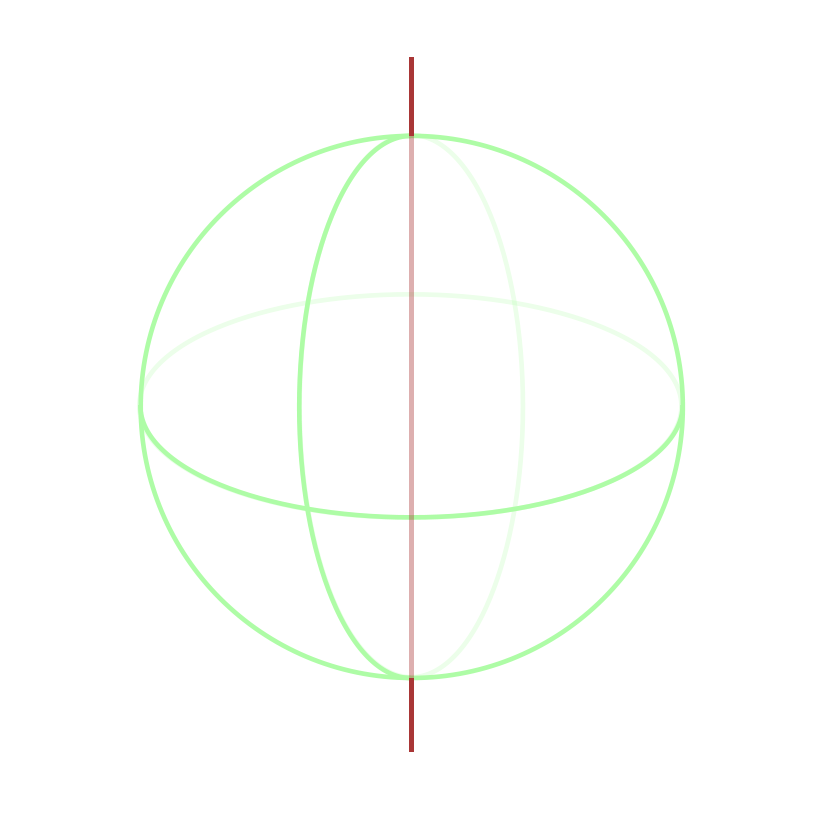
deltaLongitude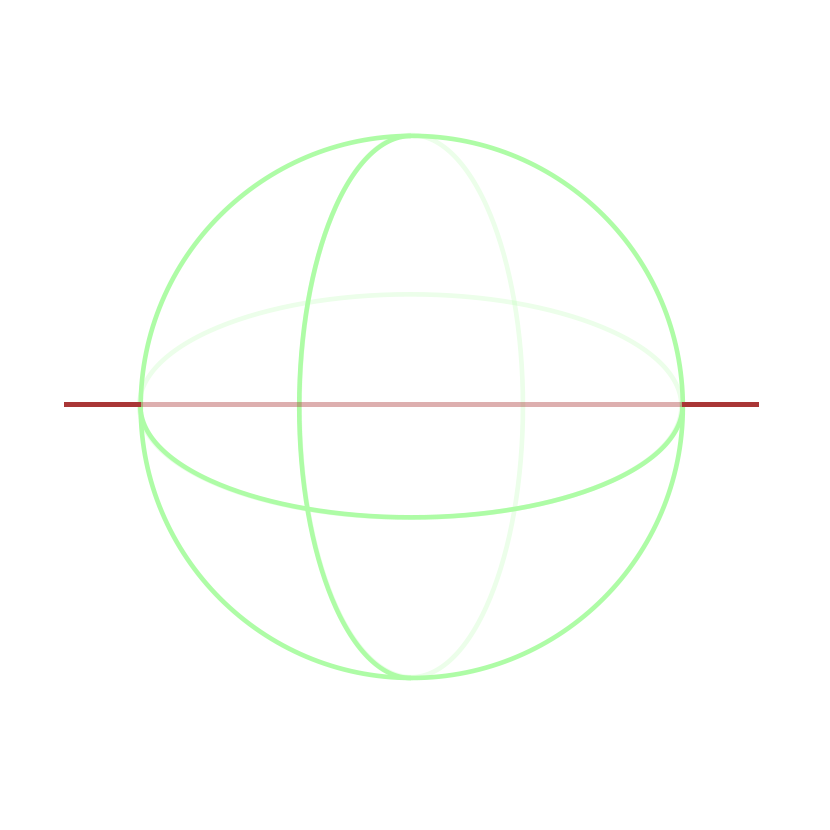
deltaLatitude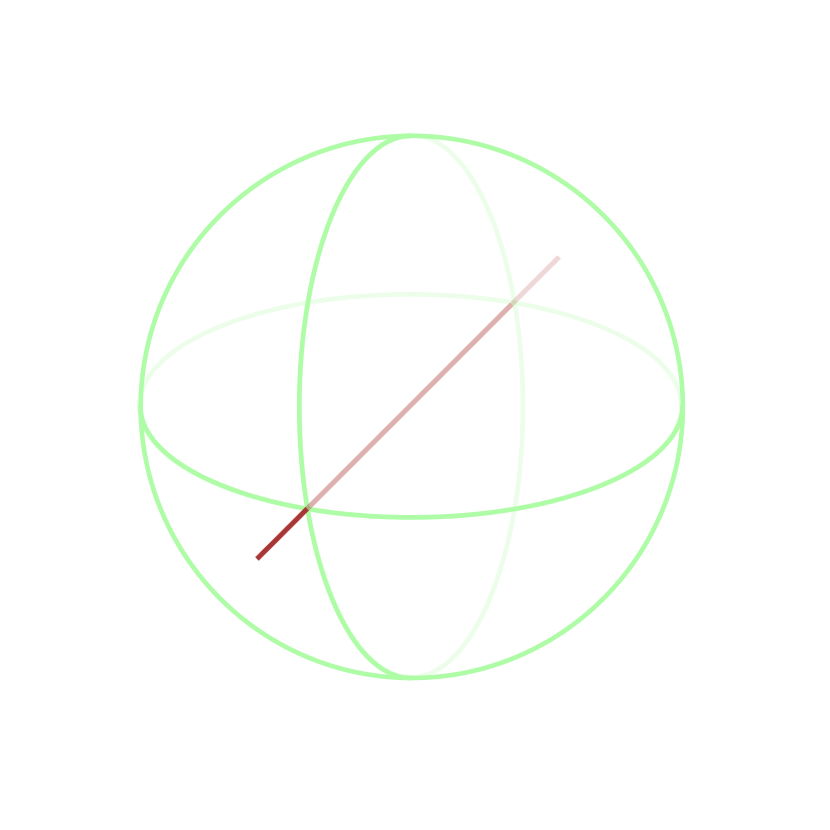
deltaGama
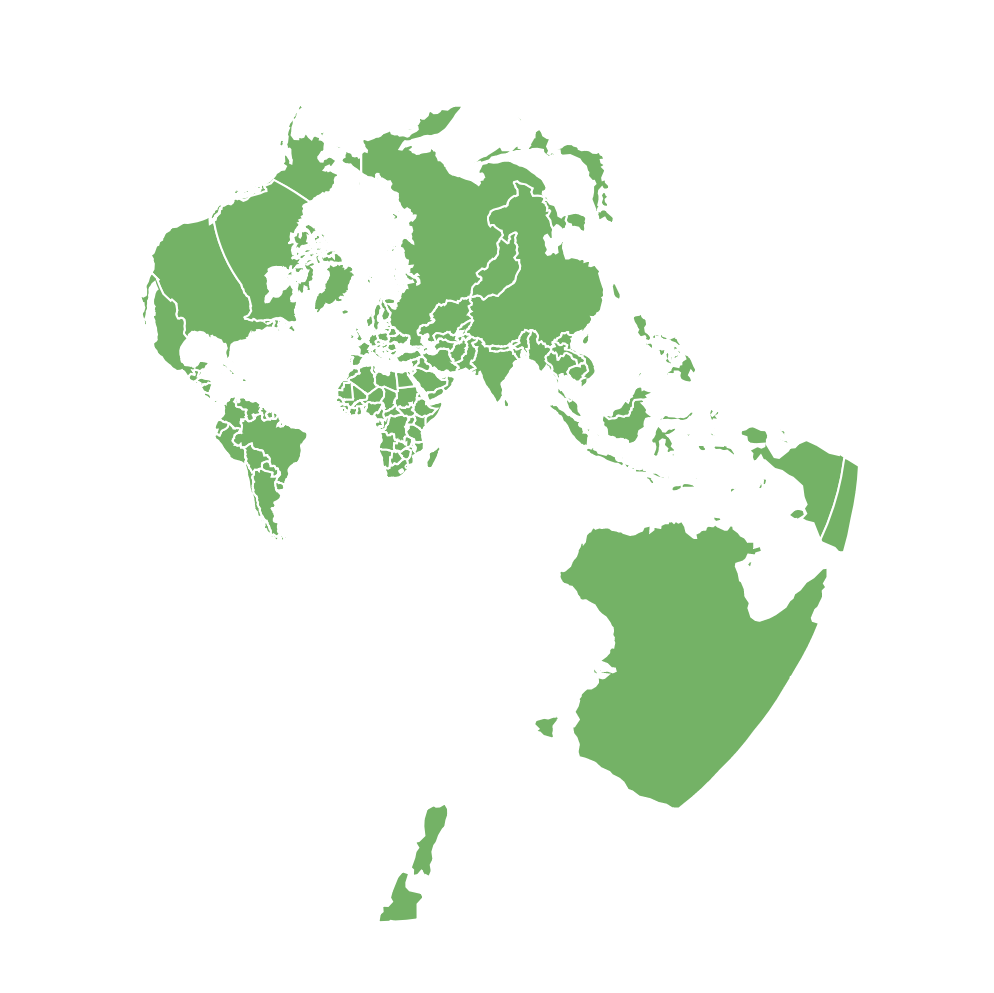
Setting map center
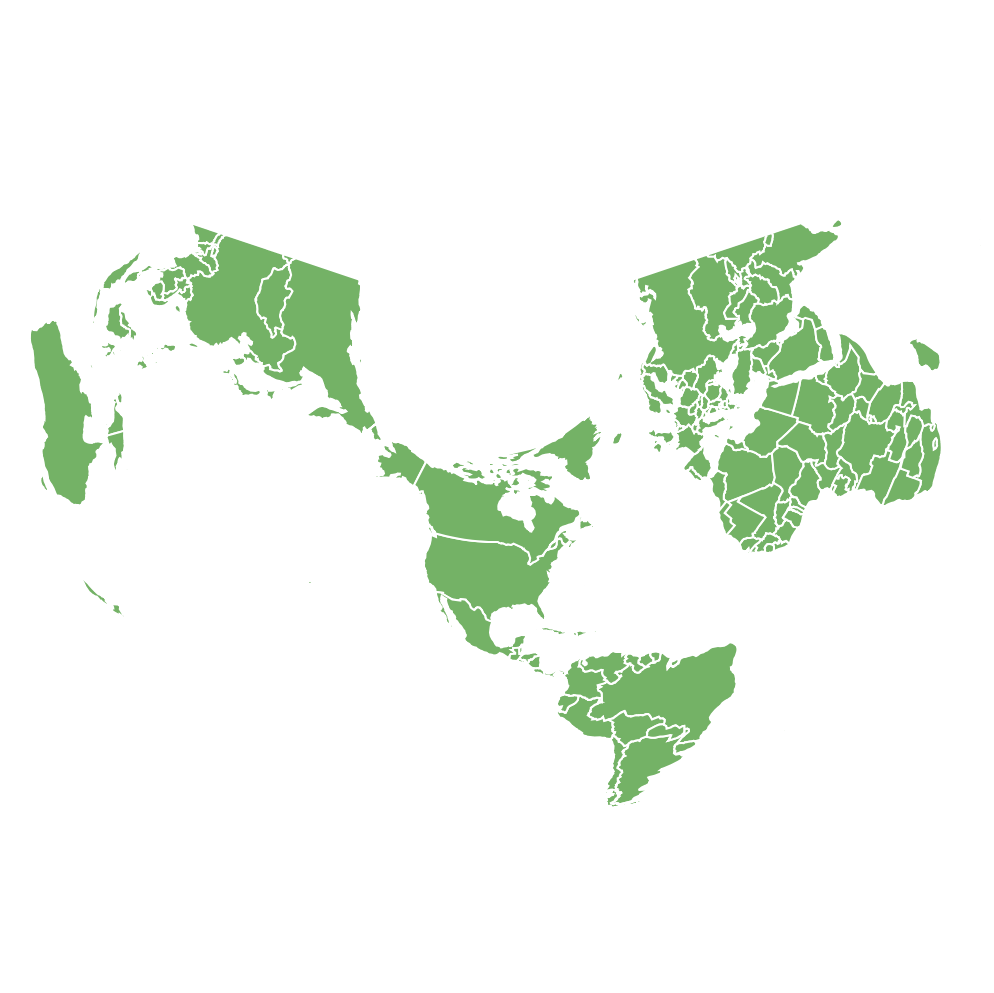
Want to create a Pacific-centered map? Or just about any-longitude-centered?
You can use MapChart's deltaLongitude property to set longitude offset when centering the map.
Basically, in layman's terms, it means "move the map center by X degrees".
If longitude zero is center by default, and we set deltaLongitude = -160 the longitude 20 will be our new center, creating a Pacific-centered map:
chart.deltaLongitude = -160;
chart.deltaLongitude = -160;
{
  // ... map config
  "deltaLongitude": -160
}
See the Pen amCharts 4: Pacific-centered map by amCharts (@amcharts) on CodePen.
Rotating latitude
Want to show a map of Antarctica? Rotate it along it's horizontal axis using deltaLatitude:
chart.deltaLatitude = 90;
chart.deltaLatitude = 90;
{
  // ... map config
  "deltaLatitude": 90
}
See the Pen amCharts 4: Map of Antarctica by amCharts team (@amcharts) on CodePen.
Map grid
Since version 4.3.0 Map Chart supports automatic grid.
The grid consists of a vertical and horizontal grid lines - let's call it "graticules" - drawn every X latitude and longitude.
They also follow map projection, so they give the whole map "shape".
Enabling grid
To enable grid, simply add an additional series of type GraticuleSeries, just like you would add any other series.
let grid = chart.series.push(new am4maps.GraticuleSeries());
grid.toBack();
var grid = chart.series.push(new am4maps.GraticuleSeries());
grid.toBack();
{
  // ...
  "series": [{
    // ...
  }, {
    "type": "GraticuleSeries",
    "zIndex": -1
  }]
}
This will cause a simple gray lines drawn every 10 longitude and latitude.
See the Pen amCharts 4: backgroundSeries by amCharts team (@amcharts) on CodePen.
Configuring grid
If you're happy with how default grid looks, you can leave it at that. But if you'd like to give it some personal touch, there's plenty of options.
GraticuleSeries is in a nutshell a version of MapLineSeries.
This means that we can configure the appearance of the lines just like we would on a regular Map line series: via its mapLines.template property.
GraticuleSeries automatically creates the lines for us, so we don't need to add any data to it.
grid.mapLines.template.line.stroke = am4core.color("#e33");
grid.mapLines.template.line.strokeOpacity = 0.2;
grid.mapLines.template.line.stroke = am4core.color("#e33");
grid.mapLines.template.line.strokeOpacity = 0.2;
{
  // ...
  "series": [{
    // ...
  }, {
    "type": "GraticuleSeries",
    "zIndex": -1,
    "mapLines": {
      "line": {
        "stroke": "#e33",
        "strokeOpacity": 0.2
      }
    }
  }]
}
Besides regular Map line series settings, you also have specific settings that are relevant only to the grid. Such as longitudeStep and latitudeStep.
Those, as the name suggests, define density of the grid, e.g. draw a graticule every X longitude or latitude.
grid.longitudeStep = 20;
grid.latitudeStep = 20;
grid.longitudeStep = 20;
grid.latitudeStep = 20;
{
  // ...
  "series": [{
    // ...
  }, {
    "type": "GraticuleSeries",
    // ...
    "longitudeStep": 20,
    "latitudeStep": 20
  }]
}
See the Pen amCharts 4: Map grid by amCharts team (@amcharts) on CodePen.
Extent of the grid
By default, map grid (or GraticuleSeries) will automatically cover the area occupied by other Polygon series.
If we'd rather span it whole area of the world, we can disable this "cropping" using its fitExtent property:
grid.fitExtent = false;
grid.fitExtent = false;
{
  // ...
  "series": [{
    // ...
  }, {
    "type": "GraticuleSeries",
    // ...
    "fotExtent": false
  }]
}
Interacting with map
By default, when you drag the map by mouse or touch, it will just move the whole of it as it is.
Using Map Chart's panBehavior setting we can modify this functionality according to our needs.
Available settings are as follows:
-
"move"(default) - moves the whole of the map without modifying it. "rotateLong"- rotates the map using its vertical axis, same as changingdeltaLongitude.-
"rotateLat"- rotates the map using its horizontal axis, same as changingdeltaLatitude. -
"rotateLongLat"- rotates the map freely around both of its axes, same as changingdeltaLongitudeanddeltaLatitude.

panBehavior = "move"
panBehavior = "rotateLong"
panBehavior = "rotateLat"
panBehavior = "rotateLongLat"
So, if we'd like to allow our users to rotate globe in any direction, we'd just do this:
chart.panBehavior = "rotateLongLat";
chart.panBehavior = "rotateLongLat";
{
  "panBehavior": "rotateLongLat"
}
See the Pen amCharts 4: Pan behavior by amCharts team (@amcharts) on CodePen.
Related content
Zooming
- Setting initial zoom and position of a Map chart
- Zooming to map area on click
- Disabling zoom and pan on a Map Chart
- Resetting Map Position/Zoom
- Pre-zooming Map to a Country
Interacting
- Retrieving information of a clicked Map Object
- Retrieving latitude/longitude of map click
- Consistent outlines of Map Polygons on hover
Projection-related
Other topics
- Configuring Small Map
- Maps with separator lines
- Adding "Home" Button to Map Chart
- Creating custom maps
- Automatic labels over map polygons
- Using map country name translations
- All map-related tutorials
- County maps
- Combining map polygon series to create grouped outlines
- Using U.S. congressional districts maps
- Exporing MapChart data
- Country-specific world maps


