Whether you are using some framework, like Angular, or building your TypeScript/ES6 application from scratch, amCharts 4 was made for you. You'll appreciate the code-completion and type-check built right into core of amCharts 4.
This article gives tips and instructions, on how to use amCharts newest dataviz libraries with TypeScript/ES6.
Compatibility
IMPORTANT When used in a TypeScript application, amCharts 4 requires TypeScript 2.9 or later. Using any older version will result in error.
Installation
If you are using TypeScript, you probably already know what npm is. Installing amCharts 4 is easy, just hit this command:
npm install @amcharts/amcharts4
Or, if you're using Yarn:
yarn add @amcharts/amcharts4
That's it. You're all set.
NOTE Actual geographical data for the maps is contained in a separate package @amcharts/amcharts4-geodata. So, if you're building maps, you will need to import/add that package as well.
Polyfill for older browsers
If you wish to support older browsers (such as Internet Explorer) then you will need a polyfill.
You can install the core-js polyfill by using this command:
npm install core-js @types/core-js regenerator-runtime
Or if you are using Yarn:
yarn add core-js @types/core-js regenerator-runtime
And then inside of your TypeScript / JavaScript code, add this at the very top:
import "core-js/stable";
import "regenerator-runtime/runtime";
IMPORTANT This must be put before everything else, or it won't work!
Using modules
amCharts 4 npm install brings pre-compiled modules.
The main required module core contains all the core functionality. You need it to instantiate the charts.
The rest of the modules represent chart types. For example pie contains all of the functionality required for creating Pie charts.
So, if all you'd like to do is to create a Pie chart, you'll need to import both of those modules:
import * as am4core from "@amcharts/amcharts4/core";
import * as am4charts from "@amcharts/amcharts4/charts";
When importing the module, use its npm name @amcharts/amcharts4/....
IMPORTANT It is currently impossible to load npm packages directly in the browser. You must use a bundler like Webpack or Rollup. (check our Using Webpack article)
Scopes
TypeScript/ES6 lets you use any name you want for the import, but for the purpose of this documentation, and in all of our demos and examples, we will be using am4core for the core functionality, as well as am4charts and am4maps for charts and maps modules respectively.
For consistency, we suggest you do the same.
Module list
| Module | Import path | Description |
|---|---|---|
| core | import * as am4core from "@amcharts/amcharts4/core" |
Core functionality |
| charts | import * as am4charts from "@amcharts/amcharts4/charts" |
Charting functionality |
| maps | import * as am4maps from "@amcharts/amcharts4/maps" |
Maps |
Importing assets
In many charts, besides main functionality, you'll be importing additional assets, like themes, translations, and map geodata.
As with any other modules in TypeScript/ES6 you can use your own naming. However, for the sake of consistency, we recommend following this syntax:
// Importing themes
import am4themes_animated from "@amcharts/amcharts4/themes/animated";
import am4themes_dark from "@amcharts/amcharts4/themes/dark";

// Importing translations
import am4lang_lt_LT from "@amcharts/amcharts4/lang/lt_LT";

// Importing geodata (map data)
import am4geodata_worldLow from "@amcharts/amcharts4-geodata/worldLow";
Accessing module classes
Each chart-specific module will contain all classes that specific chart type may ever need.
For example, pie module, among other things, will contain classes PieChart (used to create Pie chart itself), PieSeries (used to create a series of slices) and Legend (used to build a legend).
Some classes, like say Legend, are used by multiple chart types, so they can be found in multiple modules.
TIP Check the Sources section of the class in our class reference. It will outline all of the modules this particular class can be found in.
Instantiating chart
To instantiate a chart in TypeScript/ES6, we're going to be using a handy function am4core.create(container, chart_type_class).
The parameters are as follows.
| Parameter | Type | Description |
|---|---|---|
| container | HTMLElement or string |
A target HTML element to create the chart in.
We can pass a reference to the actual element, or we can pass an NOTE The element must exist before calling Below two examples will have identical results: let chart = am4core.create(
"chartdiv",
am4charts.PieChart
);
let chart = am4core.create(
document.getElementById("chartdiv"),
am4charts.PieChart
);
|
| chart_type_class | Class reference | A reference to a chart type class, e.g. am4charts.PieChart, am4charts.XYChart, am4maps.MapChart, etc.
TIP Technically, it is possible to use this function to instantiate non-chart elements as well, like generic container: |
Instantiating chart elements
Most of the chart elements, just like the chart itself, are objects that need instantiating.
Some singular elements, like Legend are instantiated using new notation and assigned to chart's legend property.
Others, like, say Series in a series-based chart (XY, Pie, Maps are all series-based), are created using chart's respective series property, and its create() method.
NOTE We will not get into much detail about Series concept within this article. Please visit this separate article for more information.
// Adding a legend to a Pie chart
chart.legend = new am4charts.Legend();

// Adding a series to a Pie chart
// The following will automatically create an instance of `PieSeries`,
// attach it to `PieChart` and return the reference, so that we can
// configure it
let series = chart.series.create();

// Setting up data fields in Pie series
series.dataFields.value = "visits";
series.dataFields.category = "country";
The above series.create() method did not have any parameters, because PieChart can only have PieSeries. Some properties that are lists, like Axes, can have different items, so we need to specify their type. But we'll get to it in other articles, that specifically deal with such usage.
Configuring chart
Configuration of the chart happens by setting properties on the chart instance itself and on it's "child" elements, like Legend and Series, as we saw in the previous paragraph.
Chart data
In most cases, the data for the chart is set via its data property.
A chart's data, with some exceptions, is almost always an array of objects. E.g.:
[{
	"country": "Lithuania",
	"visites": 501
}, {
	"country": "Czech Republic",
	"visites": 301
}, {
	"country": "Ireland",
	"visites": 201
}, {
	"country": "Germany",
	"visites": 165
}, {
	"country": "Australia",
	"visites": 139
}]
Setting data
To set chart data, simply set data property of the chart.
If the chart already had data set, it will take in the new data and redraw itself. No actions further necessary.
Setting data fields
Depending on chart type, you will also need to configure chart's respective Series so that they know which fields in data contain the information they need.
That's where dataFields property comes into play.
As we saw earlier in part on Instantiating chart elements, a PieSeries needs two data fields to make a sense of the data:
- One that holds numeric value; (
value) - One that holds title for the slice. (
category)
Different chart types will have more complex dataField configurations. Please refer to the articles on specific chart types, for more in-depth information about those. We are not going to get into particular details here.
External data
The charts in 4 have built-in capabilities to dynamically load external data in CSV and JSON formats.
To make the chart load external data, we need to use chart's dataSource property, instead of data.
There's a separate article on external data here, so we'll just touch the topic briefly here.
A dataSource is an object of type DataSource which specifies the URL, the type, and possibly some related settings.
As an example, here's how we would rework previous Pie chart examples, to load the data from an external URL:
chart.dataSource.url = "pie.json";
If we wanted to load data in, say, CSV, we'd also need to set data parser, and, most probably, instructions about the format. (separator, etc.)
Type-check
Probably the greatest benefit of using amCharts with TypeScript is built-in type-check and code completion.
Error checking
Basically, this means that TS will go to great lengths to ensure you don't do anything stupid, like assigning a wrong value, or using a wrong class type.
Just a small example, say I want to set position setting for Legend. I enter "leftt". (I made a mistake in typing "left")
TypeScript will catch that and immediately will outline the error:
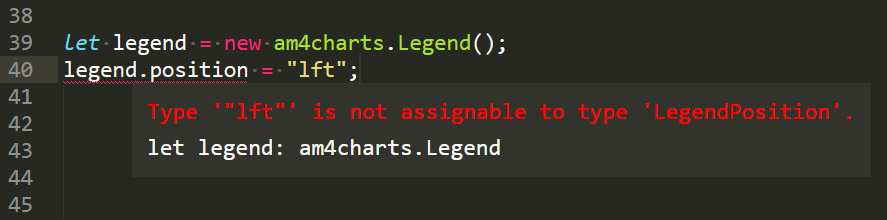
TypeScript-compatible IDEs like VisualStudio, Sublime Edit (shown in the screenshot above), or Atom will outline error as well as provide a description for the property so that you know how to use it.
Code completion / insight
TypeScript when used in compatible IDEs, also lets you take advantage of the code completion.
Start typing a property name, and it will automatically offer to complete the code as well as provide insight:
TypeScript strict mode
amCharts 4 currently has partial support for TypeScript's strict mode. If you are using strict mode, you must set these options in your tsconfig.json:
{
  "compilerOptions": {
    "strictNullChecks": false
  }
}
We are working on enabling full strict mode support for V4.
TypeScript 3
amCharts 4 fully supports TypeScript 3.
Lazy loading amCharts
Check out this tutorial for information on how you can lazy-load amCharts modules on-demand, rather than compiling them into your app.
Using amCharts with Jest
It is not currently possible to use amCharts in Jest tests, because Jest does not have support for SVG.
amCharts internally requires SVG, and so there isn't anything we can do to fix this, instead this needs to be fixed in jsdom.
If you pre-build your project you can then use Puppeteer with Jest to run your unit tests in a browser (which has full support for SVG), and now you can use amCharts in unit tests.
Alternatively, you can mock the amCharts modules. In order to do this, create the following files at the root of your project:
__mocks__/@amcharts/amcharts4/core.js
__mocks__/@amcharts/amcharts4/charts.js
__mocks__/@amcharts/amcharts4/maps.js
When you import amCharts, Jest will instead import the above files. Inside of those files you can create a fake amCharts API which will be used only during testing:
exports.Sprite = class { ... };
exports.Button = class { ... };