This article is a work in progress. Please check back in in a while for more performance tips.
In this article we have collected some generic and specific tips for improving performance of your charts.
Generic tips
Animations
Enabling animations (e.g. via using "animated" theme), will dramatically increase CPU usage. That is OK for basic charts, but for ones that have a lot of data, it might be a good idea to disable animations.
Semi-transparency
When you have semi-transparent items (via fillOpacity and/or strokeOpacity), computer has to perform a lot of additional computations in order to render elements that are superimposed by a semi-transparent element.
Combine it with animations, and you have a lot of extra CPU juice required to run this setup.
Consider using solid fills/stroke (set them to 1).
Auto-sizing
By default, the chart will watch for changes in size of its container and will resize itself automatically. However, in some cases, e.g. where our application might be playing some resize animations, extensive auto-resizing might be very resource-intensive and bog down the browser. This quick tutorial will show how you can do those resizes manually.
Disabling autoresizing
Disabling automatic resizing for a chart is easy as this:
chart.svgContainer.autoResize = false;
chart.svgContainer.autoResize = false;
{
  // ...
  "svgContainer": {
    "autoResize": false
  }
}
Triggering resize
Once we want our chart to size itself to fit into container, we can call its SVG container's measure() method:
chart.svgContainer.measure();
chart.svgContainer.measure();
Possible uses
Imagine a web application that has a dashboard and a side navigation.
A navigation pane has a collapse button, that upon press slides the nav out of the view, gradually freeing up more space for the dashboard.
Once that is happening, charts gradually expand to take up new space.
The issue is that this resizing is happening tens of times per second, causing the chart invalidate and revalidate together.
The better option is to just disable chart auto-resize, and trigger measuring once the nav panel is out of view, so that measuring and rendering happens only once.
Data
Dates
Do your data contain string based dates? The chart will have to parse each and every one of those into a proper Date object.
Consider converting them into Date objects, or timestamps.
[{
  "date": "2019-01-01",
  "value": 100
}, {
  "date": "2019-01-02",
  "value": 120
}, {
  "date": "2019-01-03",
  "value": 90
}]
[{
  "date": new Date(2019, 0, 1),
  "value": 100
}, {
  "date": new Date(2019, 0, 2),
  "value": 120
}, {
  "date": new Date(2019, 0, 3),
  "value": 90
}]
[{
  "date": 1546293600000,
  "value": 100
}, {
  "date": 1546380000000,
  "value": 120
}, {
  "date": 1546466400000,
  "value": 90
}]
All of the the three versions of data are identical in functionality, but some will be faster, because will eliminate the need of parsing strings.
Dynamic data item grouping
Since version 4.7.0 amCharts supports dynamic data point grouping. If you do have a lot of data points plotted on a DateAxis, it makes sense to turn it on, so that there's a fixed number of data points shown at any given time.
This alone can increase performance dramatically.
For more information on how to use it check "Dynamic data item grouping" in DateAxis article.
Series
Line series
Normally, Line series is fast. However, those can be bogged down by tens or even hundreds of thousands data points.
Below are some suggestions that will help reclaim those precious CPU cycles.
Smoothed lines
Line series connect each point with a straight line, by default. If you use their tensionX/tensionY setting, you may create a sleek-looking smoothed lines, instead of jaggy ones.
This comes at a price, though. This kind of rendering requires a lot more CPU power.
If you have a lot of data points, consider disabling this feature: it makes the chart behave slower, while the smoothing effect is not that prominent with anything beyond a few hundred of data points.
Simplifying paths
Say we have 100,000 (one hundred thousand) data points. And we plot a Line series into container that is 1000px wide.
We end up with a curve that fits a hundred (!) points and line segments into a single pixel.
That's a complete waste of resources, since there's no way a user viewing the chart can see the fine details crammed like that.
The solution is to show only a point every X pixels, completely omitting ones in-between.
To do that, we have a global setting am4core.options.minPolylineStep. With default at 0.5 it means: "omit all line points if they are closer than X pixels to the last point drawn".
am4core.options.minPolylineStep = 5;
am4core.options.minPolylineStep = 5;
// It's not a chart-specific setting
// We need to set it as a global option
am4core.options.minPolylineStep = 5;
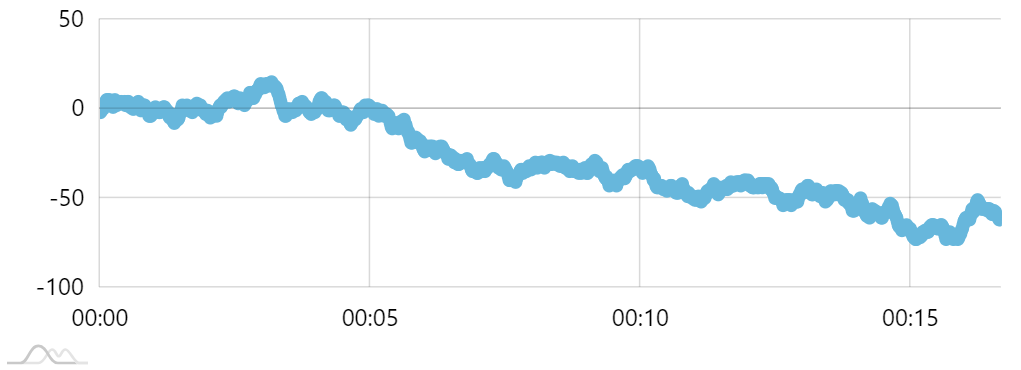
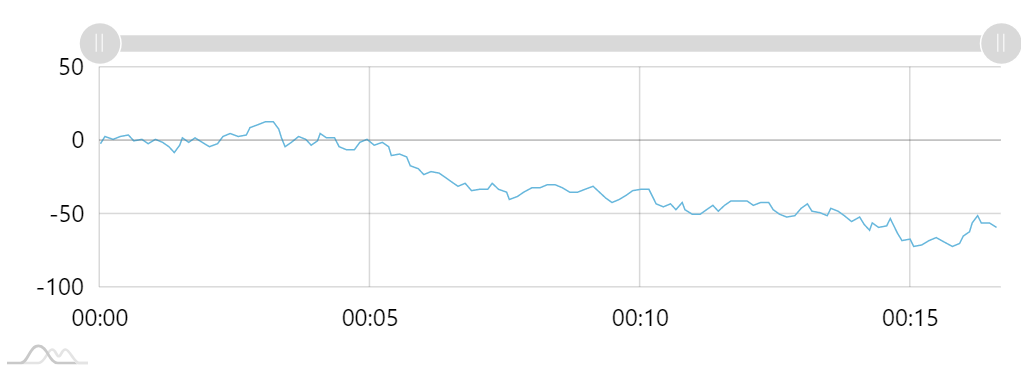
Consider these two versions of the same 50K-datapoint chart:
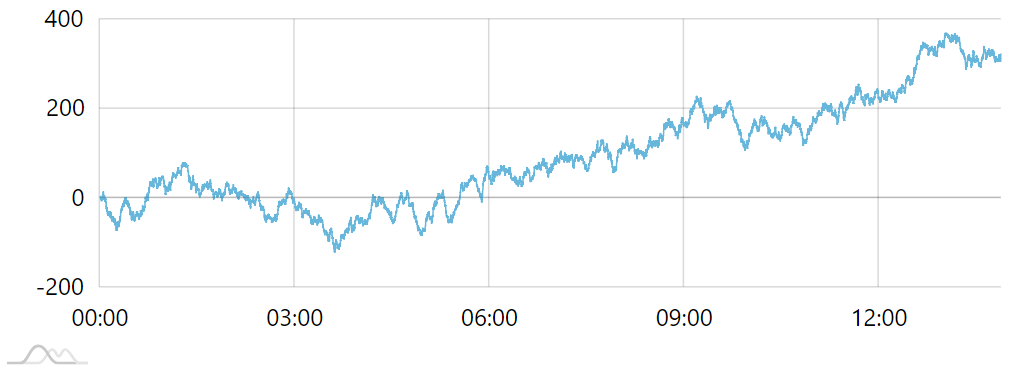
minPolylineStep = 0.5 (default)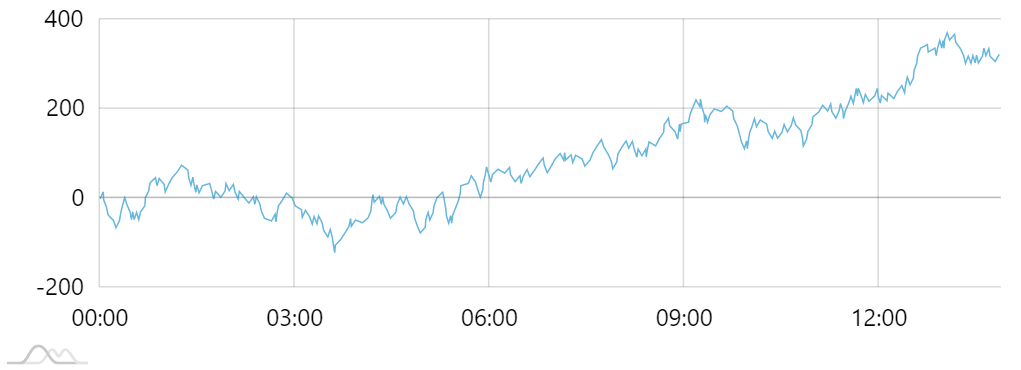
minPolylineStep = 5The first one draws thousands of points, most of them are invisible, or lost in the noise.
The second one retains the same quality of conveying data dynamics, but looks cleaner and works orders of magnitude faster - both in initial rendering and in subsequent zoom operations.
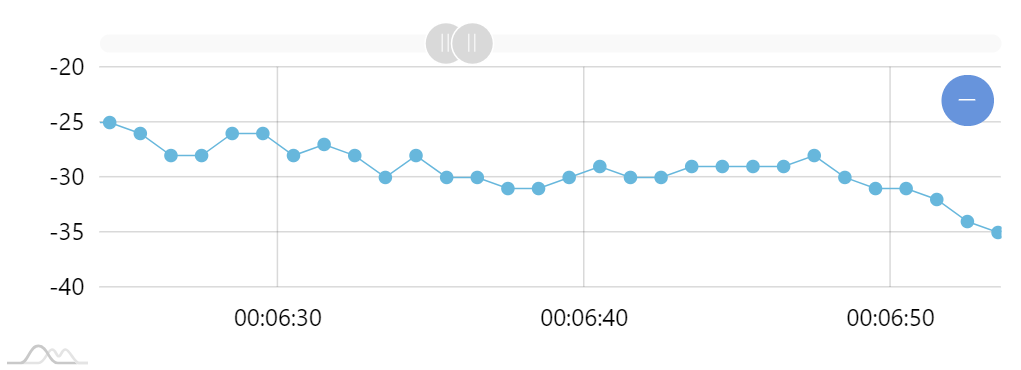
The beauty of this approach is that when user zooms in, more detail will start to emerge. This means you are losing the detail only on zoom levels that would make seeing the detail impossible, anyway.
See the Pen amCharts 4: data-heavy chart by amCharts team (@amcharts) on CodePen.
IMPORTANT This option is not compatible with StepLineSeries.
Column series
Important thing to consider is that each column is a separate SVG element. If you have a thousands of data points, you end up with thousands of column elements, that need to be measured, painted, positioned, moved, etc.
This creates a series impact on performance, not to mention bad UX: how exactly user is supposed to distinguish between 50K of columns crammed into a 1K pixel wide chart?
In such scenarios, it is strongly recommended to drop ColumnSeries in favor of filled LineSeries or StepLineSeries. The latter even will resemble closely packed columns.
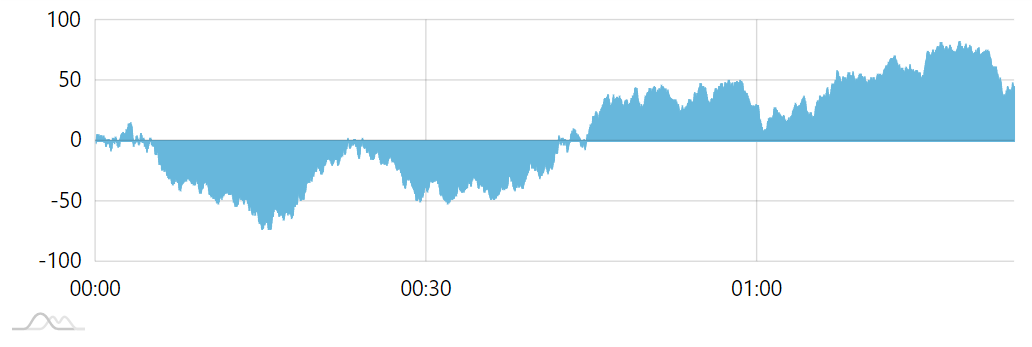
ColumnSeries make chart loading slow
StepLineSeries looks the same but is much fasterBullets
Hiding crammed bullets
Bullets are nice when there are only a handful. When there are a lot of them, they do not start to look a bit messy, but also significantly slow down the chart.
Say we have a Line series with 1000 data points. From performance stand-point it's super fast, since a line is a single path element.
Now, if we have bullets to the series, we now have 1001 separate objects, since each bullet is a separate element.
And on top of that, the chart will look ridiculous with a thousand circles on it:
Obvious solution would be to not use bullets.
However, we have a middle ground: bullets can be automatically disabled or enabled based on density of data points.
For that we have Series' minBulletDistance setting.
It basically means: "If the distance between data points is less than X pixels, hide all bullets".
series.minBulletDistance = 20;
series.minBulletDistance = 20;
{
  // ...
  "series": [{
    // ...
    "minBulletDistance": 20
  }]
}
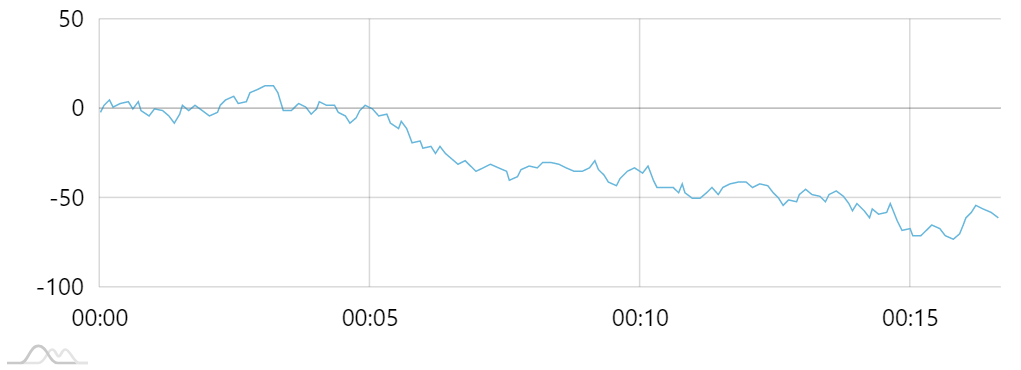
Now, when our 1K-datapoint chart starts, we'll see a bare line because each data point is closer than 20 pixels.
When we start zooming the chart in, we eventually get to the point where data points are sufficiently spaced out, for bullets to appear.
See the Pen amCharts 4: data-heavy chart by amCharts team (@amcharts) on CodePen.
Using simple shapes
Common use of adding bullets to series is to use Bullet object or its derivatives like CircleBullet, LabelBullet, etc.
The issue with it is that all those elements are instances of a Container which adds ability to add any element into it, but also introduces some performance overhead.
If there are a lot of bullets, that millisecond overhead is multiplied.
What is less known, is that you can push any Sprite-based element into Series' bullets and it will just work.
So this code:
let bullet = series.bullets.push(new am4charts.CircleBullet());
bullet.circle.radius = 5;
var bullet = series.bullets.push(new am4charts.CircleBullet());
bullet.circle.radius = 5;
{
  // ...
  "series": [{
    // ...
    "bullets": [{
      "type": "CircleBullet",
      "circle": {
        "radius": 5
      }
    }]
  }]
}
Can be achieved using simple Circle object:
let bullet = series.bullets.push(new am4core.Circle());
bullet.radius = 5;
var bullet = series.bullets.push(new am4core.Circle());
bullet.radius = 5;
{
  // ...
  "series": [{
    // ...
    "bullets": [{
      "type": "Circle",
      "radius": 5
    }]
  }]
}
Visually, both will produce the same result, except the latter will do it a bit faster.
NOTE Predefined bullet types like CircleBullet and LabelBullet come pre-configured for best fit and placement. You may need to set extra settings for your "standalone" bullet elements, like for instance setting horizontalCenter for Label in order for it to appear centered.
Instantiation
Daisy-chaining multiple charts
While amCharts 4 supports chunked initialization procedure, having many charts on the same page can still bog down the browser. In this case you can enable the queued chart instantiation.
am4core.options.queue = true;
am4core.options.queue = true;
IMPORTANT This line needs to go before any chart is created.
When enabled, the system will ensure that charts are built one by one. The next chart will not start building itself until the previous one has finished.
In this setup the last chart might take longer to render, but throughout all the operation the browser will remain fully operational and usable.
Deferred daisy-chained instantiation
NOTE The feature described in this chapter is available from version 4.10.0.
While daisy-chaining technique described in previous chapter allows delaying chart creation in an orderly fashion, all the instances of the charts are created all at once, with only some of it processing delayed.
This means that on chart-heavy dashboards, time-to-screen might be significantly delayed, even for the first chart.
For true daisy-chained instantiation, amCharts 4 employs a "deferred" instantiation queuing.
Creating a deferred chart instance
To create a deferred instance, we use a special global function am4core.createDeferred().
It accepts three parameters:
- callback function - it will be function that will be called when it's time to instantiate the chart. It can be a reference to a global function, method, or an anonymous function. This function must return a valid chart instance.
- scope (optional) - a scope to call callback function in.
- additional parameters (optional) - any additional parameters passed into
createDeferred()will be passed as parameters to the callback function.
Since chart instance is not created right away, the function will return a Promise with chart instance when available. This means that you can use all Promise-bound functionality like await and then().
am4core.createDeferred(function(div) {
  // Create first chart
  let chart = am4core.create(div, am4charts.XYChart);
  // ...
  return chart;
}, "chartdiv1").then(chart) {
  // `chart` variable holds an instance of the chart
  console.log("Chart ready", chart);
}

am4core.createDeferred(function(div) {
  // Create second chart
  let chart = am4core.create(div, am4charts.PieChart);
  // ...
  return chart;
}, "chartdiv2").then(chart) {
  // `chart` variable holds an instance of the chart
  console.log("Chart ready", chart);
}
am4core.createDeferred(function(div) {
  // Create first chart
  var chart = am4core.create(div, am4charts.XYChart);
  // ...
  return chart;
}, "chartdiv1").then(chart) {
  // `chart` variable holds an instance of the chart
  console.log("Chart ready", chart);
}

am4core.createDeferred(function(div) {
  // Create second chart
  var chart = am4core.create(div, am4charts.PieChart);
  // ...
  return chart;
}, "chartdiv2").then(chart) {
  // `chart` variable holds an instance of the chart
  console.log("Chart ready", chart);
}
The then() part is totally optional. We don't need to use it, unless we want to do something to the newly-created chart instance, or store it in our own app.
Specifying time-gap between deferred chart instantiations
By default, system will wait 100 milliseconds between deferred chart instantiations.
We can change the delay using global options:
am4core.options.deferredDelay = 500;
am4core.options.deferredDelay = 500;
Setting deferredDelay to zero will disable the wait between chart instantiations altogether.
IMPORTANT createDeferred() is not compatible with the onlyShowOnViewport setting described in the next section.
Lazy-loading charts
Normally, all charts on page load, even if they are way outside the current viewport.
With amCharts 4's built-in lazy-loading feature you can ensure that chart will only start initializing when its container scrolls into view.
am4core.options.onlyShowOnViewport = true;
am4core.options.onlyShowOnViewport = true;
IMPORTANT This line needs to go before any chart is created.
Now, the charts that are outside current viewport when the page loads, will not load and will not strain the CPU unnecessarily. Only when user scrolls down to the chart they will initialize and play initial animations if enabled, as per the demo below:
See the Pen amCharts 4: lazy-load charts by amCharts team (@amcharts) on CodePen.
If your charts are loaded in a scrollable container, you may need to specify it using viewportTarget property:
am4core.options.onlyShowOnViewport = true;
am4core.options.viewportTarget = document.getElementById("charts");
am4core.options.onlyShowOnViewport = true;
am4core.options.viewportTarget = document.getElementById("charts");
IMPORTANT viewportTarget can also contain an array of several references.