Force Directed Tree is a special kind of chart used to display of multi-item data related in hierarchical, linear or mixed way, as a series of linked bubbles.
Due to flexible configuration options, ForceDirectedTree chart can be used to create whole slew of different chart types, including Hyperbolic Tree, Packed Bubbles, Mind Map, and even Network Diagrams.

Creating a Force Directed Tree
To create a Force Directed Tree you will only need just four things:
- A chart instance.
- A series.
- Defined data fields.
- Data.
This is a minimum requirement for the chart. We'll go over each of those shortly.
Version info
Force Direced Tree is available in amCharts 4 since version 4.3.8.
Importing modules/scripts
Needless to say, before you can use modules/objects, you need to make sure all required modules (in TypeScript), or files (in JavaScript) are imported. Please refer to our Getting started articles for more details:
Force Directed Tree comes in a form of a plugin. To start using it we will need to include both core (main module) and charts modules, as well as forceDirected plugin.
import * as am4core from "@amcharts/amcharts4/core";
import * as am4charts from "@amcharts/amcharts4/charts";
import * as am4plugins_forceDirected from "@amcharts/amcharts4/plugins/forceDirected";
<script src="//cdn.amcharts.com/lib/4/core.js"></script>
<script src="//cdn.amcharts.com/lib/4/charts.js"></script>
<script src="//cdn.amcharts.com/lib/4/plugins/forceDirected.js"></script>
We'll be importing and referring these as am4core, am4charts, and am4plugins_forceDirected in the course of this article, and overall in our demos and tutorials.
Creating chart instance
For that we're going to be using am4core.create() function. (or am4core.createFromConfig() if you are using JSON-based config approach)
let chart = am4core.create("chartdiv", am4plugins_forceDirected.ForceDirectedTree);
var chart = am4core.create("chartdiv", am4plugins_forceDirected.ForceDirectedTree);
var chart = am4core.createFromConfig({
  // ... chart config
}, "chartdiv", am4plugins_forceDirected.ForceDirectedTree);
Creating a series
As we mentioned earlier, the chart needs to have at least one series. It is created just like on any other serial chart: create a series object (in this case it's ForceDirectedTreeSeries) and push it to chart's series list:
let series = chart.series.push(new am4plugins_forceDirected.ForceDirectedTreeSeries());
var series = chart.series.push(new am4plugins_forceDirected.ForceDirectedTreeSeries());
{
  "series": [{
    "type": "ForceDirectedTreeSeries"
  }]
}
The data in Force Directed Tree is always set to the series. We'll see how, in the next chapter.
Data
Data structure
Force Directed Tree, just like most charts, use an array of objects as the data.
As we will see later in this article data for a Force Directed Tree can be multi-level, since the chart itself can be hierarchical.
More about that later. Let's start with a basic data example.
There's only one thing that Force Directed Tree needs to know about each of its items - a numeric value.
The value determines how big a bubble (node) will be in comparison to other bubbles.
Let's see take a very basic example of a 5-item Force Directed Tree data:
[{
  "value": 190
},{
  "value": 289
}, {
  "value": 635
}, {
  "value": 732
}, {
  "value": 835
}]
NOTE The actual fields do not necessarily have to be named "value". You can name them anything, and then just instruct the chart which fields to us, as we will see later in this article in a section about "data fields".

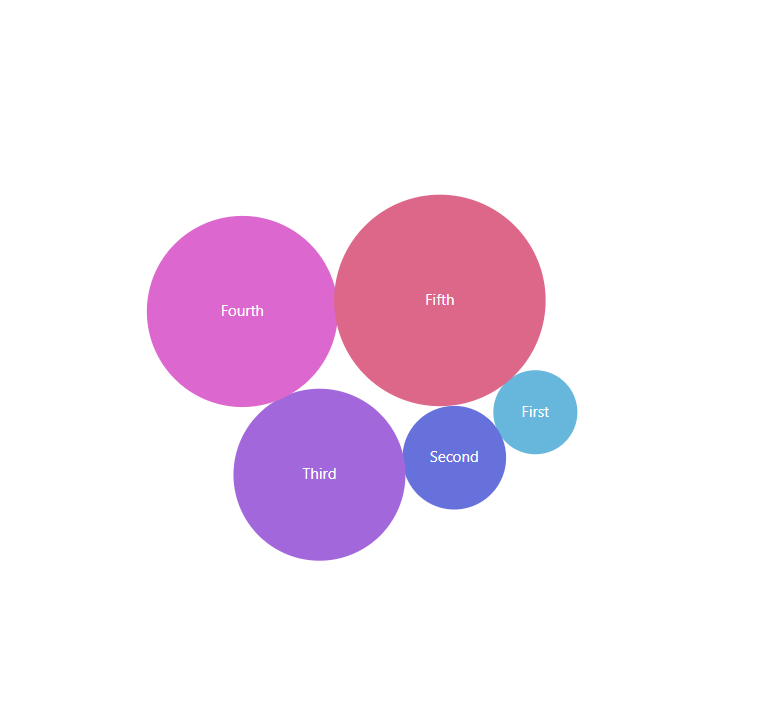
Item names in data
While we only need values to draw the chart, it would also be nice to name our items, so that it's not just plain circles.
For that we can add names to our data as well:
[{
  "name": "First",
  "value": 190
}, {
  "name": "Second",
  "value": 289
}, {
  "name": "Third",
  "value": 635
}, {
  "name": "Fourth",
  "value": 732
}, {
  "name": "Fifth",
  "value": 835
}]
NOTE Again, actual name of the field does not matter, as we will need to use "data fields" to specify what type of data is in what field.
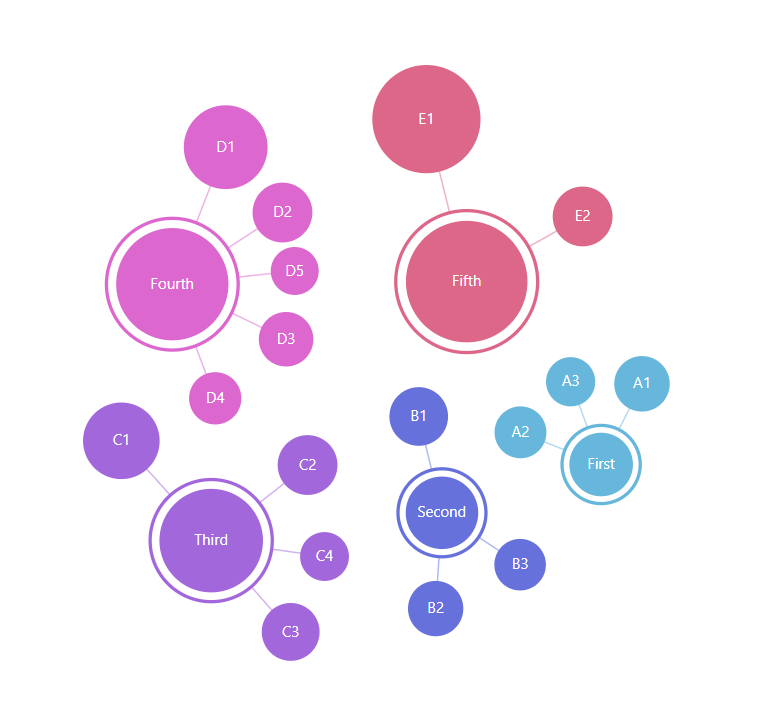
Multi-level data
As we might have already mentioned several times, Force Directed Tree is not limited to a single level. Each item can have sub-items. Those can have sub-items of their own.
When an item has sub-items, let's call them children, the bubble for the item becomes a center for smaller bubbles comprising it.
A data for multi-level Force Directed Tree is also multi-level.
If an item has children, it has a field in data which will hold an array of items. E.g.:
[{
  "name": "First",
  "children": [{
    "name": "A1", "value": 100
  }, {
    "name": "A2", "value": 60
  }, {
    "name": "A3", "value": 30
  }]
}, {
  "name": "Second",
  "children": [{
    "name": "B1", "value": 135
  }, {
    "name": "B2", "value": 98
  }, {
    "name": "B3", "value": 56
  }]
}, {
  "name": "Third",
  "children": [{
    "name": "C1", "value": 335
  }, {
    "name": "C2", "value": 148
  }, {
    "name": "C3", "value": 126
  }, {
    "name": "C4", "value": 26
  }]
}, {
  "name": "Fourth",
  "children": [{
    "name": "D1", "value": 415
  }, {
    "name": "D2", "value": 148
  }, {
    "name": "D3", "value": 89
  }, {
    "name": "D4", "value": 64
  }, {
    "name": "D5", "value": 16
  }]
}, {
  "name": "Fifth",
  "children": [{
    "name": "E1", "value": 687
  }, {
    "name": "E2", "value": 148
  }]
}]
NOTE Once again, we're using "children" here, but it does not have to be named like that. For what it's worth, we can have it named "minions" and use "data fields" to specify that this field holds sub-items.
IMPORTANT If item has children, it does not have to have value set, because its value will automatically become the sum of the values of its children.
In-line data
We assign the data to the series's data property:
series.data = [{
  "value": 190
},{
  "value": 289
}, {
  "value": 635
}, {
  "value": 732
}, {
  "value": 835
}]
series.data = [{
  "value": 190
},{
  "value": 289
}, {
  "value": 635
}, {
  "value": 732
}, {
  "value": 835
}]
{
  // ...
  "series": [{
    // ...
    "data": [{
      "value": 190
    },{
      "value": 289
    }, {
      "value": 635
    }, {
      "value": 732
    }, {
      "value": 835
    }]
  }]
}
External data
We can also make the chart load external data using dataSource.
series.dataSource.url = "chart_data.json";
series.dataSource.url = "chart_data.json";
{
  // ...
  "series": [{
    // ...
    "dataSource": {
      "url": "chart_data.json"
    }
  }]
}
MORE INFO Please refer to our "External data" article, for more details.
Setting data fields
OK, so we mentioned "data fields" several times, already. Here's what they are.
Data fields are used to instruct the chart which fields in data hold specific information.
We specify data fields via series' dataFields property, which is basically a key-value object. The key is a specific structured field, like a value or a name, while value is a string key of a field in data to look for in each data item.
Force Directed Tree charts support these types of data fields: (as defined by IForceDirectedSeriesDataFields).
| Data field | Type | Used for |
|---|---|---|
"children" | Array | Array of sub-items (children). |
"collapsed" | Boolean | Should this item be collapsed by default? |
"color" | Color | A color to be used for the item fill. |
"id" | String | Item's unique ID. |
"fixed" | Boolean | Since 4.6.2 Is it a fixed (static) node? |
"hiddenInLegend" | Boolean | Should this item be omitted from legend? |
"linkWith" | Boolean | An array of unrelated node IDs to link node with. |
"name" | String | Name of the item. |
"value" | Number | Numeric value of the item. |
All fields are optional, with one caveat: if item does not have children, it has to have a "value" data field set, because without it, the chart won't be able to determine its value and therefore radius of the bubble.
Here's how dataFields would look like for the sample data we had above:
series.dataFields.value = "value";
series.dataFields.name = "name";
series.dataFields.children = "children";
series.dataFields.value = "value";
series.dataFields.name = "name";
series.dataFields.children = "children";
{
  // ...
  "series": [{
    // ...
    "dataFields": {
      "value": "value",
      "name": "name",
      "children": "children"
    }
  }]
}
And, we're done. Our chart is ready.
Complete example
// Create chart
let chart = am4core.create("chartdiv", am4plugins_forceDirected.ForceDirectedTree);

// Create series
let series = chart.series.push(new am4plugins_forceDirected.ForceDirectedSeries())

// Set data
series.data = [{
  "name": "First",
  "children": [{
    "name": "A1", "value": 100
  }, {
    "name": "A2", "value": 60
  }, {
    "name": "A3", "value": 30
  }]
}, {
  "name": "Second",
  "children": [{
    "name": "B1", "value": 135
  }, {
    "name": "B2", "value": 98
  }, {
    "name": "B3", "value": 56
  }]
}, {
  "name": "Third",
  "children": [{
    "name": "C1", "value": 335
  }, {
    "name": "C2", "value": 148
  }, {
    "name": "C3", "value": 126
  }, {
    "name": "C4", "value": 26
  }]
}, {
  "name": "Fourth",
  "children": [{
    "name": "D1", "value": 415
  }, {
    "name": "D2", "value": 148
  }, {
    "name": "D3", "value": 89
  }, {
    "name": "D4", "value": 64
  }, {
    "name": "D5", "value": 16
  }]
}, {
  "name": "Fifth",
  "children": [{
    "name": "E1", "value": 687
  }, {
    "name": "E2", "value": 148
  }]
}];

// Set up data fields
series.dataFields.value = "value";
series.dataFields.name = "name";
series.dataFields.children = "children";

// Add labels
series.nodes.template.label.text = "{name}";
series.fontSize = 10;
series.minRadius = 15;
series.maxRadius = 40;
// Create chart
var chart = am4core.create("chartdiv", am4plugins_forceDirected.ForceDirectedTree);

// Create series
var series = chart.series.push(new am4plugins_forceDirected.ForceDirectedSeries())

// Set data
series.data = [{
  "name": "First",
  "children": [{
    "name": "A1", "value": 100
  }, {
    "name": "A2", "value": 60
  }, {
    "name": "A3", "value": 30
  }]
}, {
  "name": "Second",
  "children": [{
    "name": "B1", "value": 135
  }, {
    "name": "B2", "value": 98
  }, {
    "name": "B3", "value": 56
  }]
}, {
  "name": "Third",
  "children": [{
    "name": "C1", "value": 335
  }, {
    "name": "C2", "value": 148
  }, {
    "name": "C3", "value": 126
  }, {
    "name": "C4", "value": 26
  }]
}, {
  "name": "Fourth",
  "children": [{
    "name": "D1", "value": 415
  }, {
    "name": "D2", "value": 148
  }, {
    "name": "D3", "value": 89
  }, {
    "name": "D4", "value": 64
  }, {
    "name": "D5", "value": 16
  }]
}, {
  "name": "Fifth",
  "children": [{
    "name": "E1", "value": 687
  }, {
    "name": "E2", "value": 148
  }]
}];

// Set up data fields
series.dataFields.value = "value";
series.dataFields.name = "name";
series.dataFields.children = "children";

// Add labels
series.nodes.template.label.text = "{name}";
series.fontSize = 10;
series.minRadius = 15;
series.maxRadius = 40;
var chart = am4core.createFromConfig({

  "series": [{
    "type": "ForceDirectedSeries",

    "data": [{
      "name": "First",
      "children": [{
        "name": "A1", "value": 100
      }, {
        "name": "A2", "value": 60
      }, {
        "name": "A3", "value": 30
      }]
    }, {
      "name": "Second",
      "children": [{
        "name": "B1", "value": 135
      }, {
        "name": "B2", "value": 98
      }, {
        "name": "B3", "value": 56
      }]
    }, {
      "name": "Third",
      "children": [{
        "name": "C1", "value": 335
      }, {
        "name": "C2", "value": 148
      }, {
        "name": "C3", "value": 126
      }, {
        "name": "C4", "value": 26
      }]
    }, {
      "name": "Fourth",
      "children": [{
        "name": "D1", "value": 415
      }, {
        "name": "D2", "value": 148
      }, {
        "name": "D3", "value": 89
      }, {
        "name": "D4", "value": 64
      }, {
        "name": "D5", "value": 16
      }]
    }, {
      "name": "Fifth",
      "children": [{
        "name": "E1", "value": 687
      }, {
        "name": "E2", "value": 148
      }]
    }],

    "dataFields": {
      "value": "value",
      "name": "name",
      "children": "children"
    },

    "nodes": {
      "label": {
        "text": "{name}"
      }
    },

    "fontSize": 10,
    "minRadius": 15,
    "maxRadius": 40
  }]

}, "chartdiv", am4plugins_forceDirected.ForceDirectedTree);
See the Pen amCharts 4: Force directed tree by amCharts team (@amcharts) on CodePen.
Nodes
A node is a circle that represents a value / a tree item.
Nodes can have many children and one parent.
Ones that don't have any parent (coming from the top level of data) are called "top-level" nodes.
This section will discuss certain aspects of nodes, their functionality and configuration.
Sizing
A node's size (radius of a circle) depends on its value.
Node's own value is determined this way:
- If data for the node contains numeric value (as determined via
dataFields, that value is used for the node. It is not affected by any other values in the hierarchy. - If there's no value set specifically for the node, the value is calculated by summing up values of all its child nodes. It works like that all the way through hierarchy: second level node's value is a sum of its children that reside in third level, and so on.
The actual size of the node is calculated in how its value relates to the maximum value across whole of the Series.
The smallest possible radius for the bubble with smallest value in the series is determined by series' minRadius setting (default: 1%).
Similarly, the radius of the bubble with biggest value is set by maxRadius (default: 8%).
To control the scale of smallest, biggest, and in-between nodes, use these two settings.
NOTE Both can be set either using absolute pixel values (i.e. 30) or percent value relative to the chart width or height whichever is smaller (i.e. am4core.percent(5)).
You can even set those to identical numbers to make all bubbles identical in size.
series.minRadius = 5
series.maxRadius = 70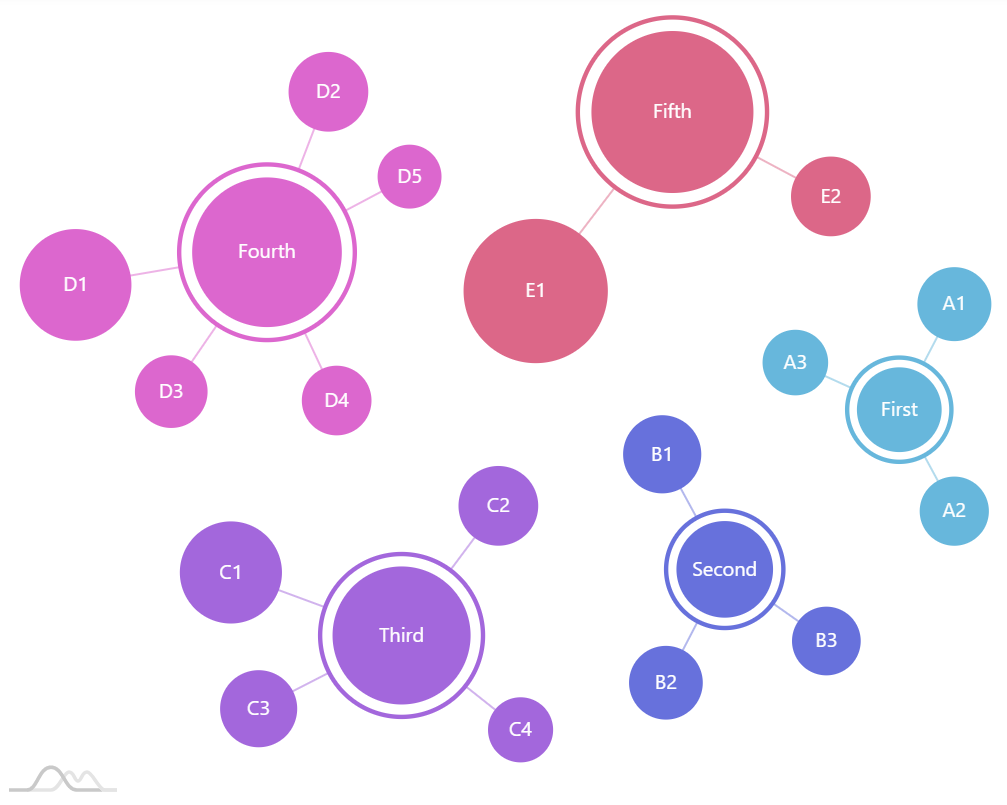
series.minRadius = 15
series.maxRadius = 40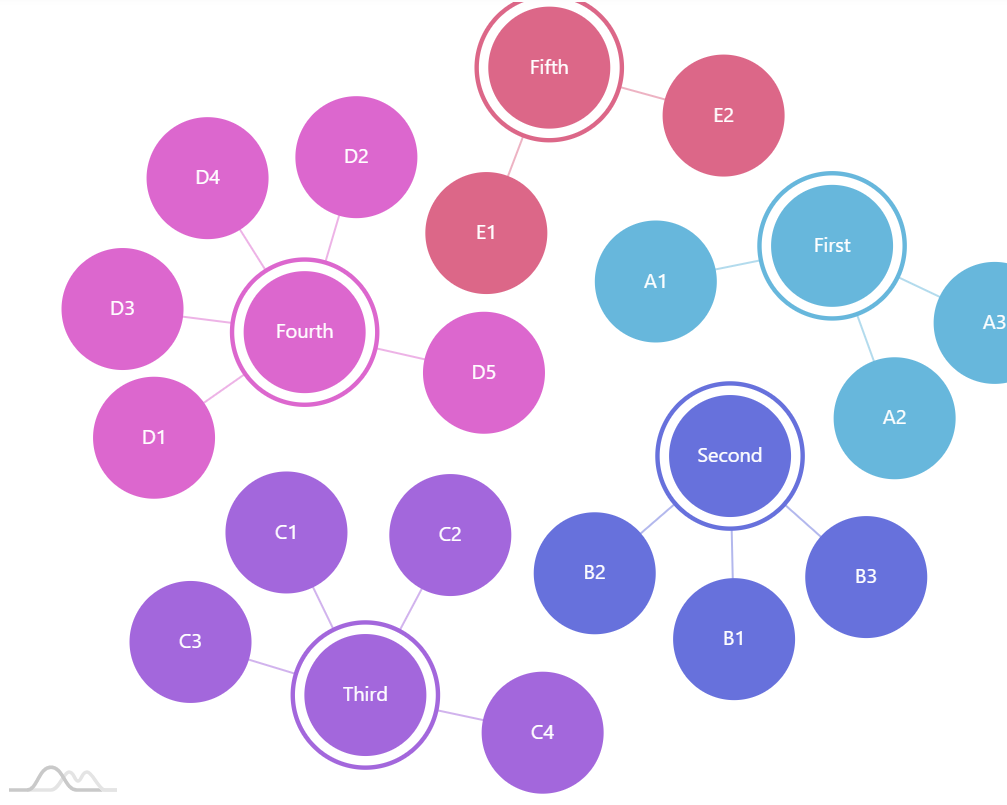
series.minRadius = 30series.maxRadius = 30
Colors
How colors are assigned to nodes
Colors to bubbles are assigned automatically, from the color set in series.colors, which in turn is controlled by a theme we choose to use.
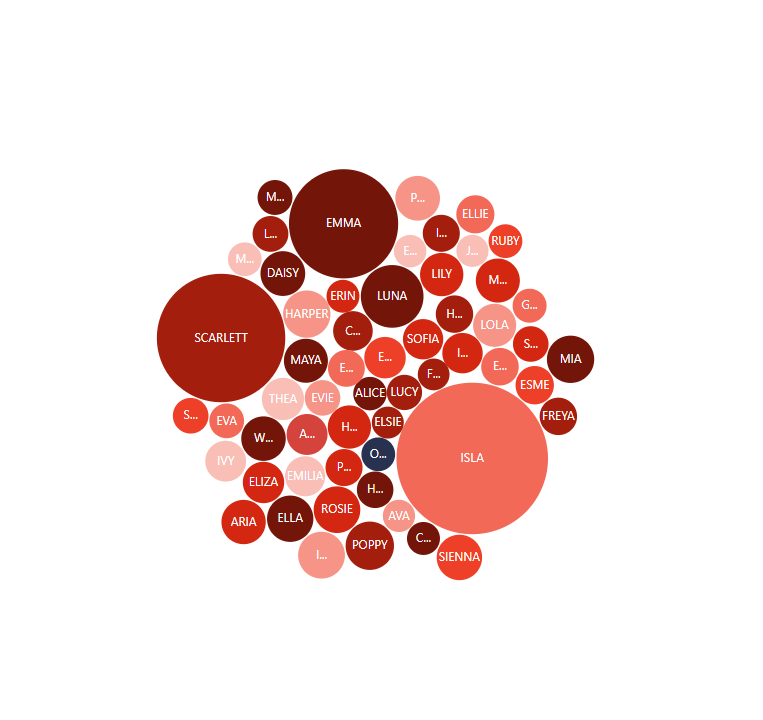
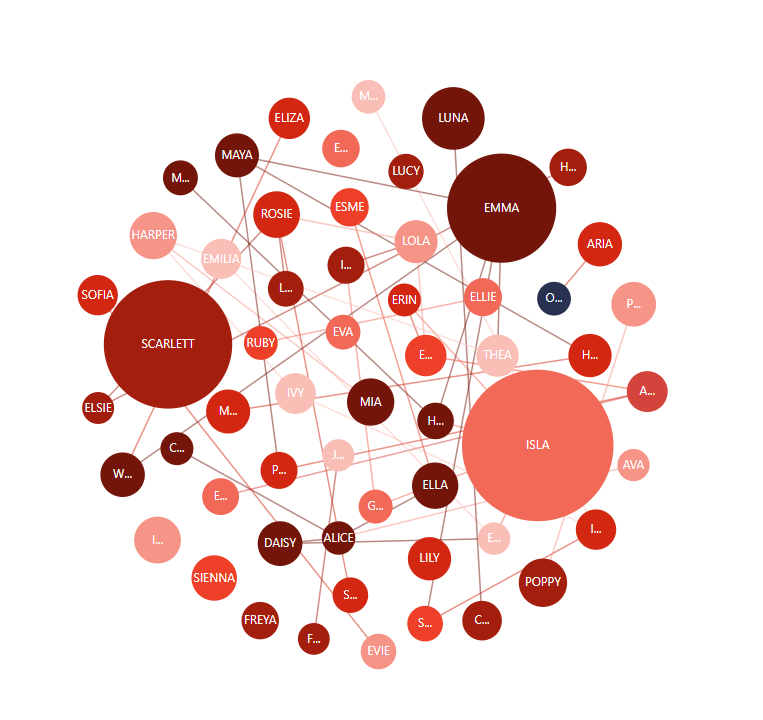
The colors are assigned using certain logic: a new color is assigned to every new node until the first level that has more than one node.
Say we have one central node, three its children, and a vast amount of third level nodes. The first color from the list will go to the single top-level node, then each node in the second level will get its own color. Third level nodes will inherit the color from their immediate parent.
Another scenario: we have three top-level nodes, which in turn have a few children each. Now the top level is the level with more than one node, so each top-level node will get a unique color, while their second level children will have to live with inherited colors.
Top-level with multiple nodes 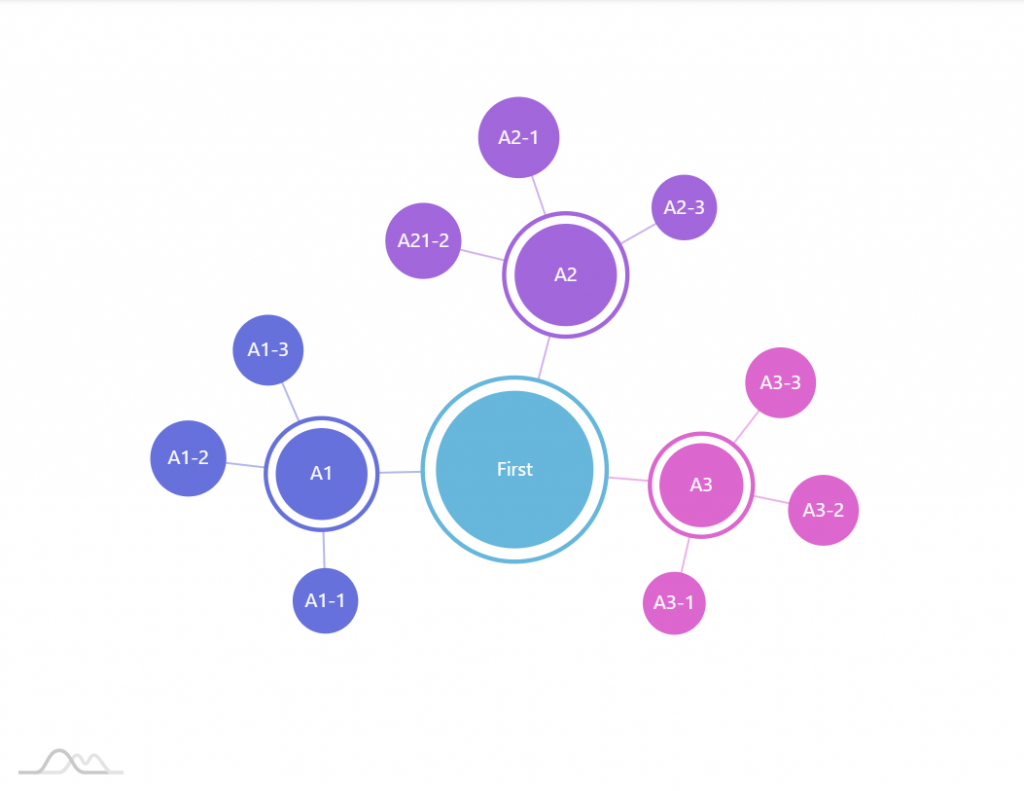
Top-level with a single node
Using custom colors
You can use "color" data field to bind custom colors to your nodes:
series.dataFields.color = "color";
series.dataFields.color = "color";
{
  // ...
  "series": [{
    // ...
    "dataFields": {
      // ...
      "color": "color"
    }
  }]
}
The above will ensure, that instead of using series' color set, it will look into data for a color.
Overriding color set
If we don't want to touch the data, we could just go ahead and modify the colors in series' color set. The concept is described in great detail here. We're just provide a quick TL;DR version:
series.colors.list = [
  am4core.color("#F42B03"),
  am4core.color("#D84A05"),
  am4core.color("#EC7505"),
  am4core.color("#E89005")
];
series.colors.list = [
  am4core.color("#F42B03"),
  am4core.color("#D84A05"),
  am4core.color("#EC7505"),
  am4core.color("#E89005")
];
{
  // ...
  "series": [{
    // ...
    "colors: {
      "list": [
        "#F42B03",
        "#D84A05",
        "#EC7505",
        "#E89005"
      ]
    }
  }]
}
Using single color for everything
Similarly, to use just a single color for everything, we can create a color set with a single color and instruct it to reuse it for all nodes:
series.colors.list = am4core.color("#F42B03");
series.colors.wrap = false;
series.colors.list = am4core.color("#F42B03");
series.colors.wrap = false;
{
  // ...
  "series": [{
    // ...
    "colors: {
      "list": [
        "#F42B03"
      ],
      "reuse": true
    }
  }]
}
Appearance
Appearance of the node (bubble) can be configured by accessing series node template: series.nodes.template.
It's an object of type ForceDirectedNode. Follow the link, to check out what properties are available there.
Basically, it contains three visual elements:
| Property | Type | Comment |
circle | Circle | The main node's bubble. |
outerCircle | Circle | The outer circle of the bubble if it has children. |
label | Label | Node's label. |
You can access any of those to make any modification.
For example, if we wanted to make outer circle to cast shadow, we could push a DropShadowFilter instance into its filters:
series.nodes.template.outerCircle.filters.push(new am4core.DropShadowFilter());
series.nodes.template.outerCircle.filters.push(new am4core.DropShadowFilter());
{
  // ...
  "series": [{
    // ...
    "nodes: {
      "outerCircle": {
        "filters": [{
          "type": "DropShadowFilter"
        }]
      }
    }
  }]
}
Labels
Each node automatically contains a label element (accessible via label property). All we have to do is to set its text property to what we want to be displayed there, as well as any other label-formatting setting, such as fontSize.
And since node has a full-fledged data item attached to it, we can use data binding placeholders as well.
series.nodes.template.label.text = "{name}";
series.nodes.template.label.text = "{name}";
{
  // ...
  "series": [{
    // ...
    "nodes": {
      "label": {
        "text": "{name}"
      }
    }
  }]
}
Tooltips
Tooltips on nodes can be added just like to any other chart object: by setting node template'stooltipText property.
We can use curly bracket data placeholders here, too:
series.nodes.template.tooltipText = "{name}: [bold]{value}[/]";
series.nodes.template.tooltipText = "{name}: [bold]{value}[/]";
{
  // ...
  "series": [{
    // ...
    "nodes": {
      "tooltipText": "{name}: [bold]{value}[/]"
    }
  }]
}
NOTE Tooltip contents are same across all levels of nodes. If you'd like to differentiate tooltip content based on depth, check out this tutorial: "Different tooltip content per each level of Force Directed nodes".
Toggling
Controlling toggling of nodes
By default each node that has children of its own can be "toggled".
When node is toggled off, its children are hidden and it's outer circle gets closer to the inner one, indicating that it is "closed".
Toggling can be disabled by setting togglable = false on a node template:
series.nodes.template.togglable = false;
series.nodes.template.togglable = false;
{
  // ...
  "series": [{
    // ...
    "nodes": {
      // ...
      "togglable": false
    }
  }]
}
Pre-hiding levels
Normally, the whole tree will be fully shown when chart is initialized.
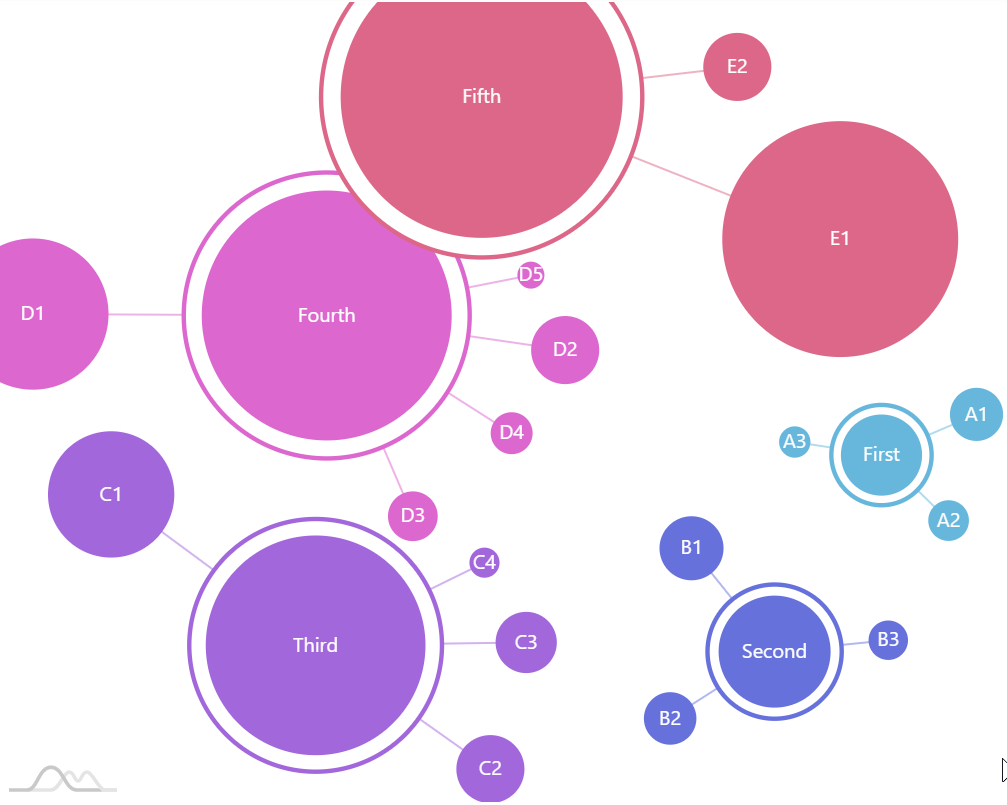
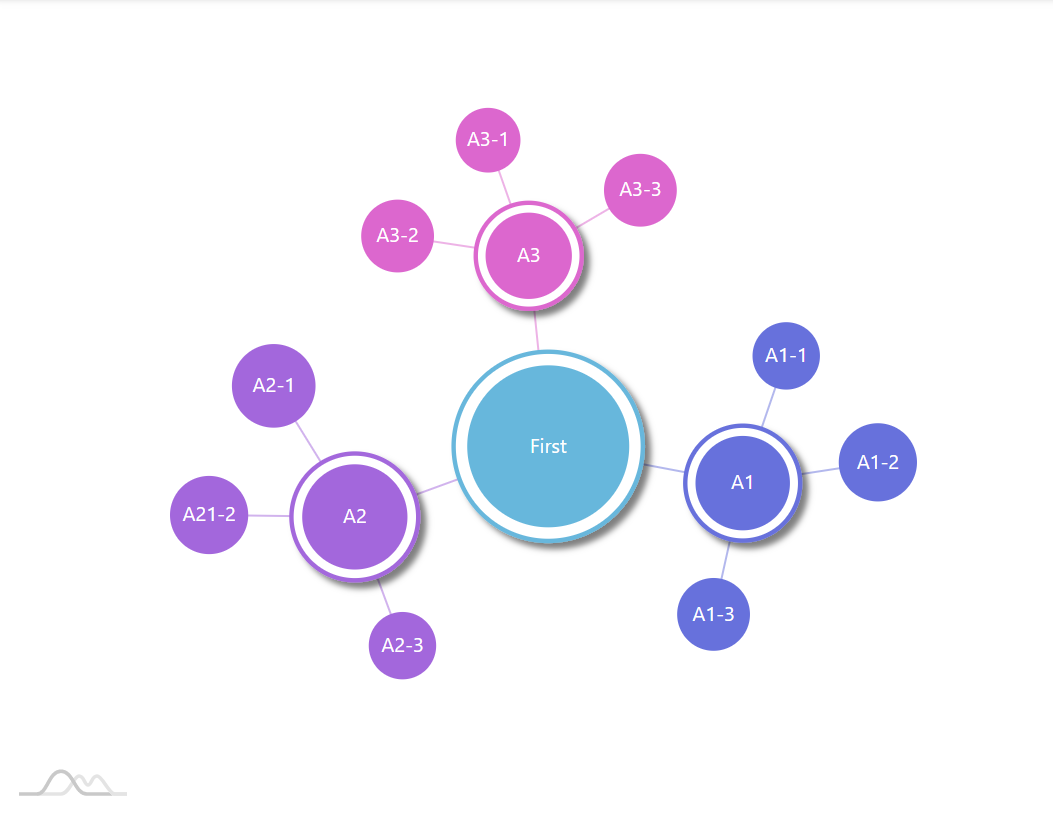
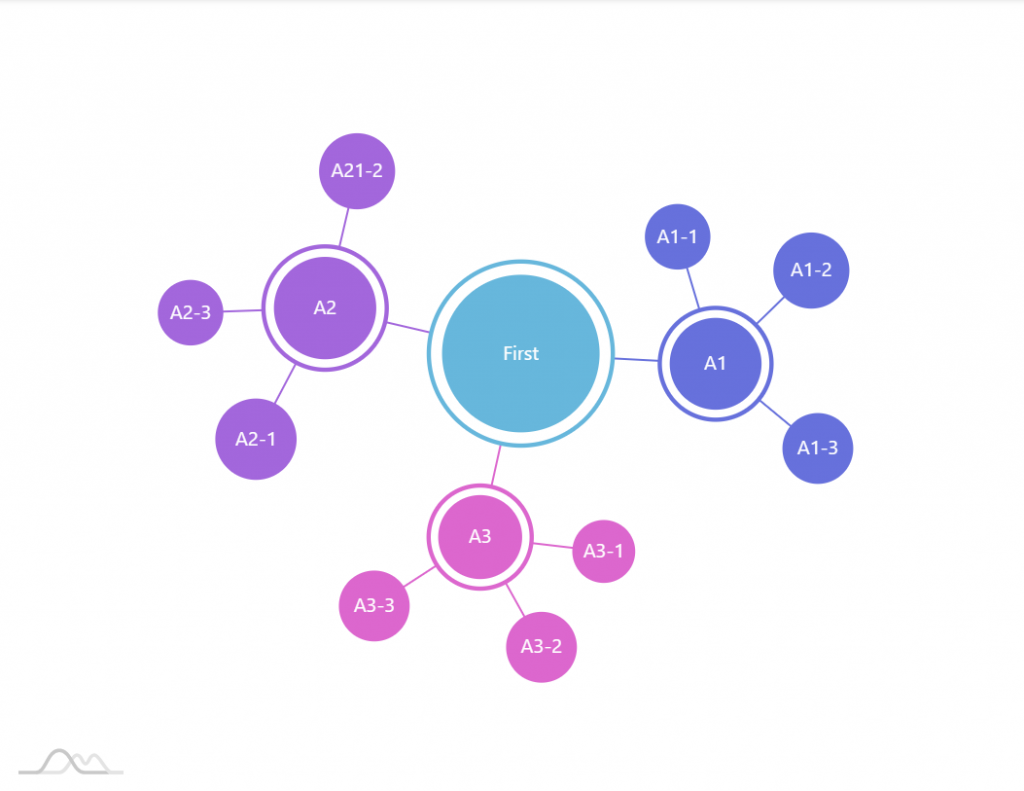
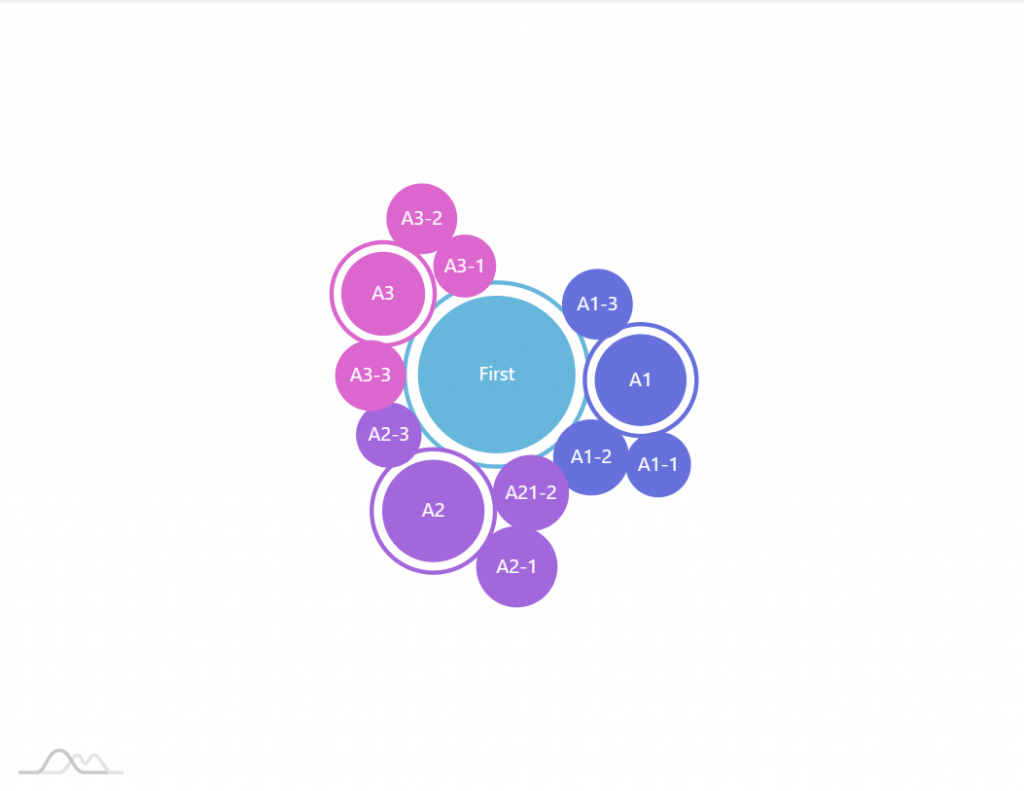
If we rather want it to start with all nodes beyond certain level collapsed, we can use series' maxLevels setting.
The following code will ensure that only the top and second level nodes are show:
series.maxLevels = 2;
series.maxLevels = 2;
{
  // ...
  "series": [{
    // ...
    "maxLevels": 2
  }]
}
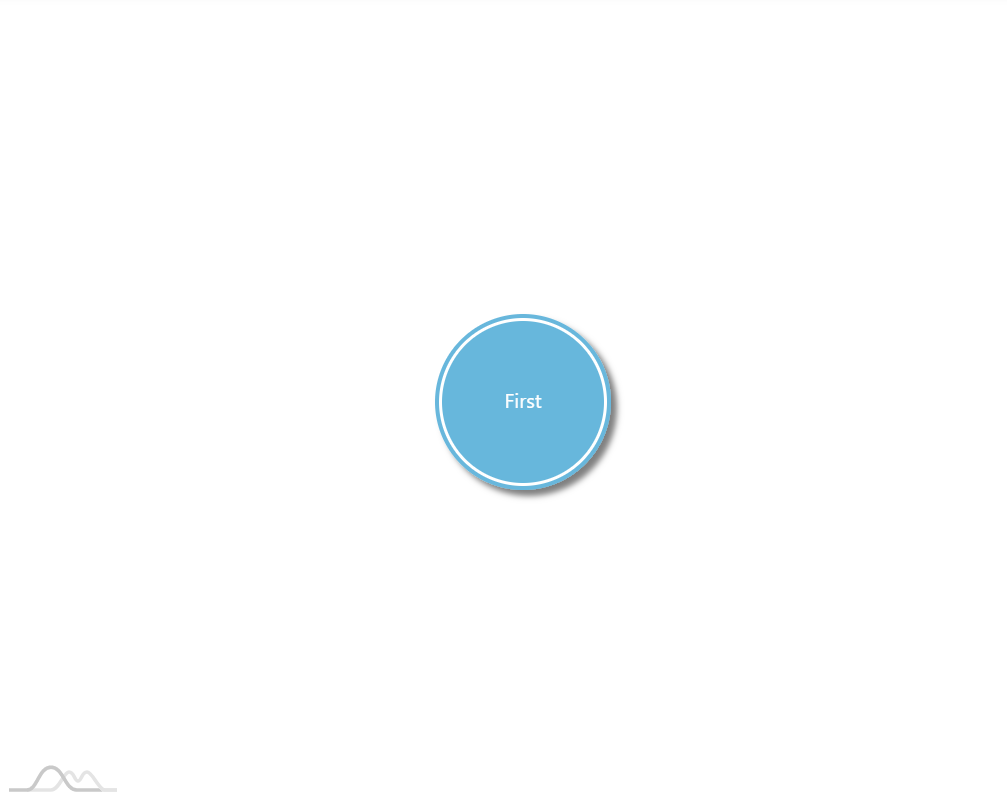
series.maxLevels = 1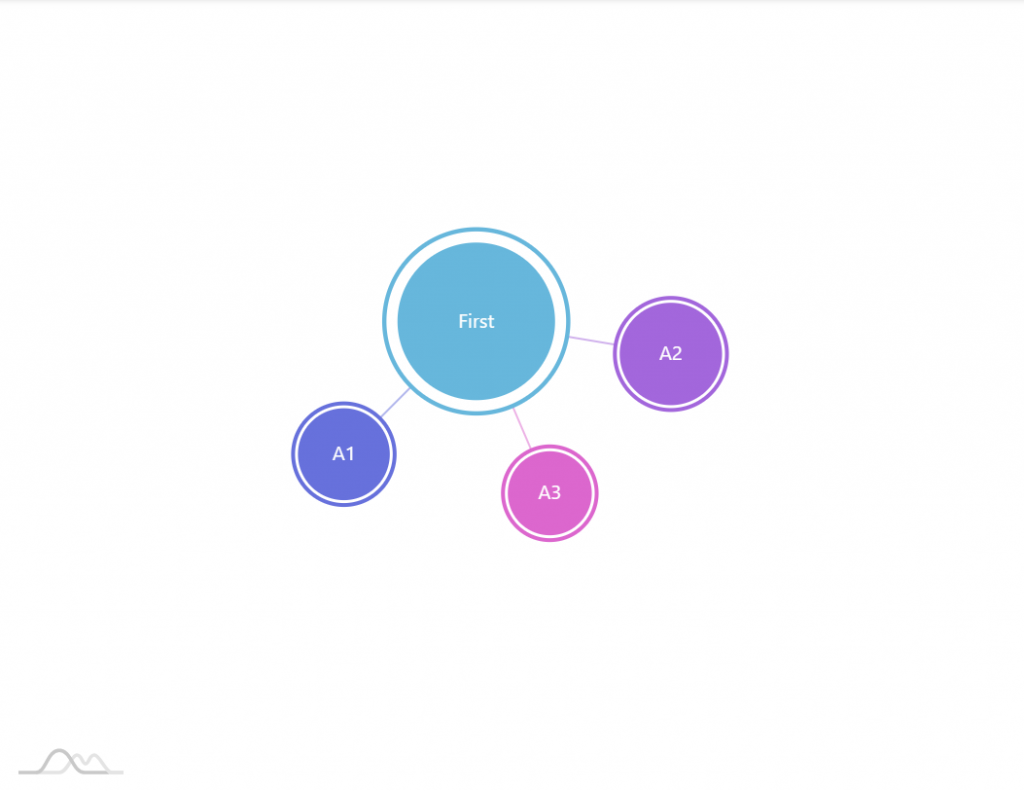
series.maxLevels = 2
series.maxLevels = 3
Set collapsed nodes via data
We can also individually set which nodes we want to start off collapsed.
For that we can use collapsed data field.
series.dataFields.collapsed = "off";
series.dataFields.collapsed = "off";
{
  // ...
  "series": [{
    // ...
    "dataFields": {
      // ...
      "collapsed": "off"
    }
  }]
}
Now, if the data for the specific node will contain off: true that nodes will be drawn pre-collapsed, regardless of any other settings.
Fixed nodes
Version 4.6.2 adds a concept of a fixed nodes.
A "fixed" node will be oblivious to all the forces of traction governing chart's nodes, and will stay in one place.
You can make them appear in the best spot chosen by chart, or explicitly specify their positions.
Specifying which nodes are fixed
You can specify which nodes are static via "fixed" data field, e.g.:
series.dataFields.fixed = "fixed";
series.dataFields.fixed = "fixed";
{
  // ...
  "series": [{
    // ...
    "dataFields": {
      // ...
      "fixed": "fixed"
    }
  }]
}
Setting fixed node position
The initial positions of such nodes can be set using property fields instead.
series.nodes.template.propertyFields.x = "x";
series.nodes.template.propertyFields.y = "y";
series.nodes.template.propertyFields.x = "x";
series.nodes.template.propertyFields.y = "y";
{
  // ...
  "series": [{
    // ...
    "nodes": {
      // ...
      "propertyFields": {
        "x": "x",
        "y": "y"
      }
    }
  }]
}
The values for x and y can be either absolute pixel coordinates, or relative Percent values.
Here's an example:
See the Pen Collapsible force-directed tree by amCharts team (@amcharts) on CodePen.
Links
Links are lines that separate nodes.
Just like we configured nodes by accessing nodes.template of the series, we can control every aspect of lines by accessing links.template.
The template is an object of type ForceDirectedLink. Let's see what we can do with it.
Link appearance
We can set a number of appearance settings that changes how the link lines look, starting from opacity, and ending with custom filters.
For example, let's try changing line thickness and opacity:
series.links.template.strokeWidth = 5;
series.links.template.strokeOpacity = 1;
series.links.template.strokeWidth = 5;
series.links.template.strokeOpacity = 1;
{
  // ...
  "series": [{
    // ...
    "links": {
      "strokeWidth": 5,
      "strokeOpacity": 1
    }
  }]
}
strokeWidth = 1
strokeOpacity = 1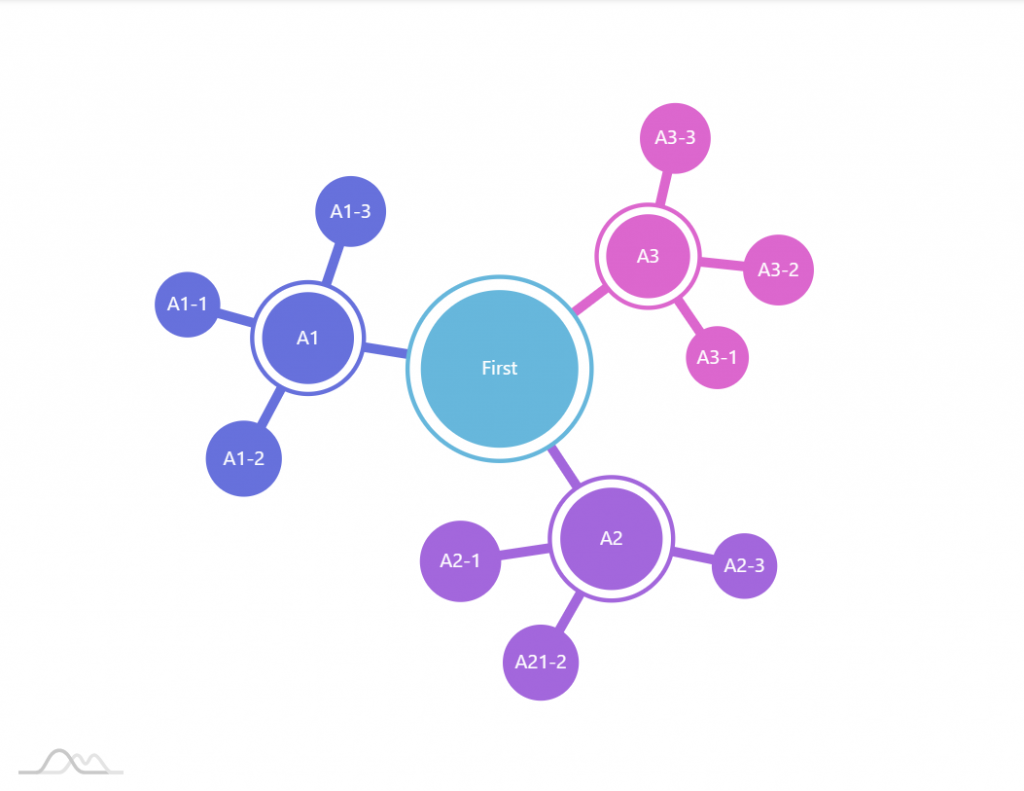
strokeWidth = 5
strokeOpacity = 1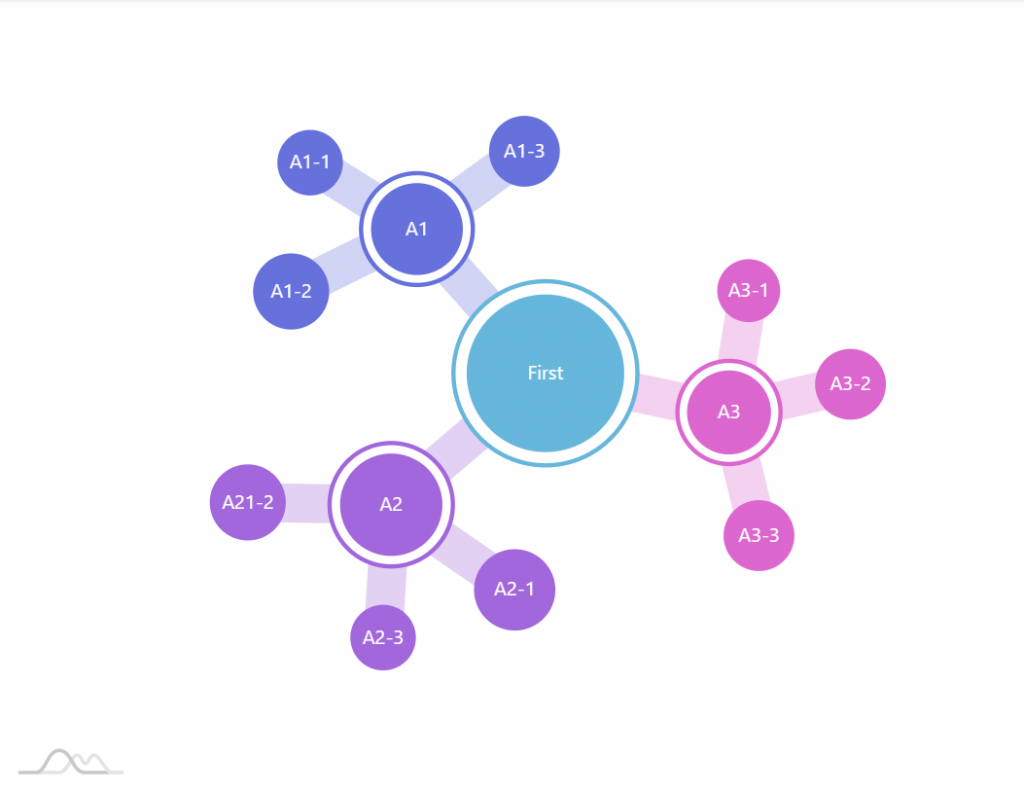
strokeWidth = 20
strokeOpacity = 0.3
Length
The distance between two nodes centers (link's length) is determined by its distance property.
It's a numeric value which is relative to the sum of radii of both source and target bubbles.
For example, if we have two linked nodes with bubbles of 20 and 10 pixels in radius, their collective radius is 30 pixels. With the default distance of 1.5, this would mean that distance between edges of two bubbles will be 15 pixels (30 * 1.5 - 30).
Should we set it to 1 (one), we'd have to bubbles touching each other.
series.links.template.distance = 2;
series.links.template.distance = 2;
{
  // ...
  "series": [{
    // ...
    "links": {
      "distance": 2
    }
  }]
}

distance = 1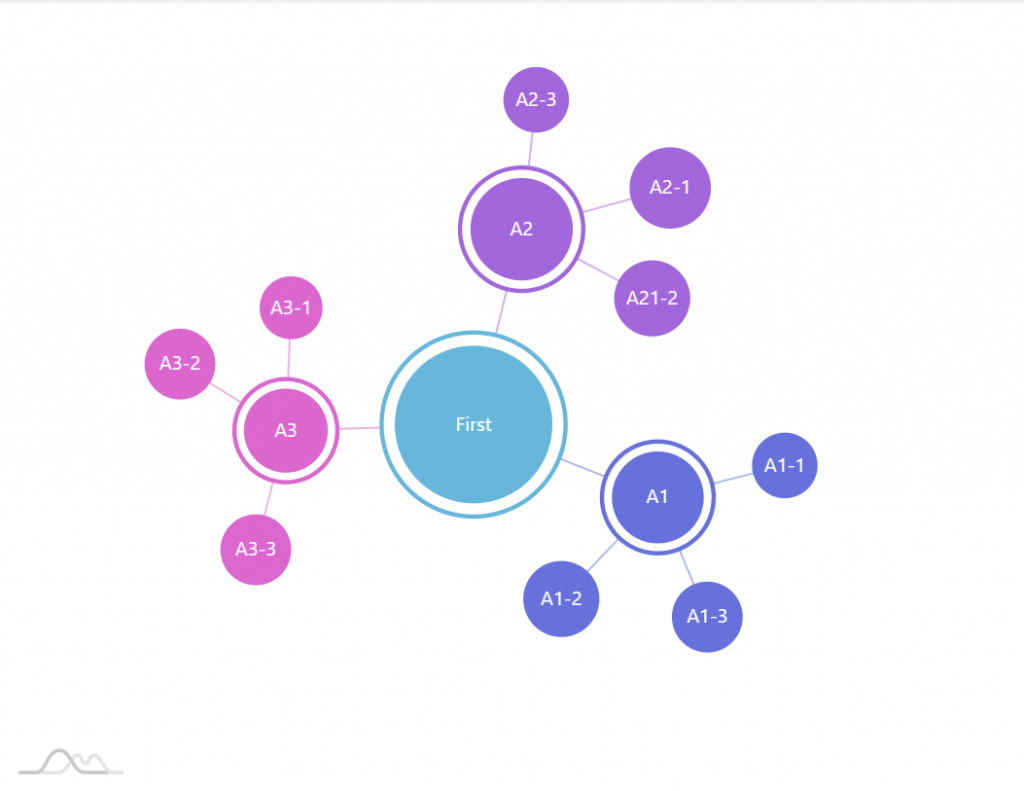
distance = 1.5(default)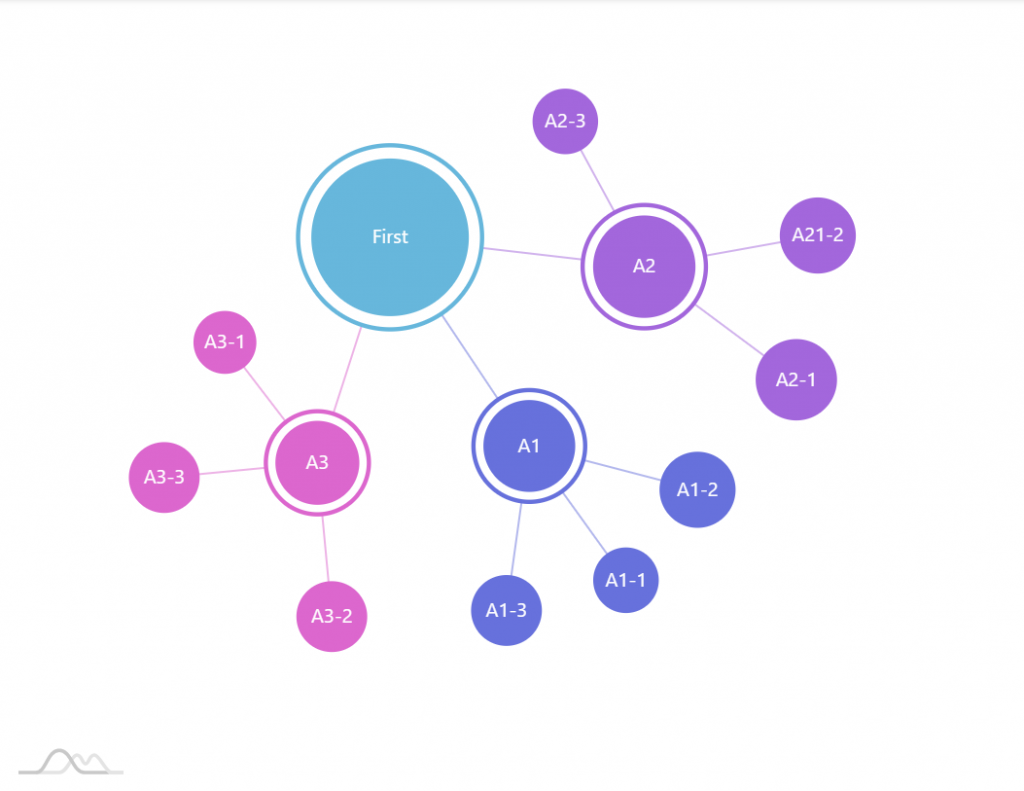
distance = 2
Disabling
Don't need links at all? Set link template's disabled = true:
series.links.template.disabled = true;
series.links.template.disabled = true;
{
  // ...
  "series": [{
    // ...
    "links": {
      "disabled": true
    }
  }]
}
Tooltips on links
Just like for nodes, Tooltips on links can be added by setting their template'stooltipText property, with one caveat.
Links are not designed to be interacted, so their interactivity is disabled. To re-enable them, we'll need to use interactionsEnabled property.
series.links.template.tooltipText = "{name}: [bold]{value}[/]";
series.links.template.interactionsEnabled = true;
series.links.template.tooltipText = "{name}: [bold]{value}[/]";
series.links.template.interactionsEnabled = true;
{
  // ...
  "series": [{
    // ...
    "links": {
      "tooltipText": "{name}: [bold]{value}[/]",
      "interactionsEnabled": true
    }
  }]
}
Physics & layout
Forces of attraction
There are certain set of powers of attraction and repulsion at play in Force Directed Tree, hence the name.
Each of those define how nodes lay out themselves, as well as how they act when they are dragged and when they collide with other nodes.
Some are controlled via settings from the series, some come from links.
Let's list them out.
| Setting | Default | Comment |
series.centerStrength | 1.2 | Relative strength with which all nodes are pulled towards center of the chart. Value range: -50 to 50. Positive value pulls, negative pushes away.The bigger this value the more packed together the chart will become. |
series.manyBodyStrength | -12 | Relative strength with which each node attracts (positive value) or pushes away (negative value) other nodes. Value range: -50 to 50.This strength diminishes when nodes are far away, and increases when they are close enough. |
series.links.template.strength | 2 | The strength of link. The bigger the value, the more "rigid" the link will be, and the more it will resist being stretched by other forces, such as center attraction and repulsion from other nodes. In more packed scenarios it makes sense to relax this setting a bit so that the tree has a bit of flexibility to arrange the nodes. |
It's important to understand that many of the above have "overlapping interests" and might work in utterly weird ways. Hitting the perfect combination might require a bit of trial and error.
Another thing to consider is link's distance setting. Forces get stronger when nodes are close, so the closer the "leash" the more prominent those forces will be.
To illustrate all this, let's take a series that has links set at 1. As we learned previously, this means no distance between nodes, so they should be close together.
However, there are other forces at play, such as one that each node attracts/pushes each other away, as regulated by manyBodyStrength. Provided this strength is set relatively high, and rigidity of the link (link's strength) is not maxed out, it will start stretching our zero-length links, making nodes pull away from each other.
series.manyBodyStrength = -50;
series.links.template.distance = 1;
series.links.template.strength = 1;
series.manyBodyStrength = -50;
series.links.template.distance = 1;
series.links.template.strength = 1;
{
  // ...
  "series": [{
    // ...
    "links": {
      "distance": 1,
      "strength": 1
    }
  }]
}
manyBodyStrength = -1.2(default)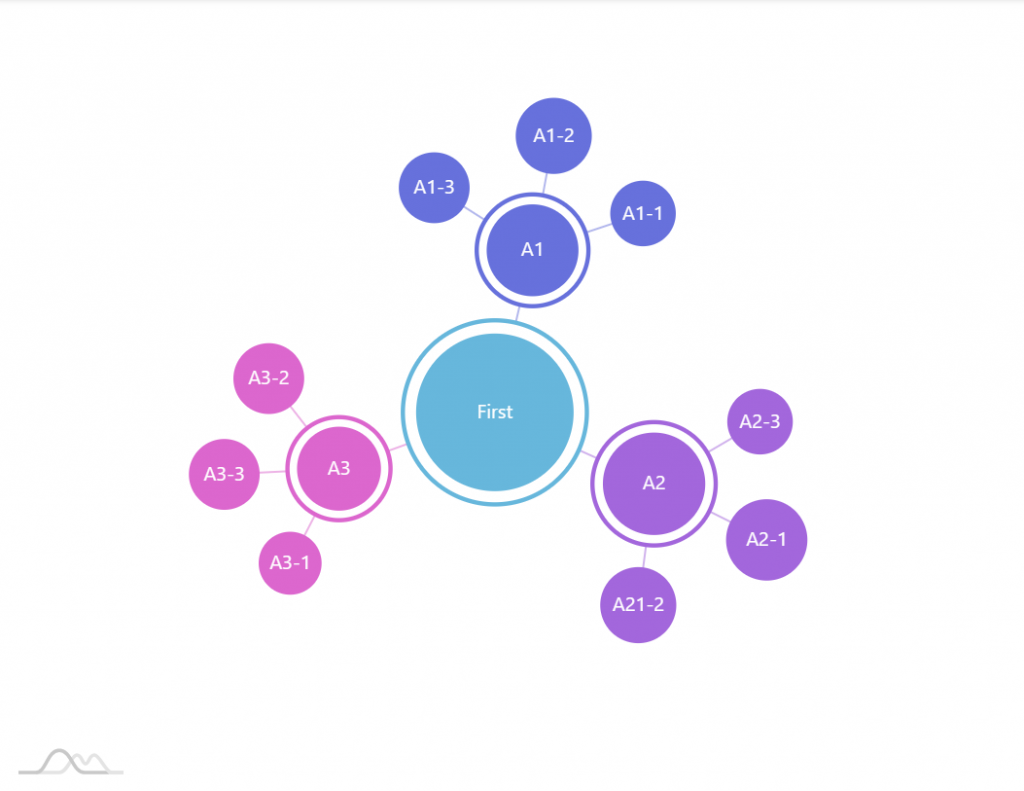
manyBodyStrength = -20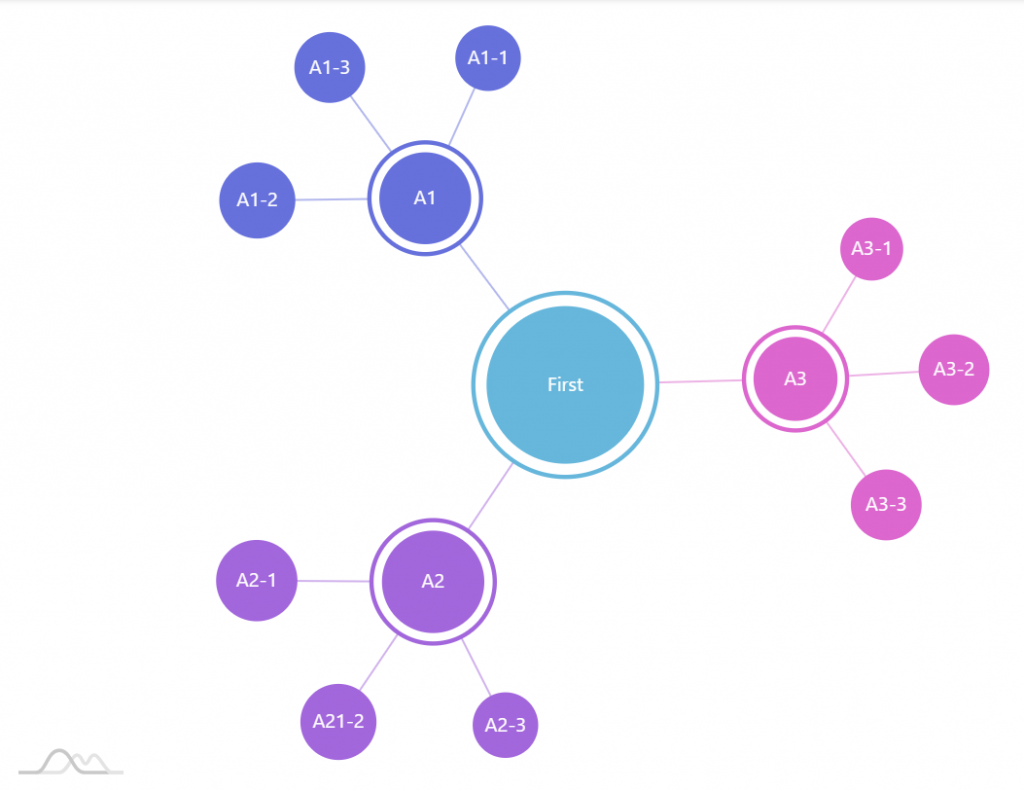
manyBodyStrength = -50
Layout
As if this wasn't mind bending enough, there's another fuzzy logic to consider: forces are modified slightly to work differently in horizontal and vertical directions.
This is because charts take different shapes, so this under-the-hood tweak is necessary to make the tree complement area of the chart better.
500pxx400px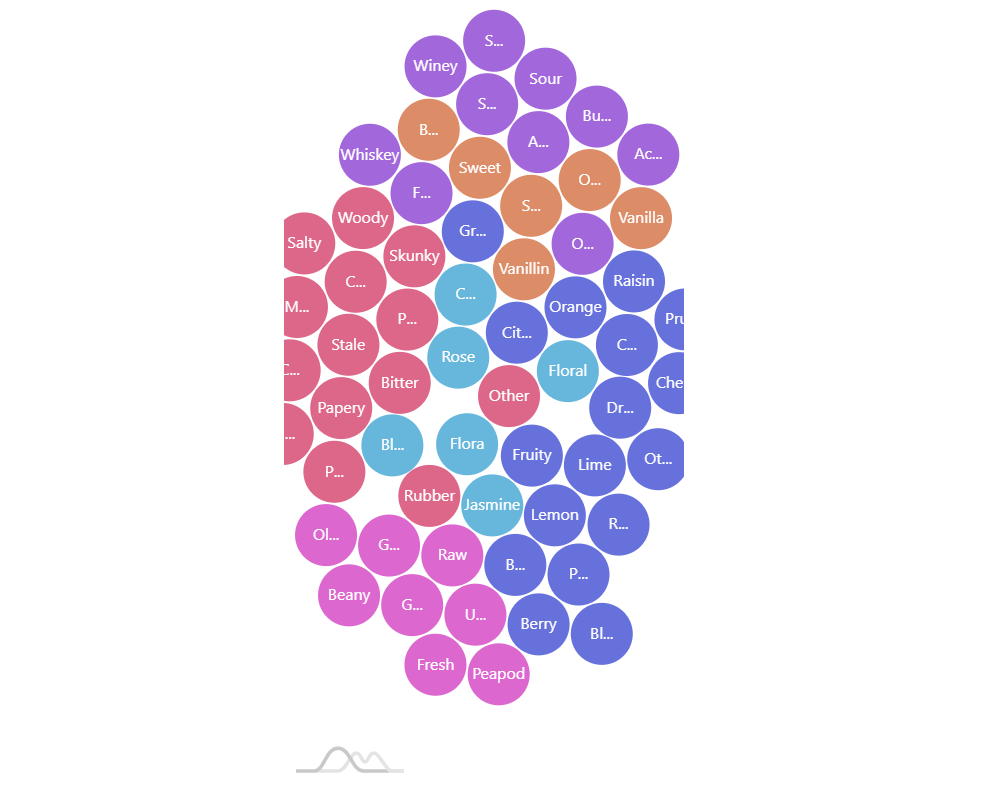
200pxx400px
500pxx200px
Friction and mobility
By default, nodes will do their best to avoid collision with each other, resulting in a very lively and dynamic chart.
It may sometimes be nice, but can become a bit chaotic, especially when there are a lot of nodes.
That's where ForceDirectedSeries setting velocityDecay comes into play.
Think of this setting as a "friction". The bigger the friction the more sluggish nodes will be in moving. Make velocityDecay big enough and they become so lazy, they won't even care if there are collisions with other nodes.
With 0 meaning fully mobile, and 1 fully static, it can be any value in-between.
Obviously, you would not do that straight away, before a chart has had a chance to pre-arrange its nodes when it loads.
The best way to do it is to gradually increase velocityDecay using custom animation:
networkSeries.events.on("inited", function() {
  networkSeries.animate({
    property: "velocityDecay",
    to: 1
  }, 3000);
});
networkSeries.events.on("inited", function() {
  networkSeries.animate({
    property: "velocityDecay",
    to: 1
  }, 3000);
});
{
  // ...
  "series": [{
    // ...
    "events": {
      "inited": function(ev) {
        ev.target.animate({
          property: "velocityDecay",
          to: 1
        }, 3000);
      }
    }
  }]
}
Here's a live example:
See the Pen amCharts 4: Using velocityDecay with ForceDirectedSeries by amCharts team (@amcharts) on CodePen.
Legend
Like many charts Force Directed Tree supports Legends. We add them just in any chart:
chart.legend = new am4charts.Legend();
chart.legend = new am4charts.Legend();
{
  // ...
  "legend: {
    "type": "Legend"
  }
}
Legend's behavior follows logic similar to color assignment. It contains items for the first level that has more than one node.
So, for example, if we have one top-level node and three its children, those three will comprise the legend.
If we have several nodes on top level, then those will be used as legend items instead.
Cross-linking
Nodes on a Force Directed Tree are not limited to linking with their parent and children. They can also link with each other.
To make that work, we will need three things:
- An
"id"data field: we'll need to id the nodes to link by. - A
"linkWith"data field: this will hold arrays of node ids to link with. - Fields in data identifying which nodes to link with.
Nodes can link with any other node provided target node's "id" is in source node's "linkWith" array.
Nodes can even cross level and branch boundaries, allowing us to create complex webs or network diagrams with non-hierarchical structure.
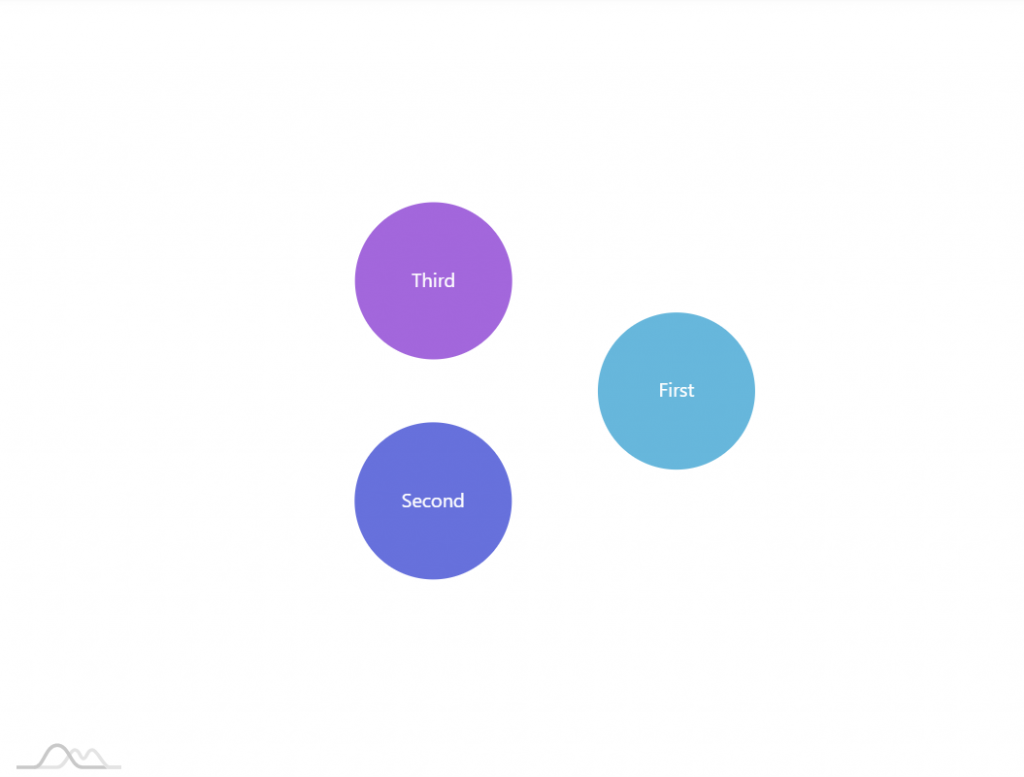
As a basic example, let's create a tree with three top-level nodes, interlinked with each other. The data for it could look like this:
[{
  "name": "First",
  "value": 1,
  "link": ["Second"]
}, {
  "name": "Second",
  "value": 1,
  "link": ["Third"]
}, {
  "name": "Third",
  "value": 1,
  "link": ["First"]
}]
If we run this now, we'll get three top-nodes, but they won't be linked:
We still need two remaining things: to tell which field in data has "link with" info, and which field is an "id".
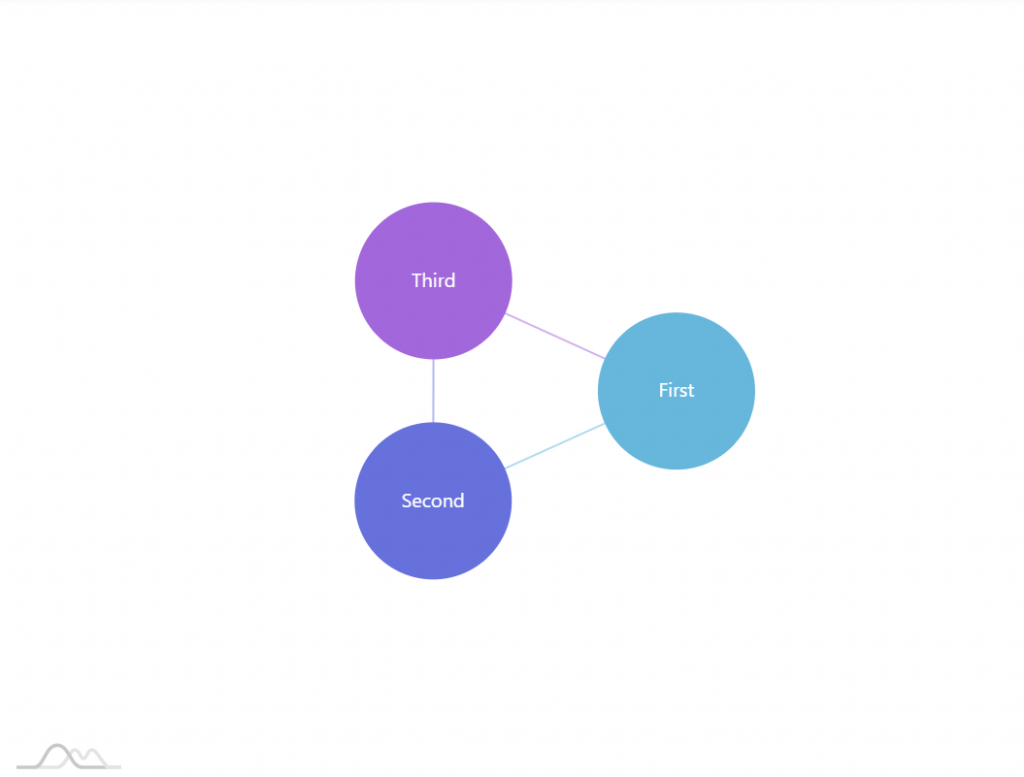
For the purpose of simplicity, since we know all of the names are unique, we'll use same field as name as an "id":
series.dataFields.id = "name";
series.dataFields.linkWith = "link";
series.dataFields.id = "name";
series.dataFields.linkWith = "link";
{
  // ...
  "series": [{
    // ...
    "dataFields": {
      // …
      "id": "name",
      "linkWidth": "link"
    }
  }]
}
Now, if we run our chart, it will display a nice cross-linked triangle:
Here's another example, with cross-linked nodes:
See the Pen amCharts 4: Force directed tree by amCharts team (@amcharts) on CodePen.
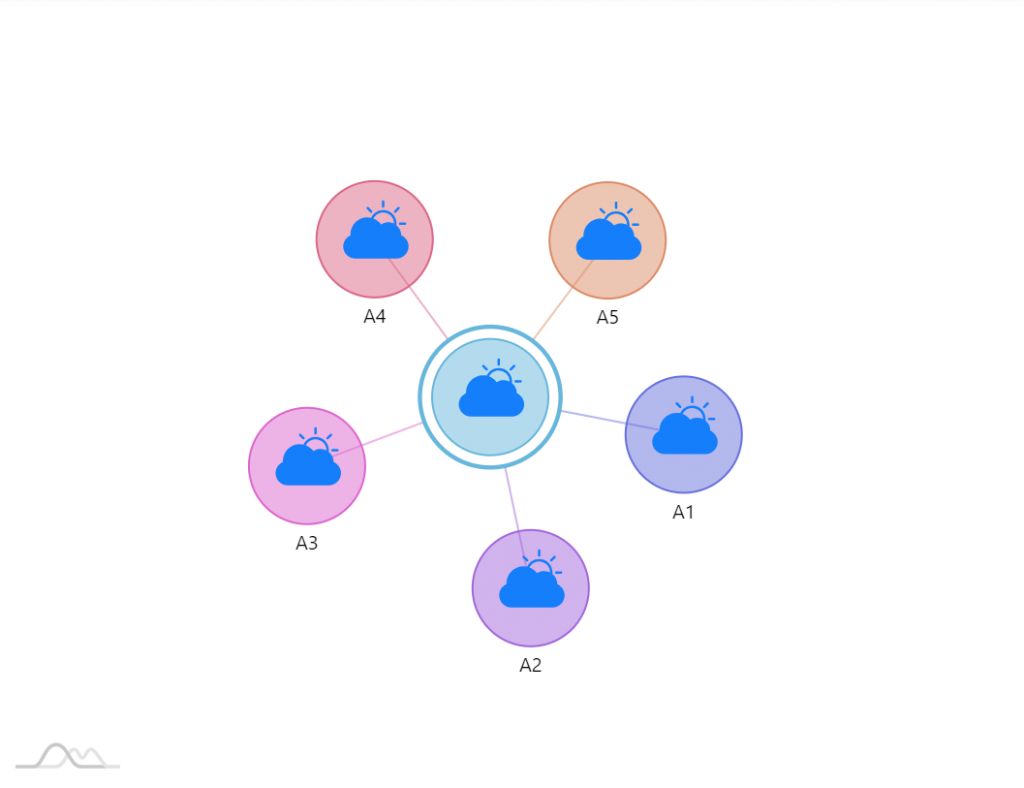
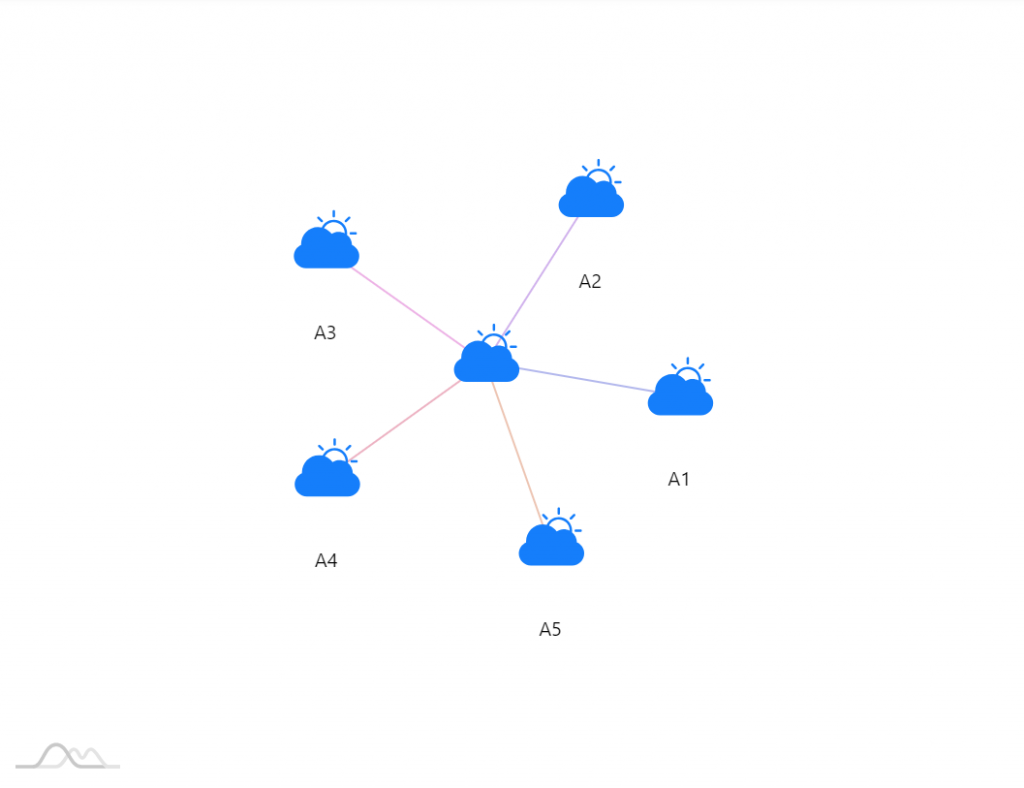
Nodes as images
When it comes to Force Directed Tree we're not limited to just bubbles. We can use virtually any image, shape, or just about any other type of element or even several elements as nodes.
Since node is a Container we can create any number and type of children in it.
Using external images
If we want our nodes to use a specific image (either bitmap or vector), we can create a child of type Image in node's template:
let icon = series.nodes.template.createChild(am4core.Image);
icon.href = "path/to/icon.svg";
icon.horizontalCenter = "middle";
icon.verticalCenter = "middle";
icon.width = 40;
icon.height = 40;
var icon = series.nodes.template.createChild(am4core.Image);
icon.href = "path/to/icon.svg";
icon.horizontalCenter = "middle";
icon.verticalCenter = "middle";
icon.width = 40;
icon.height = 40;
{
  // ...
  "series": [{
    // ...
    "nodes": {
      "children": [{
        "type": "Image",
        "href": "path/to/icon.svg",
        "horizontalCenter": "middle",
        "verticalCenter": "middle",
        "width": 40,
        "height": 40
      }]
    }
  }]
}
See the Pen amCharts 4: Force directed tree by amCharts team (@amcharts) on CodePen.
Disabling circles
If we are using custom images, we might not need the circles. The actual circle element is available via node template's circle property. The outer circle (for nodes with children) is accessible via outerCircle.
You can easily disable them:
series.nodes.template.circle.disabled = true;
series.nodes.template.outerCircle.disabled = true;
series.nodes.template.circle.disabled = true;
series.nodes.template.outerCircle.disabled = true;
{
  // ...
  "series": [{
    // ...
    "nodes": {
      // ...
      "circle": {
        "disabled": true
      },
      "outerCircle": {
        "disabled": true
      }
    }
  }]
}
Individual images
In previous chapter we used same icon for all nodes by setting Image element's href property directly.
If we wanted to use individual image for each node, we could employ "property fields" to bind href property to a field in data:
icon.propertyFields.href = "image";
icon.propertyFields.href = "image";
{
  // ...
  "series": [{
    // ...
    "nodes": {
      "children": [{
        "type": "Image",
        // ...
        "propertyFields": {
          "href": "image"
        }
      }]
    }
  }]
}
See the Pen amCharts 4: Force directed tree by amCharts team (@amcharts) on CodePen.
Using SVG paths
External images do the job, however they have one big disadvantage: they come with pre-set colors. The node's auto-assigned color does has no effect on them.
The solution is to use SVG paths instead. For example a computer icon looks like this: "M0 30l4-8h24l4 8zM4 2v18h24V2H4zm22 16H6V4h20v14z".
For it to work we exchange Image to a simple Sprite. Instead of href we will use its path property.
let icon = series.nodes.template.createChild(am4core.Sprite);
icon.propertyFields.path = "path";
icon.horizontalCenter = "middle";
icon.verticalCenter = "middle";
var icon = series.nodes.template.createChild(am4core.Sprite);
icon.propertyFields.path = "path";
icon.horizontalCenter = "middle";
icon.verticalCenter = "middle";
{
  // ...
  "series": [{
    // ...
    "nodes": {
      "children": [{
        "type": "Sprite",
        "horizontalCenter": "middle",
        "verticalCenter": "middle",
        "propertyFields": {
          "path": "path"
        }
      }]
    }
  }]
}
NOTE Sprite paths will not scale using width and height properties. Use scale property to resize icon relatively instead.
See the Pen amCharts 4: Force directed tree by amCharts team (@amcharts) on CodePen.
Zooming
Enabling zooming
Since version 4.10.0 it's possible to enable zooming of the ForceDirectedTree.
To enable it simply set zoomable = true.
chart.zoomable = true;
chart.zoomable = true;
{
  // ...
  "zoomable": true
}
That's it. Now the chart can be zoomed by mouse wheel / touch pinch gesture, and panned by dragging the mouse and touch.
Mouse-wheel zooming
If we don't want mouse-wheel zooming, we can disable it using other setting: mouseWheelBehavior (default "zoom") - simply set it to "none".
chart.zoomable = true;
chart.mouseWheelBehavior = "none;
chart.zoomable = true;
chart.mouseWheelBehavior = "none;
{
  // ...
  "zoomable": true,
  "mouseWheelBehavior": "none"
}
Zooming via API
For zooming via API there are two functions available:
zoomToPoint(point, level, center)- zooms to an X/Y coordinate.zoomToDataItem(dataItem, level, center)- zooms to specific data item (node).
E.g. if we want to zoom in on the node we just clicked we can do something like this:
networkSeries.nodes.template.events.on("hit", function(event) {
  chart.zoomToDataItem(event.target.dataItem, 3, true)
});
networkSeries.nodes.template.events.on("hit", function(event) {
  chart.zoomToDataItem(event.target.dataItem, 3, true)
});
{
  // ...
  "series": [{
    // ...
    "nodes": {
      // ...
      "events": {
        "hit": function(event) {
          var chart = event.target.baseSprite;
          chart.zoomToDataItem(event.target.dataItem, 3, true)
        }
      }
    }
  }]
}
Zooming example
See the Pen Zoomable Force-directed tree by amCharts team (@amcharts) on CodePen.
Examples
Simple tree
See the Pen amCharts 4: Force directed tree by amCharts team (@amcharts) on CodePen.
Expandable tree with legend
See the Pen amCharts 4: Force directed tree by amCharts team (@amcharts) on CodePen.
Network diagram
See the Pen amCharts 4: Force directed tree by amCharts team (@amcharts) on CodePen.
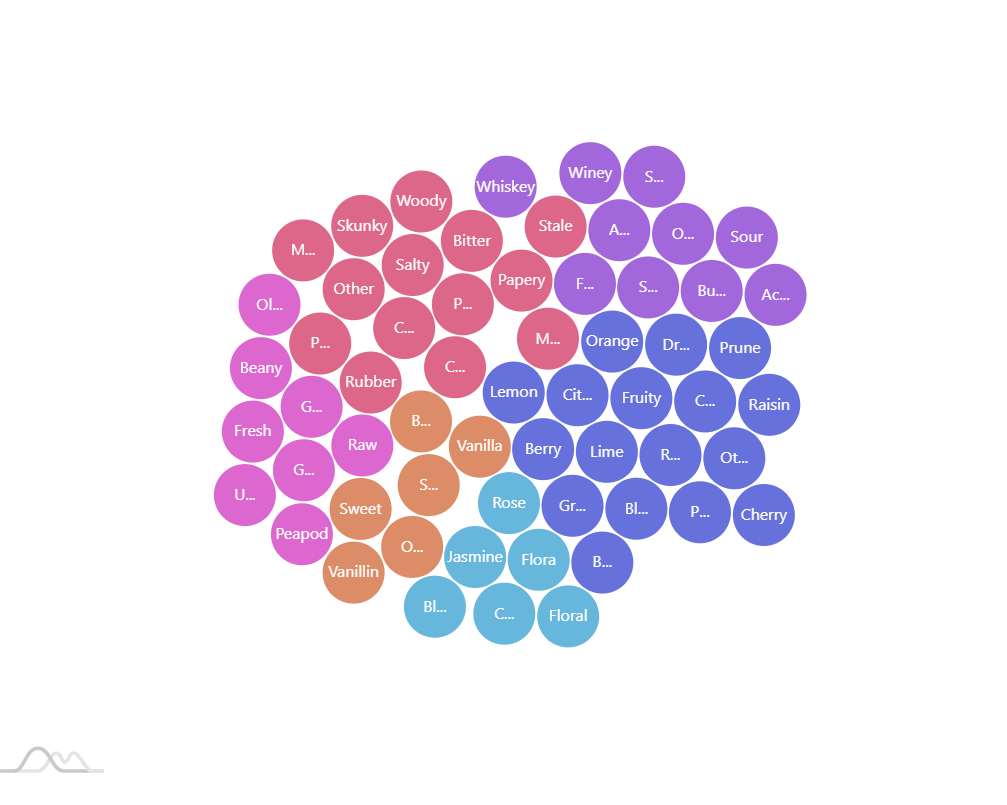
Packed circles
See the Pen amCharts 4: Force directed tree by amCharts team (@amcharts) on CodePen.
Related content
- Lighten fill color for each level of Force Directed Tree
- Variable link widths in ForceDirectedTree
- Toggling ForceDirectedNode via API
Also check all ForceDirectedTree-related tutorials.