Venn Diagrams are used to display scale of relationship between different items by showing a series of overlapping bubbles. The bigger overlapping area, the closer relation.
Creating a Venn Diagram
To create a Venn Diagram you will only need just three things:
- A chart instance.
- A series.
- Defined data fields.
- Data.
This is a minimum requirement for the chart. We'll go over each of those shortly.
Version info
Venn Diagram is available in amCharts 4 since version 4.9.0.
Importing modules/scripts
Needless to say, before you can use modules/objects, you need to make sure all required modules (in TypeScript), or files (in JavaScript) are imported. Please refer to our Getting started articles for more details:
Venn Diagram comes in a form of a plugin. To start using it we will need to include both core (main module) and charts modules, as well as venn plugin.
import * as am4core from "@amcharts/amcharts4/core";
import * as am4charts from "@amcharts/amcharts4/charts";
import * as am4plugins_venn from "@amcharts/amcharts4/plugins/venn";
<script src="//cdn.amcharts.com/lib/4/core.js"></script>
<script src="//cdn.amcharts.com/lib/4/charts.js"></script>
<script src="//cdn.amcharts.com/lib/4/plugins/venn.js"></script>
We'll be importing and referring these as am4core, am4charts, and am4plugins_venn in the course of this article, and overall in our demos and tutorials.
Creating chart instance
For that we're going to be using am4core.create() function. (or am4core.createFromConfig() if you are using JSON-based config approach)
let chart = am4core.create("chartdiv", am4plugins_venn.VennDiagram);
var chart = am4core.create("chartdiv", am4plugins_venn.VennDiagram);
var chart = am4core.createFromConfig({
  // ... chart config
}, "chartdiv", am4plugins_venn.VennDiagram);
Creating a series
As we mentioned earlier, the chart needs to have at least one series. It is created just like on any other serial chart: create a series object (in this case it's VennSeries) and push it to chart's series list:
let series = chart.series.push(new am4plugins_venn.VennSeries());
var series = chart.series.push(new am4plugins_venn.VennSeries());
{
  "series": [{
    "type": "VennSeries"
  }]
}
The data in Venn Diagram is always set to the series. We'll see how, in the next chapter.
Data
Data structure
Venn Diagram produces two types of elements - let's call them slices from now on:
- A category - an independent slice that may or may not intersect with other slices.
- An intersection - an intersection between two or more slices.
Each of those have values that determine size of the slice (if it's a category slice), or overlapping area between several category slices (if it's an intersection slice).
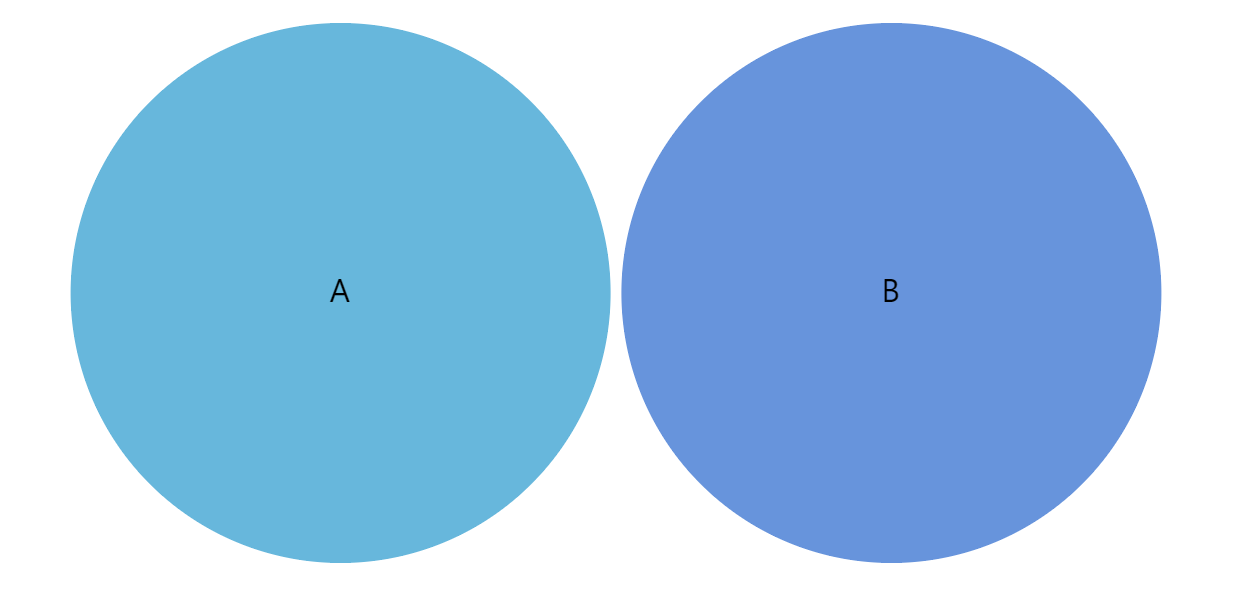
Below is the mos basic data structure representing two category slices:
[
  { "name": "A", "value": 10 },
  { "name": "B", "value": 10 }
]
The above data would produce two equal-width circles. No intersection.
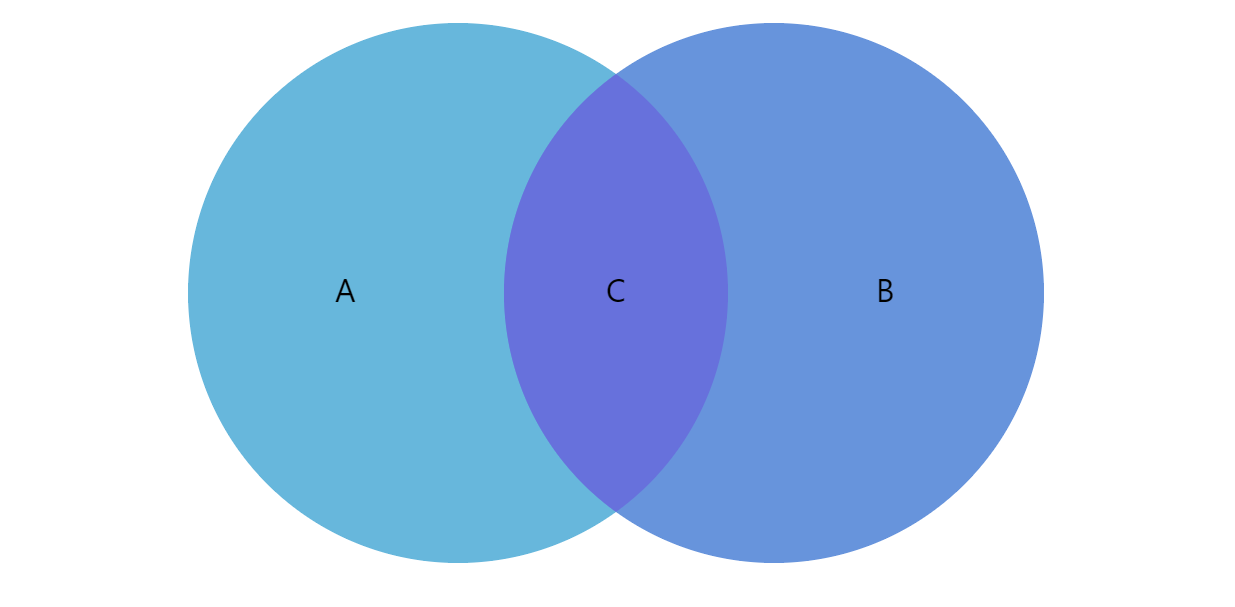
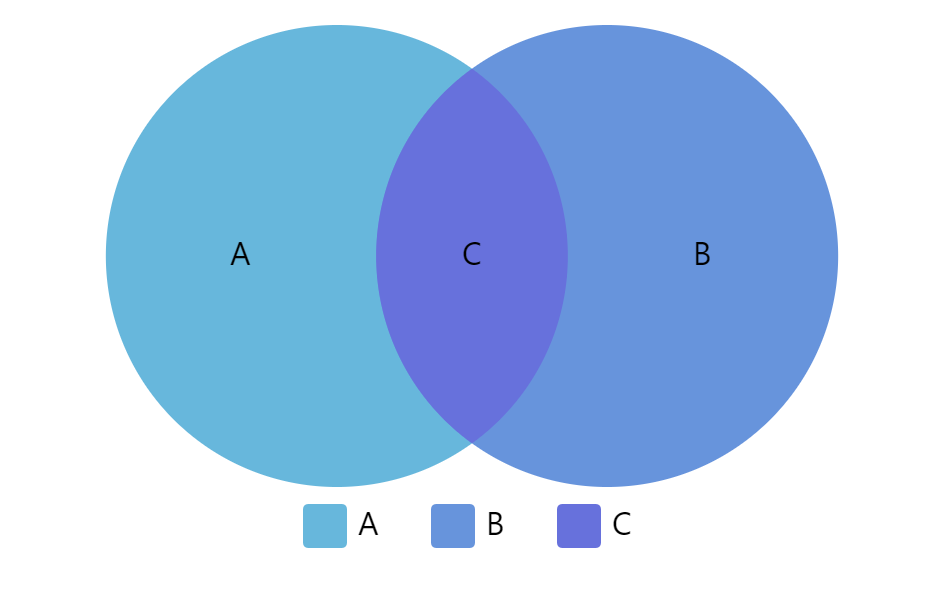
Now, let's introduce a third item - an intersection.
[
  { "name": "A", "value": 10 },
  { "name": "B", "value": 10 },
  { "name": "C", "value": 3, "set": [ "A", "B" ] }
]
As you can see the intersection item ("C") has a value of its own. It means how much (in relation to their original values) involved slices are overlapping.
It also has an additional data field (in this case named "set", but you can name it any way you want as we'll see in subsequent section on data fields). It indicates which category slices are involved in this intersection.
Let's see how this data change would affect our chart:
Naturally, data structure can get much more complicated than that. There can be multiple categories, with multiple various combinations of intersections between them.
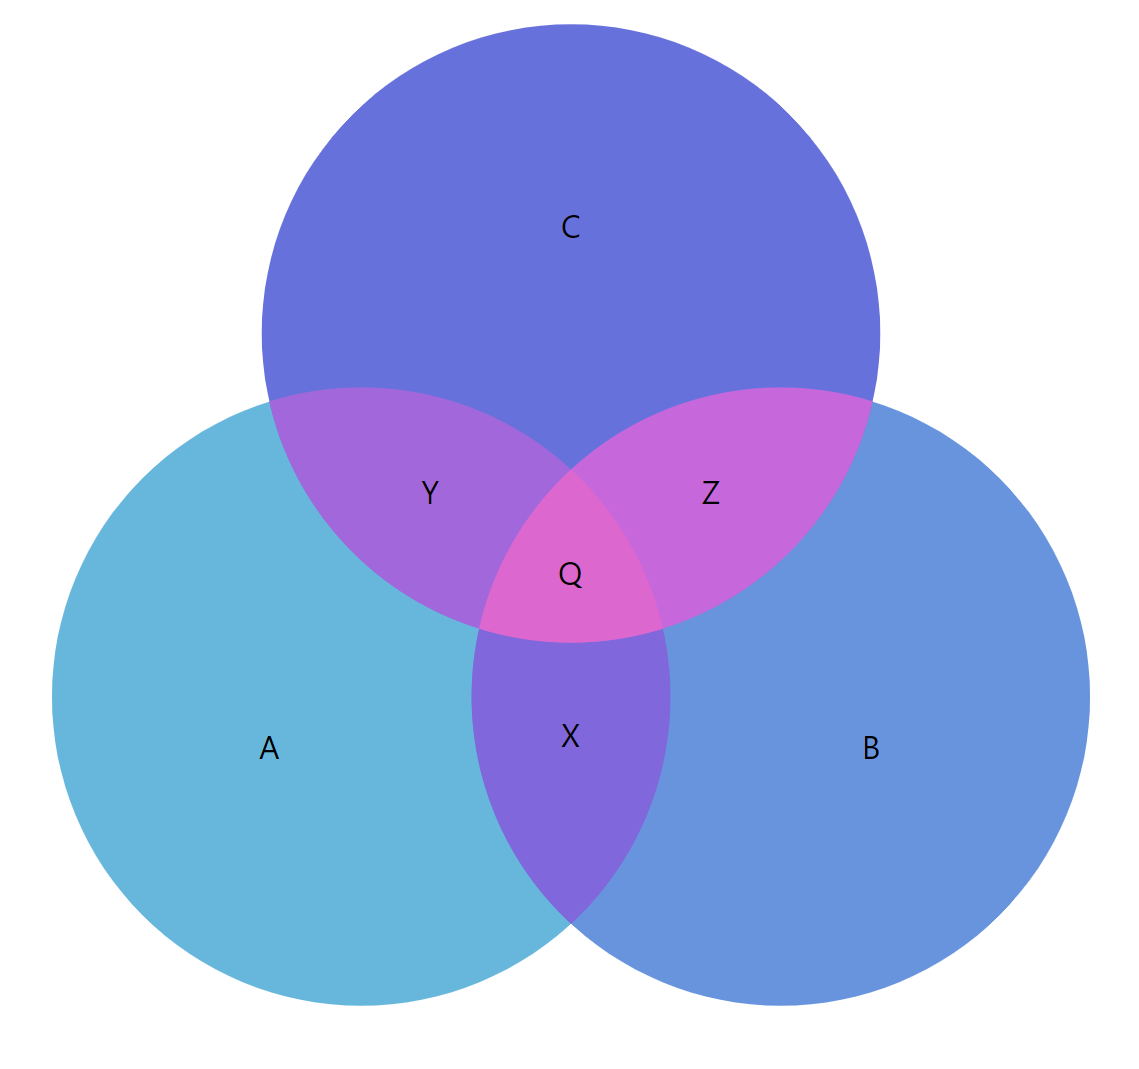
Here's a more complex example:
[
  { name: "A", value: 10 },
  { name: "B", value: 10 },
  { name: "C", value: 10 },
  { name: "X", value: 2, sets: ["A", "B"] },
  { name: "Y", value: 2, sets: ["A", "C"] },
  { name: "Z", value: 2, sets: ["B", "C"] },
  { name: "Q", value: 1, sets: ["A", "B", "C"] }
]
The above contains three category slices and four mixed intersections between them:
Setting in-line data
As we already mentioned briefly before, we assign the data to the series's data property:
series.data = [
  { "name": "A", "value": 10 },
  { "name": "B", "value": 10 },
  { "name": "C", "value": 3, "set": [ "A", "B" ] }
]
series.data = [
  { "name": "A", "value": 10 },
  { "name": "B", "value": 10 },
  { "name": "C", "value": 3, "set": [ "A", "B" ] }
]
{
  // ...
  "series": [{
    // ...
    "data": [
      { "name": "A", "value": 10 },
      { "name": "B", "value": 10 },
      { "name": "C", "value": 3, "set": [ "A", "B" ] }
    ]
  }]
}
Loading external data
We can also make the chart load external data using dataSource.
series.dataSource.url = "chart_data.json";
series.dataSource.url = "chart_data.json";
{
  // ...
  "series": [{
    // ...
    "dataSource": {
      "url": "chart_data.json"
    }
  }]
}
MORE INFO Please refer to our "External data" article, for more details.
Setting data fields
OK, so we mentioned "data fields" several times, already. Here's what they are.
Data fields are used to instruct the chart which fields in data hold specific information.
We specify data fields via series' dataFields property, which is basically a key-value object. The key is a specific structured field, like a value or a name, while value is a string key of a field in data to look for in each data item.
Venn Diagram charts support four types of data fields: (as defined by IVennSeriesDataFields).
| Data field | Type | Used for |
|---|---|---|
"category" | String | Name of the category. |
"id" | String | Item's unique ID. |
"intersections" | Array<String> | Category names this slice represents intersection of. |
"hidden" | Boolean | Should this slice be hidden when the chart starts? |
"hiddenInLegend" | Boolean | Should this item be omitted from legend? |
"value" | Number | Numeric value of the item. |
In order for Venn Diagram to function properly at least "category" and "value" data fields need to be set.
Here's how dataFields would look like for the sample data we had above:
series.dataFields.value = "value";
series.dataFields.name = "name";
series.dataFields.intersection = "sets";
series.dataFields.value = "value";
series.dataFields.name = "name";
series.dataFields.intersection = "sets";
{
  // ...
  "series": [{
    // ...
    "dataFields": {
      "value": "value",
      "category": "name",
      "intersections": "sets"
    }
  }]
}
And, we're done. Our chart is ready.
Complete example
// Create chart
let chart = am4core.create("chartdiv", am4plugins_venn.VennDiagram);

// Create and configure series
var series = chart.series.push(new am4plugins_venn.VennSeries())
series.dataFields.category = "name";
series.dataFields.value = "value";
series.dataFields.intersections = "sets";
series.data = [
  { name: "A", value: 10 },
  { name: "B", value: 10 },
  { name: "C", value: 3, sets: ["A", "B"] }
];
// Create chart
var chart = am4core.create("chartdiv", am4plugins_venn.VennDiagram);

// Create and configure series
var series = chart.series.push(new am4plugins_venn.VennSeries())
series.dataFields.category = "name";
series.dataFields.value = "value";
series.dataFields.intersections = "sets";
series.data = [
  { name: "A", value: 10 },
  { name: "B", value: 10 },
  { name: "C", value: 3, sets: ["A", "B"] }
];
var chart = am4core.createFromConfig({

  "series": [{
    "type": "VennSeries",

    "data": [
      { name: "A", value: 10 },
      { name: "B", value: 10 },
      { name: "C", value: 3, sets: ["A", "B"] }
    ],

    "dataFields": {
      "value": "value",
      "category": "name",
      "intersections": "sets"
    }
  }]

}, "chartdiv", am4plugins_vennd.VennDiagram);
See the Pen amCharts 4: Simple Venn Diagram by amCharts team (@amcharts) on CodePen.
Configuring appearance
Slices
Changing basic appearance properties
Slices in the diagram are configured according to a template which is available via series' slices.template property.
For example, if we would like to change opacity of the slices, we could do something like this:
series.slices.template.fillOpacity = 0.2;
series.slices.template.fillOpacity = 0.2;
{
  // ...
  "series": [{
    // ...
    "slices": {
      "fillOpacity": 0.2
    }
  }]
}
Slice colors
By default, each slice (even intersections) gets a new color from its series' colors list, which in turn is determined by theme used.
There are a number of ways change colors of those slices:
- Via data and "property fields".
- Modifying chart's
colors. - Using different theme.
Let's look at some of those.
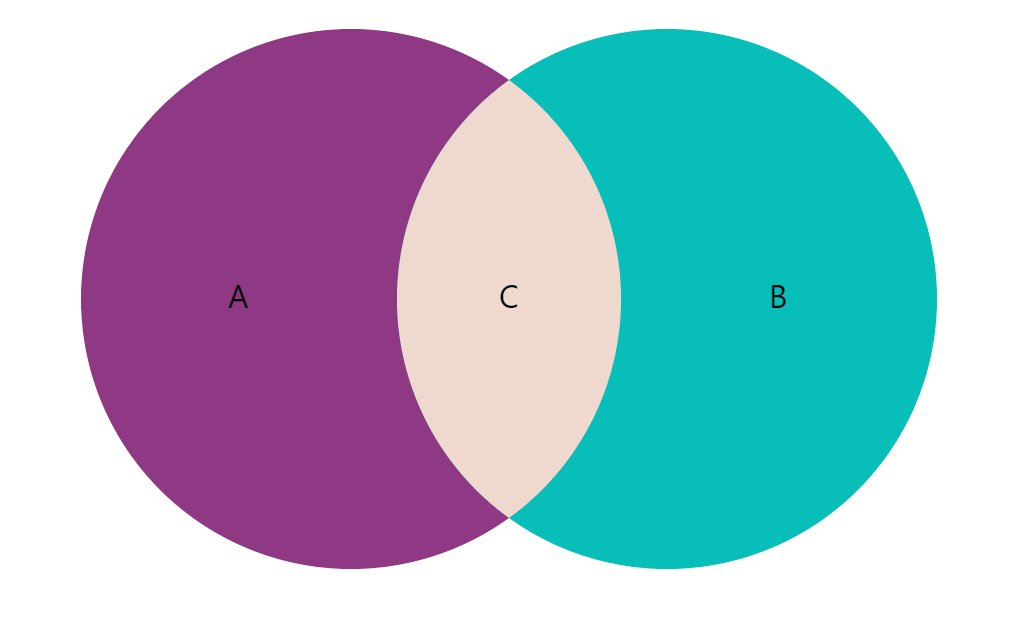
Modifying slice colors via data
series.data = [
  { "name": "A", "value": 10, "color": am4core.color("#8F3985") },
  { "name": "B", "value": 10, "color": am4core.color("#07BEB8") },
  { "name": "C", "value": 3 , "color": am4core.color("#EFD9CE"), "sets": ["A", "B"] }
];
series.slices.template.propertyFields.fill = "color";
series.data = [
  { "name": "A", "value": 10, "color": am4core.color("#8F3985") },
  { "name": "B", "value": 10, "color": am4core.color("#07BEB8") },
  { "name": "C", "value": 3, "color": am4core.color("#EFD9CE") , "sets": ["A", "B"] }
];
series.slices.template.propertyFields.fill = "color";
{
  // ...
  "series": [{
    // ...
    "data": [
      { "name": "A", "value": 10, "color": "#8F3985" },
      { "name": "B", "value": 10, "color": "#07BEB8" },
      { "name": "C", "value": 3 , "color": "#EFD9CE" , "sets": ["A", "B"] }
    ],
    "slices": {
      "propertyFields": {
        "fill": "color"
      }
    }
  }]
}
Modifying series color list
Each series has its pre-defined color list, accessible via its colors setting, which is a ColorSet object.
To modify the list of colors used, we can use its list property, which is basically an array of Color objects.
We can easily modify it:
series.colors.list = [
  am4core.color("#8F3985"),
  am4core.color("#07BEB8"),
  am4core.color("#EFD9CE")
];
series.colors.list = [
  am4core.color("#8F3985"),
  am4core.color("#07BEB8"),
  am4core.color("#EFD9CE")
];
{
  // ...
  "series": [{
    // ...
    "colors": {
      "list": [
        { "name": "A", "value": 10, "color": "#8F3985" },
        { "name": "B", "value": 10, "color": "#07BEB8" },
        { "name": "C", "value": 3 , "color": "#EFD9CE" , "sets": ["A", "B"] }
      ]
    }
  }]
}
Labels
By default, labels on each slice display its category name. Naturally, we can change both content, and appearance of the labels.
To do that we need to modify the template of the label, accessible via series.labels.template, which is an instance of Label.
Contents of the label
To change contents of the labels, we can access label template's text property:
series.labels.template.text = "{category}: [bold]{value}[/]";
series.labels.template.text = "{category}: [bold]{value}[/]";
{
  // ...
  "series": [{
    // ...
    "labels": {
      "text": "{category}: [bold]{value}[/]"
    }
  }]
}
We can even use in-line formatting syntax, as shown in the above example.
Label appearance
As we mentioned, the label template is an object of type Label, which means we can use all of it's properties to modify, how it looks.
Let's change the size and color as an excercise:
series.labels.template.fontSize = 25;
series.labels.template.fill = am4core.color("#fff");
series.labels.template.fontSize = 25;
series.labels.template.fill = am4core.color("#fff");
{
  // ...
  "series": [{
    // ...
    "labels": {
      "text": "{category}: [bold]{value}[/]",
      "fontSize": 25,
      "fill": "#fff"
    }
  }]
}
Tooltips
Tooltips on slices can be added just like to any other chart object: by setting node template'stooltipText property.
We can use curly bracket data placeholders here, too:
series.slices.template.tooltipText = "{category}: [bold]{value}[/]";
series.slices.template.tooltipText = "{category}: [bold]{value}[/]";
{
  // ...
  "series": [{
    // ...
    "slices": {
      "tooltipText": "{category}: [bold]{value}[/]"
    }
  }]
}
Legend
Like many chart types Venn Diagram supports Legends. We add them just in any chart:
chart.legend = new am4charts.Legend();
chart.legend = new am4charts.Legend();
{
  // ...
  "legend: {
    "type": "Legend"
  }
}
A legend will display an item for each slice in the data: both category and intersection slices.
Examples
Simple Venn Diagram
See the Pen amCharts 4: Simple Venn Diagram with Legend by amCharts team (@amcharts) on CodePen.
Venn Diagram with patterns
See the Pen amCharts 4: Simple Venn Diagram with patterns by amCharts team (@amcharts) on CodePen.
Complex multi-set diagram
See the Pen amCharts 4: Complex Venn Diagram by amCharts team (@amcharts) on CodePen.