amCharts can be used for mobile apps using Cordova and PhoneGap. We will be covering some tips how to get charts in your app using Cordova, but a similar work could be done using PhoneGap.
Environment setup
We are assuming you have some knowledge using Cordova or PhoneGap. We are also assuming you may have a favorite setup to create Cordova apps, but we decided to go with a setup that could be easier for most users and we are only using an Android app simulation running on your default browser. Feel free to use your own setup and skip the instructions below.
- Install NodeJS
- Install the Android SDK
- Install Visual Studio Code
- Install Ionic and Cordova Tools extension for Visual Studio Code
- Install Cordova
Creating the app
Open a terminal and choose a directory where you want your app to be. Create the app running the command below:
cordova create AmchartsExampleApp
Go the directory you created:
cd AmchartsExampleApp
Add browser and android as platforms:
cordova platform add browser
cordova platform add android
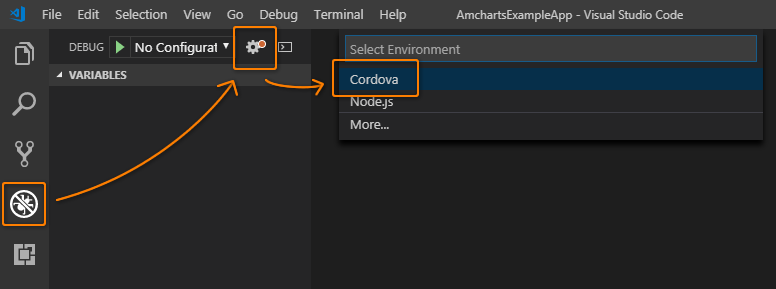
Open AmchartsExampleApp using Visual Studio Code and then add the debug configurations following the steps below. This will add the ./.vscode/launch.json file containing instructions to launch the app.
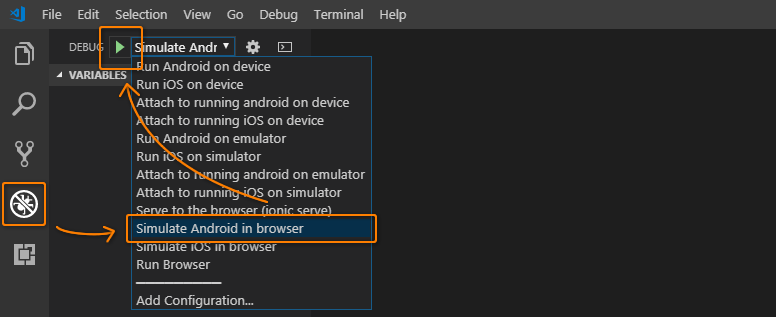
Run the app
At this point you can run the app as shown below. This is how we'll be running the app from now on.
Simplify the default Cordova files
The code in this tutorial removes code comments and license notices for the sake of making it easily readable. You still need to comply with Cordova's license requirements.
Let's simplify the default content in the app to make things clear moving foward. Replace the content in ./www/js/index.js for the code below.
var app = {

    initialize: function() {
        document.addEventListener('deviceready', this.onDeviceReady.bind(this), false);
    },

    onDeviceReady: function() {
        this.receivedEvent('deviceready');
    },

    receivedEvent: function(id) {
        console.log('Received Event: ' + id);
    }
};

app.initialize();
Replace the content in ./www/css/index.css for the code below:
body {
    -webkit-touch-callout: none;
    -webkit-text-size-adjust: none;
    -webkit-user-select: none;
    font-family: Helvetica, Arial, sans-serif;
    font-size: 14px;
    width: 100%;
    height: 100%;
    margin: 0;
    padding: 0;
    background-color: #EEE;
}
Replace the content in ./www/index.html for the code below:
<!DOCTYPE html>
<html>
    <head>
        <meta http-equiv="Content-Security-Policy" content="default-src 'self' data: gap: https://ssl.gstatic.com 'unsafe-eval'; style-src 'self' 'unsafe-inline'; media-src *; img-src 'self' data: content:;">
        <meta name="format-detection" content="telephone=no">
        <meta name="msapplication-tap-highlight" content="no">
        <meta name="viewport" content="user-scalable=no, initial-scale=1, maximum-scale=1, minimum-scale=1, width=device-width">
        <link rel="stylesheet" href="css/index.css">
        <title>amCharts Example</title>
    </head>
    <body>

        <script src="cordova.js"></script>
        <script src="js/index.js"></script>
    </body>
</html>
Now we have a clean code to start adding our examples.
Add amCharts files
- Create a directory called
amcharts4under./www/js/ - Download amCharts 4 files
- You can unzip everything, except the
/examplesdirectory, or justcore.js,chart.jsandthemes/kelly.jsinto./www/js/amcharts4 - Add amCharts reference into
index.html
<script src="js/amcharts4/core.js"></script>
<script src="js/amcharts4/charts.js"></script>
<script src="js/amcharts4/themes/animated.js"></script>
Adding CSS for the charts
We will be adding 3 charts on this tutorial. It's recommended to have defined dimensions for performance reasons and for smooth scrolling while the page may be still loading.
Add the 3 classes to the ./www/css/index.css file:
#pie-chart {
    width: 100%;
    height: 500px;
    background-color: #FFF;
    border-radius: 0.5em;
}

#line-chart {
    width: 100%;
    height: 500px;
    background-color: #FFF;
    border-radius: 0.5em;
}

#column-chart {
    width: 100%;
    height: 500px;
    background-color: #FFF;
    border-radius: 0.5em;
}
Adding HTML containers for the charts
Now we need to add the HTML elements where the charts will be rendered to. Please add the following into the body tag in your ./www/index.html file just before the script tags.
<h3>amCharts 4 Examples</h3>

<p>
    Please see below same basic charts for this example. It's recommended
    to start all charts inside Cordova's "deviceready".
</p>

<h4>Pie Chart</h4>

<p>
    Have defined dimensions for all charts. It helps to avoid the page
    jumping while loading.
</p>

<div id="pie-chart"></div>

<h4>Line Chart</h4>

<p>
    This chart should only show when in the viewport. That should is
    recommended for performance reason.
</p>

<div id="line-chart"></div>

<h4>Column Chart</h4>

<p>
    This is another basic chart that shows only when on viewport.
</p>

<div id="column-chart"></div>
Adding the first chart
Wrap the chart code into Cordova's "deviceready" event. This will allow the page to load related files and draw static HTML before starting to render the charts. This step will help the page JavaScript to not block the browsers while getting ready.
Add a file called pie.js to ./www/js/charts/ and copy the JavaScript below to it's content.
// Try to start all chart in the deviceready event
document.addEventListener("deviceready", function () {

    // Create chart instance
    var chart = am4core.create("pie-chart", am4charts.PieChart);

    // Add data
    chart.data = [{
        "country": "Lithuania",
        "litres": 501.9
    }, {
        "country": "Czech Republic",
        "litres": 301.9
    }, {
        "country": "Ireland",
        "litres": 201.1
    }, {
        "country": "Germany",
        "litres": 165.8
    }, {
        "country": "Australia",
        "litres": 139.9
    }];

    // Add and configure Series
    var pieSeries = chart.series.push(new am4charts.PieSeries());
    pieSeries.dataFields.value = "litres";
    pieSeries.dataFields.category = "country";

    // Disable ticks and labels
    pieSeries.labels.template.disabled = true;
    pieSeries.ticks.template.disabled = true;

    // Disable tooltips
    pieSeries.slices.template.tooltipText = "";

    // Add a legend
    chart.legend = new am4charts.Legend();

});
Now add the following script tag to your index.html just before the ending body tag.
<script src="js/charts/pie.js"></script>
Now try to run the app.
Render the chart when on viewport
We will be adding 2 other charts on this section and include a script to check when the chart is on the viewport. Please add the following script into a new file in ./www/js/viewport.js.
/**
 * DON'T USE THIS CODE IN PRODUCTION.
 *
 * This was meant just to be used in the demo with minimal code and testing.
 */
(function () {

    var items = [],
        timeout,
        handler = function (e) {

            clearTimeout(timeout);

            // Delay the checks
            timeout = setTimeout(function () {

                var html = document.documentElement,
                    clientHeight = html.clientHeight,
                    clientRect,
                    visibleHeight,
                    index = items.length,
                    item;

                while (index--) {

                    item = items[index];
                    clientRect = item.element.getBoundingClientRect();
                    visibleHeight = (clientRect.height - 20);

                    if (clientRect.top >= visibleHeight * -1 && clientRect.bottom <= clientHeight + visibleHeight) {

                        item.callback(e);

                        // Remove the element from the list of items as the callback is already
                        // executed
                        items.splice(index, 1);
                    }

                }

                // Unbind the events if there nothing to watch for
                if (!items.length) {

                    window.removeEventListener("resize", handler, false);
                    window.removeEventListener("scroll", handler, false);
                }

            }, 500);
        };

    window.viewPortAction = {

        /**
         * Add elements to be checked when available on the viewport. Also add
         * callback to be executed when the element is on teh viewport.
         *
         * @method add
         * @param {Element} element The HTML element to be checked
         * @param {Function} callback The function to be executed when on viewport
         */
        add: function (element, callback) {

            // Only bind the events when there is something to check
            if (!items.length) {

                window.addEventListener("resize", handler, false);
                window.addEventListener("scroll", handler, false);
            }

            items.push({
                element: element,
                callback: callback
            });

            // Call the handler right away to check it the element is already in the
            // viewport
            handler();
        }
    };

})();
Now add a column chart with the script in a new file created on the path ./www/js/charts/column.js.
// Try to start all chart in the deviceready event
document.addEventListener("deviceready", function () {

    viewPortAction.add(document.getElementById("column-chart"), function () {

        am4core.useTheme(am4themes_animated);

        var chart = am4core.create("column-chart", am4charts.XYChart);
        chart.hiddenState.properties.opacity = 0; // this makes initial fade in effect

        chart.data = [{
            "country": "USA",
            "visits": 3025
        }, {
            "country": "China",
            "visits": 1882
        }, {
            "country": "Japan",
            "visits": 1809
        }, {
            "country": "Germany",
            "visits": 1322
        }];

        chart.padding(40, 40, 40, 40);

        var categoryAxis = chart.xAxes.push(new am4charts.CategoryAxis());
        categoryAxis.renderer.grid.template.location = 0;
        categoryAxis.dataFields.category = "country";
        categoryAxis.renderer.minGridDistance = 20;
        categoryAxis.renderer.labels.template.rotation = 270;
        categoryAxis.renderer.labels.template.hideOversized = false;
        categoryAxis.renderer.labels.template.horizontalCenter = "right";
        categoryAxis.renderer.labels.template.verticalCenter = "middle";

        var valueAxis = chart.yAxes.push(new am4charts.ValueAxis());

        var series = chart.series.push(new am4charts.ColumnSeries());
        series.dataFields.categoryX = "country";
        series.dataFields.valueY = "visits";
        series.tooltipText = "{valueY.value}"
        series.columns.template.strokeOpacity = 0;

        chart.cursor = new am4charts.XYCursor();

        // as by default columns of the same series are of the same color, we add adapter which takes colors from chart.colors color set
        series.columns.template.adapter.add("fill", function (fill, target) {
            return chart.colors.getIndex(target.dataItem.index);
        });
    });
});
Now we will be adding a line chart at ./www/js/charts/line.js. Please copy the script below.
document.addEventListener("deviceready", function () {

    viewPortAction.add(document.getElementById("line-chart"), function () {

        am4core.useTheme(am4themes_animated);

        var chart = am4core.create("line-chart", am4charts.XYChart);
        chart.hiddenState.properties.opacity = 0; // this makes initial fade in effect

        chart.paddingRight = 20;

        var data = [];
        var visits = 10;
        for (var i = 1; i < 30; i++) {
            visits += Math.round((Math.random() < 0.5 ? 1 : -1) * Math.random() * 10);
            data.push({ date: new Date(2018, 0, i), value: visits });
        }

        chart.data = data;

        var dateAxis = chart.xAxes.push(new am4charts.DateAxis());
        dateAxis.renderer.grid.template.location = 0;
        dateAxis.renderer.axisFills.template.disabled = true;
        dateAxis.renderer.ticks.template.disabled = true;
        dateAxis.renderer.labels.template.rotation = 270;
        dateAxis.renderer.labels.template.hideOversized = false;
        dateAxis.renderer.labels.template.horizontalCenter = "right";
        dateAxis.renderer.labels.template.verticalCenter = "middle";

        var valueAxis = chart.yAxes.push(new am4charts.ValueAxis());
        valueAxis.tooltip.disabled = true;
        valueAxis.renderer.minWidth = 35;
        valueAxis.renderer.axisFills.template.disabled = true;
        valueAxis.renderer.ticks.template.disabled = true;

        var series = chart.series.push(new am4charts.LineSeries());
        series.dataFields.dateX = "date";
        series.dataFields.valueY = "value";

    });
});
Make a reference to these scripts in your HTML. This is how your HTML should look like when complete:
<!DOCTYPE html>
<html>
    <head>
        <meta http-equiv="Content-Security-Policy" content="default-src 'self' data: gap: https://ssl.gstatic.com 'unsafe-eval'; style-src 'self' 'unsafe-inline'; media-src *; img-src 'self' data: content:;">
        <meta name="format-detection" content="telephone=no">
        <meta name="msapplication-tap-highlight" content="no">
        <meta name="viewport" content="user-scalable=no, initial-scale=1, maximum-scale=1, minimum-scale=1, width=device-width">
        <link rel="stylesheet" href="css/index.css">
        <title>amCharts Example</title>
    </head>
    <body>

        <h3>amCharts 4 Examples</h3>

        <p>
            Please see below same basic charts for this example. It's recommended to start
            all charts inside Cordova's "deviceready".
        </p>

        <h4>Pie Chart</h4>

        <p>
            Have defined dimensions for all charts. It helps to avoid the page jumping
            while loading.
        </p>

        <div id="pie-chart"></div>

        <h4>Line Chart</h4>

        <p>
            This chart should only show when in the viewport. That should is recommended
            for performance reason.
        </p>

        <div id="line-chart"></div>

        <h4>Column Chart</h4>

        <p>
            This is another basic chart that shows only when on viewport.
        </p>

        <div id="column-chart"></div>

        <!-- Cordova files -->
        <script src="cordova.js"></script>
        <script src="js/index.js"></script>

        <!-- amCharts files -->
        <script src="js/amcharts4/core.js"></script>
        <script src="js/amcharts4/charts.js"></script>
        <script src="js/amcharts4/themes/animated.js"></script>

        <!-- Viewport file -->
        <script src="js/viewport.js"></script>

        <!-- Charts files -->
        <script src="js/charts/pie.js"></script>
        <script src="js/charts/line.js"></script>
        <script src="js/charts/column.js"></script>
    </body>
</html>
At last, run the app again and notice that the last two charts are rendered only when on the viewport. This could be an important step for better performance and overral experience.
Downlad the example
Download the example here and run npm i to load the dependencies.