amCharts 4 has exporting functionality built right into its core. It allows saving chart view or its data into various formats, like JPEG, PNG, PDF, XLSX, CSV, or JSON.
This article is dedicated on how to enable this functionality for chart users, as well as do deeper integrations using API.
Export menu
Enabling
Even though export functionality is built-in, the end-user controls - menu - are not enabled by default.
To enable it, you will need to assign an instance of ExportMenu to chart's exporting.menu property:
chart.exporting.menu = new am4core.ExportMenu();
chart.exporting.menu = new am4core.ExportMenu();
{
  // ...
  "exporting": {
    "menu": {
      // No need to specify `type`, since
      // there's only one type of `ExportMenu`
    }
  }
}
Let's take a very basic chart and see how it looks like:
See the Pen amCharts V4: Export (1) by amCharts (@amcharts) on CodePen.
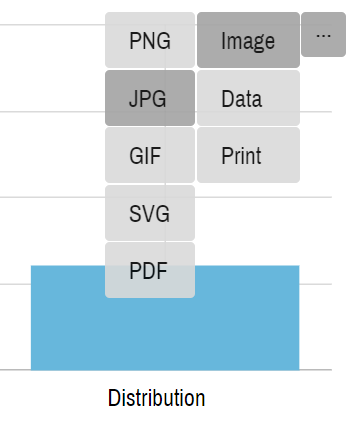
You can see a somewhat dimmed out button in the upper right corner, that when hovered will display export options for various image and data formats, as well as print.
If you want, you can leave it at it - it's fully functional.
Positioning
By default, menu is placed in the upper-right corner of your chart.
It's easy to re-position it using two of the menu's settings: align and verticalAlign.
align controls horizontal positioning and accepts following values: "left", "middle", and "right" (default).
verticalAlign controls vertical positioning of the legend with the following options for its value: "top" (default), "middle", and "bottom";
These settings will also affect how the menu looks like and opens up.
Let's see how it goes if we place it in the top-left corner using this code:
chart.exporting.menu = new am4core.ExportMenu();
chart.exporting.menu.align = "left";
chart.exporting.menu.verticalAlign = "top";
chart.exporting.menu = new am4core.ExportMenu();
chart.exporting.menu.align = "left";
chart.exporting.menu.verticalAlign = "top";
{
  // ...
  "exporting": {
    "menu": {
      "align": "left",
      "verticalAlign": "bottom"
    }
  }
}
See the Pen amCharts V4: Export (2) by amCharts (@amcharts) on CodePen.
Go ahead, hover on the export button to see how menu items have re-arranged themselves to accommodate for the new position.
NOTE You can also place your menu anywhere on the page. Check "Export menu in external container" for more details and an example.
Styling
A default styling to export menu is automatically applied by creating relative stylesheets on the web page. No additional configuration necessary.
However, if you'd like to modify certain style aspect of the menu, you easily override it using your own custom CSS.
Let's add a custom border around menu items as an example:
.amcharts-amexport-item {
  border: 2px solid #777;
}

.amcharts-amexport-top .amcharts-amexport-item > .amcharts-amexport-menu {
  top: -3px!important;
  left: 2px
}
See the Pen amCharts V4: Export (3) by amCharts (@amcharts) on CodePen.
NOTE To override certain default styles, you may need to use CSS' !important directive.
Or, if you'd like to style the whole menu yourself, you can easily disable built-in styling by setting menu's defaultStyles to false.
Modifying menu items
In case you'd like to modify which items are displayed in menu and what order they are displayed in, you can use menu's items.
It's an object resembling nested structure of the menu. Each item in the menu should conform to the IExportMenuItem interface.
Here's how default items looks like:
[
  {
    "label": "...",
    "menu": [
      {
        "label": "Image",
        "menu": [
          { "type": "png", "label": "PNG" },
          { "type": "jpg", "label": "JPG" },
          { "type": "svg", "label": "SVG" },
          { "type": "pdf", "label": "PDF" }
        ]
      }, {
        "label": "Data",
        "menu": [
          { "type": "json", "label": "JSON" },
          { "type": "csv", "label": "CSV" },
          { "type": "xlsx", "label": "XLSX" },
          { "type": "html", "label": "HTML" },
          { "type": "pdfdata", "label": "PDF" }
        ]
      }, {
        "label": "Print", "type": "print"
      }
    ]
  }
]
As you can see, each item contains label, which indicates what will be displayed in the menu.
If item contains sub-items, it also contains menu, which is an array of other menu items.
And finally, if this item is supposed to export stuff to some format, it will also have type property.
OK, so let's try to simplify our export menu to 1-level list, with just three options to export to PNG, save JSON data, and print:
chart.exporting.menu.items = [{
  "label": "...",
  "menu": [
    { "type": "png", "label": "PNG" },
    { "type": "json", "label": "JSON" },
    { "label": "Print", "type": "print" }
  ]
}];
chart.exporting.menu.items = [{
  "label": "...",
  "menu": [
    { "type": "png", "label": "PNG" },
    { "type": "json", "label": "JSON" },
    { "label": "Print", "type": "print" }
  ]
}];
{
  // ...
  "exporting": {
    "menu": {
      // ...
      "items": [{
        "label": "...",
        "menu": [
          { "type": "png", "label": "PNG" },
          { "type": "json", "label": "JSON" },
          { "label": "Print", "type": "print" }
        ]
      }]
    }
  }
}
Let's check if it worked:
See the Pen amCharts V4: Export (4) by amCharts (@amcharts) on CodePen.
Removing export formats
It is possible to remove certain formats from default menu by modifying disabled property in their format options:
chart.exporting.formatOptions.getKey("csv").disabled = true;
chart.exporting.formatOptions.getKey("csv").disabled = true;
{
  // ...
  "exporting": {
    // ...
    "formatOptions": {
      "csv": {
        "disabled": true
      }
    }
  }
}
Adding custom items
As we mentioned in previous chapters, all items for the Export menu are located in its items property, which is a multi-level object.
If we'd like to add a custom item, all we have to do is to push its definition in items.
For custom items in menu, we have to set their type to "custom", e.g.:
chart.exporting.menu.items[0].menu.push({
  label: "Hello",
  type: "custom"
});
chart.exporting.menu.items[0].menu.push({
  label: "Hello",
  type: "custom"
});
{
  // ...
  "exporting": {
    "menu": {
      // ...
      "callback": function(target) {
        chart.exporting.menu.items[0].menu.push({
          label: "Hello",
          type: "custom"
        });
      }
    }
  }
}
That will add the item with a label, but, in order for it do something, we also need to specify a callback function to be called on click. That is done with item's options:
chart.exporting.menu.items[0].menu.push({
  label: "Hello",
  type: "custom",
  options: {
    callback: function() {
      console.log("Hello back at ya!");
    }
  }
});
chart.exporting.menu.items[0].menu.push({
  label: "Hello",
  type: "custom",
  options: {
    callback: function() {
      console.log("Hello back at ya!");
    }
  }
});
{
  // ...
  "exporting": {
    "menu": {
      // ...
      "callback": function(target) {
        chart.exporting.menu.items[0].menu.push({
          label: "Hello",
          type: "custom",
          options: {
            callback: function() {
              console.log("Hello back at ya!");
            }
          }
        });
      }
    }
  }
}
See the Pen amCharts 4: Adding custom item to export menu by amCharts (@amcharts) on CodePen.
Export options
There are a few options you can set. For the complete list, check out Export class reference.
Let's take a short look at a few important ones.
| Property | Type | Default | Comment |
|---|---|---|---|
backgroundColor |
Color |
- | Export will try to determine what background your chart is on, whether it's set directly on a chart container, or comes from its parent containers, all the way to the body of the document.
If you'd rather have a specific color as a background, set TIP To make background transparent, set it to |
dataFields |
Object |
{} (empty object) |
When exporting data, columns/fields will be named as their respective keys in data.
|
dateFields |
List<string> |
(empty list) | Lists which fields in data are dates.
If set, those fields will be formatted accordingly when exporting in certain data formats. |
dateFormat |
string |
- | If set, this format will be used to format dates from dateFields. (more about date formatting)
If not set, chart's |
filePrefix |
string |
"amCharts" |
If you'd like exported files to have certain prefix, set it here.
E.g. setting to "myExport", will make export save files as "myExport.png", "myExport.json", etc. |
title |
string |
Chart title | When printing the chart, export will try to use chart's title as printed documents title.
If you'd like to use something else, set |
useRetina |
boolean |
true |
Sets whether images can be exported larger than they really are in order not to lose any detail. |
useWebFonts |
boolean |
true |
Sets whether export should attempt to load web font information so that charts are exported using them. |
Each of those settings are set on chart's Export object, accessible via exporting property, e.g.:
chart.exporting.filePrefix = "myExport";
chart.exporting.useWebFonts = false;
chart.exporting.filePrefix = "myExport";
chart.exporting.useWebFonts = false;
{
  // ...
  "exporting": {
    "filePrefix": "myExport",
    "useWebFonts": false
  }
}
Excluding elements from export
It's possible to exclude certain elements from exported images. In fact, some of the elements, like grip buttons of scrollbars and the zoom out button, are excluded by default.
To prevent an element from making into exported image, set its exportable setting to false.
Want to disable whole scrollbar from appearing in exports (not just its grips)?
chart.scrollbarX.exportable = false;
chart.scrollbarX.exportable = false;
{
  // ...
  "scrollbarX": {
    "type": "Scrollbar",
    "exportable": false
  }
}
Don't want series' tooltips in your images?
series.tooltip.exportable = false;
series.tooltip.exportable = false;
{
  // ...
  "series": [{
    // ...
    "tooltip": {
      "exportable": false
    }
  }]
}
You get the drift.
Including external elements
Since version 4.2.0 it is also possible to instruct Export to include external elements, like external legend, or even other charts together with the main chart export.
For that we now have extraSprites property on chart.exporting.
IMPORTANT Including extra elements into export will not work with SVG export.
Adding extra elements
extraSprites is an array, so the easy way is to to just push a reference to other objects we want included in the export there:
chart.exporting.extraSprites.push(chart2);
chart.exporting.extraSprites.push(chart2);
{
  // ...
  "exporting": {
    // ...
    "extraSprites": [
      chart2
    ]
  }
}
The above will make that whenever chart is exported, a snapshot of chart2 will also be included below it.
Fine-tuning placement
Simply adding instances into extraSprites will make them export stacked on top of each other. No margins.
If we'd like to control where and how extra elements are placed, we can add objects that correspond to IExportCanvas interface:
{
  marginTop: 0,
  marginRight: 0,
  marginBottom: 0,
  marginLeft: 0,
  position: "bottom", // "left" | "right" | "top" | "bottom";
  sprite: chart2;
}
All options in it are pretty self-explanatory. margin* properties control extra element's distance from other elements in any of the four directions.
position indicates where in relation to the main chart being exported element should be placed.
sprite is a reference to the external element.
Rewriting above example, we can do this:
chart.exporting.extraSprites.push({
  "marginLeft": 20,
  "position": "right",
  "sprite": chart2
});
chart.exporting.extraSprites.push({
  "marginLeft": 20,
  "position": "right",
  "sprite": chart2
});
{
  // ...
  "exporting": {
    // ...
    "extraSprites": [{
      "marginLeft": 20,
      "position": "right",
      "sprite": chart2
    }]
  }
}
The above will ensure that chart2 will be to the right of the main chart, offset by 20 pixels.
BEFORE YOU ASK No, you cannot include any HTML, or even SVG element. The extra element must be a valid amCharts 4 object because it relies on its own exporting instance.
For a live example check our "External legend" tutorial.
Format-specific options
Each export type has a set of options that affect how exported image looks, or how data is formatted.
Some examples of format-specific options: quality of the JPEG image, separator used in exported PDF, etc.
Getting current options
To get currently set (or default) options for the specific format, we can use Export's getFormatOptions(format) method.
For example the calling chart.exporting.getFormatOptions("jpg") will return the following options object:
{
  quality: 0.8
}
Setting options
To set options for the specific format we can use setFormatOptions(format, options) method.
The following code will modify quality setting for the JPEG exports:
let options = chart.exporting.getFormatOptions("jpg");
options.quality = 0.5;
chart.exporting.setFormatOptions("jpg", options);
var options = chart.exporting.getFormatOptions("jpg");
options.quality = 0.5;
chart.exporting.setFormatOptions("jpg", options);
Or, if I want PDF exports to not include "Saved from..." header:
let options = chart.exporting.getFormatOptions("pdf");
options.addURL = false;
chart.exporting.setFormatOptions("pdf", options);
var options = chart.exporting.getFormatOptions("pdf");
options.addURL = false;
chart.exporting.setFormatOptions("pdf", options);
It's also possible to set options by accessing the formatOptions directly:
chart.exporting.formatOptions.getKey("pdf").addURL = false;
chart.exporting.formatOptions.getKey("pdf").addURL = false;
{
  // ...
  "exporting": {
    // ...
    "formatOptions": {
      "pdf": {
        "addURL": false
      }
    }
  }
}
Options via menu
Format-specific options can be set via Export menu items as well.
We have looked at the configuration of menu earlier in this article. Besides listed menu item properties, you can also set options for the format, using options key:
chart.exporting.menu.items = [{
  "label": "...",
  "menu": [
    { "type": "png", "label": "PNG", "options": { "quality": 1 } },
    { "type": "json", "label": "JSON", "options": { "indent": 2, "useTimestamps": true } },
    { "label": "Print", "type": "print" }
  ]
}];
chart.exporting.menu.items = [{
  "label": "...",
  "menu": [
    { "type": "png", "label": "PNG", "options": { "quality": 1 } },
    { "type": "json", "label": "JSON", "options": { "indent": 2, "useTimestamps": true } },
    { "label": "Print", "type": "print" }
  ]
}];
{
  // ...
  "exporting": {
    "menu": {
      // ...
      "items": [{
        "label": "...",
        "menu": [
          { "type": "png", "label": "PNG", "options": { "quality": 1 } },
          { "type": "json", "label": "JSON", "options": { "indent": 2, "useTimestamps": true } },
          { "label": "Print", "type": "print" }
        ]
      }]
    }
  }
}
List of options
Available options for each format are defined by format-specific interfaces.
Below is a list of formats linked to their options interface.
| Interface | Format | Comment |
|---|---|---|
IExportImageOptions |
"jpg", "png", "gif" |
All bitmap images. |
IExportSVGOptions |
"svg" |
SVG images. |
IExportPDFOptions |
"pdf", "pdfdata" |
PDF documents. |
IExportCSVOptions |
"csv" |
Exported data in CSV format. |
IExportJSONOptions |
"json" |
Exported data in JSON format. |
IExportExcelOptions |
"xlsx" |
Exported data in Excel format. |
IExportHTMLOptions |
"html" |
Exported data in HTML format. |
IExportPrintOptions |
"print" |
Chart print. |
Scaling images
Normally, exported image will maintain exact same size as it is displayed on screen.
It might come out bigger than on screen if you have a non 1:1 pixel ratio screen, like Retina displays, unless you have useRetina set to false, but it will still be exact width and height in pixels, as it appears on screen.
There are ways to exported images to up- or down-scale relatively or to specific dimensions. Let's look at the options here.
All scaling options are set individually for each format, so you can have one export option for say PNG export, and another for PDF.
Relative scaling
To scale the image relatively to its original size, use format option scale.
It's a numeric value indicating multiples of the original scale. 1 will not scale the image. Smaller number than 1 will scale down the image, e.g. 0.5 will produce images twice as small as they appear on screen.
let options = chart.exporting.getFormatOptions("pdf");
options.scale = 2;
chart.exporting.setFormatOptions("pdf", options);
var options = chart.exporting.getFormatOptions("pdf");
options.scale = 2;
chart.exporting.setFormatOptions("pdf", options);
{
  // ...
  "exporting": {
    // ...
    "formatOptions": {
      "pdf": {
        "scale": 2
      }
    }
  }
}
The above code will ensure that images, used in PDF export are twice as big as they appear on screen. The PDF will still resize them to fit into page, but having a higher resolution picture will result in better quality of the document.
Dimension constraints
It's also possible to set minimum and maximum width/height of the exported image.
For that you can use format options minWidth/minHeight and maxWidth/maxHeight respectively.
These settings accept values in pixels.
let options = chart.exporting.getFormatOptions("pdf");
options.minWidth = 1000;
options.minHeight = 1000;
options.maxWidth = 2000;
options.maxHeight = 2000;
chart.exporting.setFormatOptions("pdf", options);
var options = chart.exporting.getFormatOptions("pdf");
options.minWidth = 1000;
options.minHeight = 1000;
options.maxWidth = 2000;
options.maxHeight = 2000;
chart.exporting.setFormatOptions("pdf", options);
{
  // ...
  "exporting": {
    // ...
    "formatOptions": {
      "pdf": {
        "minWidth": 1000,
        "minHeight": 1000,
        "maxWidth": 2000,
        "maxHeight": 2000
      }
    }
  }
}
The above will ensure that image, used for PDF, will be at least 1000x1000 px in size but will not exceed 2000x2000px.
If the image is smaller than min* settings, it will be scaled up. Similarly, if image is larger than max* values, it will be scaled down.
NOTE While scaling the image, it's original aspect ratio will be maintained using the most restrictive value, e.g. if original image is 100x50px, and we have 200x200 set as min* values, the resulting image will be 200x100px.
Using export API
So far we have been using Export menu. It's time to look into how you can tap into chart's export capabilities using the API.
Triggering export
Suppose we want to use some external controls or code to trigger export of the chart.
For that we can use exporting.export(type, config) method.
It's really really easy:
chart.exporting.export("png");
chart.exporting.export("png");
If I wanted I could pass in custom options for the particular format as a second parameter.
Here's an example that has HTML button that triggers custom export function:
See the Pen amCharts V4: Export (5) by amCharts (@amcharts) on CodePen.
Getting raw data
If, instead of initiating a download, you'd rather get image (or other format) data as a variable, for subsequent processing, AJAX-uploading to server, or something else, you can use one of the get* methods.
For example to get Base64-encoded PNG data, you'd do this:
let imgData = chart.exporting.getImage("png");
var imgData = chart.exporting.getImage("png");
As with export(), "get" functions can accept options as well.
But, wait, there's one caveat, though.
Image export operations are asynchronous, which means that the function fill finish before image data is generated, and will not return image data, but rather a "Promise".
NOTE Read this Mozilla article about concept of Promises.
In environments that support Promises like TypeScript, you could use full arsenal of Promise syntax, like the await directive:
let imgData = await chart.exporting.getImage("png");
console.log(imgData); // contains exported image data
For consistency with regular JavaScript, you can still use Promise then() callback:
chart.exporting.getImage("png").then(function(imgData) {
  console.log(imgData); // contains exported image data
});
Promises is a very powerful concept. You can combine and sync multiple asynchronous calls. You can cancel function operation. And much more.
Pivot data
Version 4.6.8 adds a useful option to CSV and XLSX data export: ability to pivot exported table.
Normally data is exported as rows: each data item in a new row, with columns being each key in data.
Pivoting data output would turn it "on its side", putting all data keys into first column, with values lined up to the right of it.
chart.exporting.getFormatOptions("csv").pivot = true;
chart.exporting.getFormatOptions("xlsx").pivot = true;
chart.exporting.getFormatOptions("csv").pivot = true;
chart.exporting.getFormatOptions("xlsx").pivot = true;
{
  // ...
  "exporting": {
    // ...
    "callback": function() {
      this.getFormatOptions("csv").pivot = true;
      this.getFormatOptions("xlsx").pivot = true;
    }
  }
}
If out chart has data like this:
[{
  "category": "Research",
  "value": 450,
  "value2": 150
}, {
  "category": "Marketing",
  "value": 1200
}, {
  "category": "Distribution",
  "value": 1850,
  "value2": 1150
}]
Depending on pivot setting, the data would look like this.
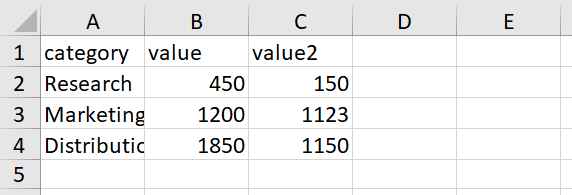
pivot = false (default)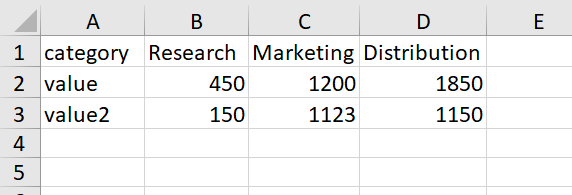
pivot = trueChanging order and names of columns
By default, the chart will export all available columns in data in the same order as they are defined.
We can change that using dataFields setting.
The value of this setting is an object, where keys define name of the fields in source data, whereas the value define column title.
Say we have data like this:
[{
  "category": "Research",
  "value": 450,
  "value2": 150
}, {
  "category": "Marketing",
  "value": 1200
}, {
  "category": "Distribution",
  "value": 1850,
  "value2": 1150
}]
If we export the data it will export "category", "value", and "value2" columns, in exact same order, with exact same names.
Say we want to Rename all columns, put "value" as a first column, and skip "value2" altogether. The following code will do the trick:
chart.exporting.dataFields = {
  "value": "Expenses",
  "category": "Category"
}
chart.exporting.dataFields = {
  "value": "Expenses",
  "category": "Category"
}
{
  // ...
  "exporting": {
    // ...
    "dataFields": {
      "value": "Expenses",
      "category": "Category"
    }
  }
}
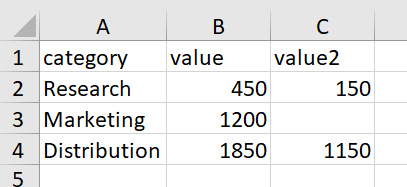
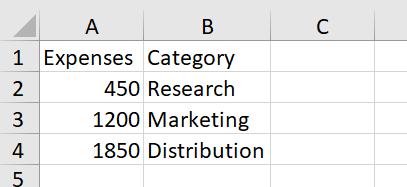
dataFields usedHere's a working example:
See the Pen amCharts 4: Changing order and names of columns of exported data by amCharts team (@amcharts) on CodePen.
Version 4.9.7 adds another way to change order of columns in exported data: dataFieldsOrder setting.
It allows specifying the order of exported columns without modifying their names. It's a simple array, you can assign field names to:
chart.exporting.dataFieldsOrder = [ "value", "category" ];
chart.exporting.dataFieldsOrder = [ "value", "category" ];
{
  // ...
  "exporting": {
    // ...
    "dataFieldsOrder": [ "value", "category" ]
  }
}
NOTE Differently than dataFields, including field names into dataFieldsOrder array would not limit export to just those fields. It will just specify order preference. If the field is not in the list, it will be added at the end.
Using adapters
Modifying exported data
It's easy to modify the data before it is exported using Export's "data" adapter.
An adapter is a custom function that contents of the particular property or value is passed through to make possible modifications.
Let's see how we can use one to add an additional column to exported data, one that is not in the source data.
chart.exporting.adapter.add("data", function(data) {
  for (var i = 0; i < data.data.length; i++) {
    data.data[i].number = "#" + (i + 1);
  }
  return data;
});
chart.exporting.adapter.add("data", function(data) {
  for (var i = 0; i < data.data.length; i++) {
    data.data[i].number = "#" + (i + 1);
  }
  return data;
});
{
  // ...
  "exporting": {
    "adapter": {
      "data": function(data) {
        for (var i = 0; i < data.data.length; i++) {
          data.data[i].number = "#" + (i + 1);
        }
        return data;
      }
    }
  }
}
Now, when we export data for our chart, it will contain a third column "number". Go ahead, try it out.
See the Pen amCharts 4: Modifying data before export by amCharts team (@amcharts) on CodePen.
As another example of using adapters with export, please check the "Combining local data from multiple series for export" demo.
PDF and non-Latin languages
Exporting PDF in amCharts 4 will use default bundled font for any textual information, like data and title.
The default font contains definitions for only Latin-based languages.
If you would like to export data/title in other languages, please refer to tutorial "Using PDF export fonts".
Common pitfalls
Tainted images
Due to browser's security restrictions, it won't allow exporting charts that have "tainted" images in it.
A "tainted" image is any asset that came from a different domain than the web page displaying the chart. For example, if you load an image bullet from a different domain, and use it on your chart, this would ruin the whole export operation.
For this reason, Export will try to proactively remove all such assets from the chart before trying to export it.
If you'd like to disable removal of tainted images, you can set keepTainted = true via format export options. E.g.:
let options = chart.exporting.getFormatOptions("jpg");
options.keepTainted = true;
chart.exporting.setFormatOptions("jpg", options);
var options = chart.exporting.getFormatOptions("jpg");
options.keepTainted = true;
chart.exporting.setFormatOptions("jpg", options);
Local files
Again, due to security measures, implemented in all modern browsers, export won't work when loaded locally, via file:///.
In order for export to work properly, the web page needs to be loaded via web server, even if it's http://localhost/....
Web fonts
Normally, the export will try to load and use web fonts when exporting the charts. This is done so that if your chart uses web fonts, such as Google Fonts, export looks as close to the original as possible.
However, some web font providers, prohibit such download. If yours does not allow dynamic download, the charts will be exported using default fonts.
On the other hand, if you know you don't use web fonts in charts, you might want to disable this feature to avoid unnecessary operations. To do that, simply set useWebFonts = false in chart.exporting.
Since version 4.10.17 you can also use export setting webFontFilter to filter only specific web font URLs to use. It's set to a regular expression. If it matches an URL of the font being used, it will be loaded. Otherwise it will be skipped by the loader:
chart.exporting.webFontFilter = /pacifico|roboto/;
chart.exporting.webFontFilter = /pacifico|roboto/;
{
  // ...
  "exporting": {
    // ...
    "webFontFilter": /pacifico|roboto/
  }
}