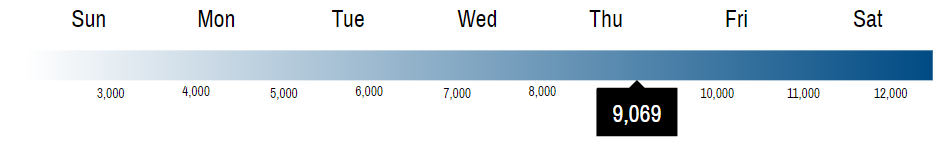
A Heat legend is used to depict a range of values and their corresponding color (heat).
Optionally, it can also indicate specific value's position with a tooltip.
It's not very useful on it's own, but is extremely informative and valuable for heat-map charts and maps.
Creating a heat legend
A chart by default does not have a property, or special place to put Heat legend in, like it does for a regular Legend.
Luckily, amCharts 4 has a helpful layouting engine, which allows adding various items to its containers, and have them magically arranged.
Each Container (a chart is a Container) has a method createChild(type). If we pass in an element's class definition, it takes care of the rest - creates an instance and adds it into container, re-arranging all other elements to accommodate the new chart inhabitant.
Heat legend's class is, predictably, HeatLegend.
To create a Heat legend, we'll need to do this:
let heatLegend = chart.createChild(am4charts.HeatLegend);
var heatLegend = chart.createChild(am4charts.HeatLegend);
{
  // ...
  "children": {
    "type": "HeatLegend",<br />    "forceCreate": true
  }
}
Configuring a heat legend
Before our Heat legend can become useful, we'll need to do a little bit of configuration.
At the very least, a Heat legend needs to know these things:
- The end colors of our spectrum, represented by
minColorandmaxColor; - The start and end values, represented by
minValueandmaxValuerespectively;
let heatLegend = chart.createChild(am4charts.HeatLegend);
heatLegend.minColor = am4core.color("#F5DBCB");
heatLegend.maxColor = am4core.color("#ED7B84");
heatLegend.minValue = 0;
heatLegend.maxValue = 2000;
var heatLegend = chart.createChild(am4charts.HeatLegend);
heatLegend.minColor = am4core.color("#F5DBCB");
heatLegend.maxColor = am4core.color("#ED7B84");
heatLegend.minValue = 0;
heatLegend.maxValue = 2000;
{
  // ...
  "children": {
    "type": "HeatLegend",<br />    "forceCreate": true,
    "minColor": "#F5DBCB",
    "maxColor": "#ED7B84",
    "minValue": 0,
    "maxValue": 2000
  }
}
Now, our Heat legend starts to become useful:
See the Pen amCharts V4: Heat legend (1) by amCharts (@amcharts) on CodePen.
RELATED INFO We used a demo from our Heat-map series information as a basis point. Please refer to the original article for more information on creating heat-maps.
Using heat legend with series
So far we have been looking at how to create a manual Heat legend. We explicitly specified values and colors.
However, most of the time in heat-map chart scenarios, a chart will already have a heat-mapped series in it.
This simplifies our job, since we can assign our reference series to the legend's series property. If we do so, our legend will magically take all value and color configuration from the series, without as needing to specify them manually.
let heatLegend = chart.createChild(am4charts.HeatLegend);
heatLegend.series = series;
heatLegend.width = am4core.percent(100);
var heatLegend = chart.createChild(am4charts.HeatLegend);
heatLegend.series = series;
heatLegend.width = am4core.percent(100);
{
  // ...
  "series": {
    "id": "s1",
    // ...
  },
  // ...
  "children": {
    "type": "HeatLegend",<br />    "forceCreate": true,
    "series": "s1",
    "width": "100%"
  }
}
NOTE In JSON config, we need to refer to the series by its id.
See the Pen amCharts V4: Heat legend (2) by amCharts (@amcharts) on CodePen.
Configuring heat legend
By default, the Heat legend only shows a nice gradient, depicting our heat colors.
To make it even more useful, let's configure it.
Configuring labels
A Heat legend has a property valueAxis which holds an instance of a ValueAxis. It is there for a specific reason of enabling us to use the full power of amCharts 4 axes to be used here as well.
Since this is a full-fledged Value axis, we can use its labels template list to configure our legend labels.
Let's make them smaller and denser, so more intermediate labels is shown:
heatLegend.valueAxis.renderer.labels.template.fontSize = 9;
heatLegend.valueAxis.renderer.minGridDistance = 30;
heatLegend.valueAxis.renderer.labels.template.fontSize = 9;
heatLegend.valueAxis.renderer.minGridDistance = 30;
{
  // ...
  "children": {
    "type": "HeatLegend",<br />    "forceCreate": true,
    // ...
    "valueAxis": {
      "renderer": {
        "labels": {
          "fontSize": 9
        },
        "minGridDistance": 30
      }
    }
  }
}
See the Pen amCharts V4: Heat legend (3) by amCharts (@amcharts) on CodePen.
MORE INFO For nitty gritty details on how axes, including the one used in Heat legend, can be configured, please visit out "Axes" article.
Changing orientation
A Heat legend is horizontal by default. To change it to vertical, we use its orientation property:
heatLegend.orientation = "vertical";
heatLegend.orientation = "vertical";
{
  // ...
  "children": {
    "type": "HeatLegend",<br />    "forceCreate": true,
    "orientation": "vertical",
    // ...
  }
}
See the Pen amCharts V4: Heat legend (4) by amCharts (@amcharts) on CodePen.
NOTE Since chart layout is vertical by default, in the above example, we are adding a Heat legend to the chart's rightAxesContainer which is a (usually empty but nevertheless always present) container located to the right of the plot area. Vertical Heat axis would not look too well directly below the chart, would it?
Color steps
So far we've been displaying the Heat legend as smooth gradient.
It's possible to have colored steps instead.
To do so, simply set legend's markerCount to some number. The legend will divvy up the gradient into this many steps.
heatLegend.markerCount = 10;
heatLegend.markerCount = 10;
{
  // ...
  "children": {
    "type": "HeatLegend",<br />    "forceCreate": true,
    "marketCount": 10,
    // ...
  }
}
See the Pen amCharts V4: Heat legend (6) by amCharts (@amcharts) on CodePen.
Changing height or width
By default the strip of the Heat legend is fixed height (or with if legend is vertical).
To change it simply set height of the legend container:
heatLegend.markerContainer.height = 50;
heatLegend.markerContainer.height = 50;
{
  // ...
  "children": {
    "type": "HeatLegend",
    "forceCreate": true,
    "markerContainer": {
      "height": 50
    },
    // ...
  }
}
See the Pen amCharts V4: Heat legend (2) by amCharts team (@amcharts) on CodePen.
Using logarithmic scale
By default the heat legend will use linear scale.
If you are using logarithmic scale in your heat rules (see here or here), you might want to enable logarithmic scale on a Heat legend as well.
This is done by setting on legend's valueAxis.logarithmic:
heatLegend.valueAxis.logarithmic = true;
heatLegend.valueAxis.logarithmic = true;
{
  // ...
  "children": {
    "type": "HeatLegend",
    "forceCreate": true,
    // ...
    "valueAxis": {
      "logarithmic": true
    }
  }
}
Adding interactivity
It would also be useful, if when we hovered over a column, Heat legend could indicate precise position of its value in the spectrum.
Luckily, that's totally possible.
We can use event handlers to catch "over" and "out" events on our columns.
And, since our Heat legend has a full-fledged Value axis for labels, we can use its methods like showTooltipAt(value) and hideTooltip().
series.columns.template.events.on("over", function(ev) {
  if (!isNaN(ev.target.dataItem.value)) {
    heatLegend.valueAxis.showTooltipAt(ev.target.dataItem.value)
  }
  else {
    heatLegend.valueAxis.hideTooltip();
  }
});

series.columns.template.events.on("out", function(ev) {
  heatLegend.valueAxis.hideTooltip();
});
See the Pen amCharts V4: Heat legend (5) by amCharts (@amcharts) on CodePen.

