In amCharts 4, bullets can be and are so much more than little geometric shapes plopped on the line. Those literally can be anything - shapes, text, controls, even other charts, or any combination of.
This article will walk you through all of the possibilities, starting from very basic, and ending with ones that will blow your hat off.
Prerequisites
Before diving in, we strongly suggest you familiarize yourself with the amCharts 4's concept of series and list templates.
To do so, take a look at "Series" and "List templates" articles.
Adding bullets to series
All series, regardless of its type, has a property named bullets.
It differs from other list-type series' properties in that it does not hold actual data item bullets, but rather a list of bullet templates that will be added for each of the data items in series.
The other difference is that it does not hold any specific type of items, but can have anything inherited from Container, which in amCharts 4 is a lot of objects, including charts themselves.
A Container is an "advanced" Sprite that can have many children elements in it, and knows how to arrange and position themselves inside.
NOTE Starting from version 4.3.12 bullet can be regular Sprite as well. This means that you can use simple shapes like Circle or Rectangle, or elements like Image.
Creating bullets
Whatever you want to be replicated as bullets over your series data items, you push() into bullets.
bullets is a list of Bullet objects or objects of basically any other type.
Let us show you how.
Using simple objects
To make this work we simple create an instance of an element and push it into bullets:
let square = lineSeries.bullets.push(am4core.Rectangle);
var square = lineSeries.bullets.push(am4core.Rectangle);
{
  // ...
  "series": [{
    "type": "LineSeries",
    // ...
    "bullets": [{
      "type": "Rectangle"
    }]
  }]
}
Using Bullet class
A Bullet is basically a Container. As we already mentioned, a container is a special type of visual element that can have any number children of any type.
So, to create a bullet out of, say, Rectangle we will need to:
- Create
Bulletinstance; - Create
Rectangleinstance; - Add rectangle instance to bullet as a child.
Since containers have a little handy method createChild(class) we can condense the last two into a single line of code.
Here's how it would look like:
let bullet = lineSeries.bullets.push(new am4charts.Bullet());
let square = bullet.createChild(am4core.Rectangle);
var bullet = lineSeries.bullets.push(new am4charts.Bullet());
var square = bullet.createChild(am4core.Rectangle);
{
  // ...
  "series": [{
    "type": "LineSeries",
    // ...
    "bullets": [{
      "children": [{
        "type": "Rectangle"
      }]
    }]
  }]
}
Configuring bullet
So far so good. However, we still have to apply some settings to our square bullet to make it take shape, like, width and height dimensions. Let's set it at 10/10px:
let bullet = lineSeries.bullets.push(new am4charts.Bullet());
let square = bullet.createChild(am4core.Rectangle);
square.width = 10;
square.height = 10;
var bullet = lineSeries.bullets.push(new am4charts.Bullet());
var square = bullet.createChild(am4core.Rectangle);
square.width = 10;
square.height = 10;
{
  // ...
  "series": [{
    "type": "LineSeries",
    // ...
    "bullets": [{
      "children": [{
        "type": "Rectangle",
        "width": 10,
        "height": 10
      }]
    }]
  }]
}
OK, time to take this baby for a spin:
See the Pen amCharts V4: Bullets (1) by amCharts (@amcharts) on CodePen.
We're off to a good start. We can see the little squares appearing where the bullet is supposed to go, even though the positioning is a bit off.
Positioning bullets
By default, stuff in a container (remember, a bullet is a container) is positioned by element's top-left corner.
To make our bullets rather be placed by their center, we'll set rectangle's horizontalCenter and verticalCenter properties to "middle":
let bullet = lineSeries.bullets.push(new am4charts.Bullet());
let square = bullet.createChild(am4core.Rectangle);
square.width = 10;
square.height = 10;
square.horizontalCenter = "middle";
square.verticalCenter = "middle";
var bullet = lineSeries.bullets.push(new am4charts.Bullet());
var square = bullet.createChild(am4core.Rectangle);
square.width = 10;
square.height = 10;
square.horizontalCenter = "middle";
square.verticalCenter = "middle";
{
  // ...
  "series": [{
    "type": "LineSeries",
    // ...
    "bullets": [{
      "children": [{
        "type": "Rectangle",
        "width": 10,
        "height": 10,
        "horizontalCenter": "middle",
        "verticalCenter": "middle"
      }]
    }]
  }]
}
See the Pen amCharts V4: Bullets (2) by amCharts (@amcharts) on CodePen.
Much better!
Configuring bullets
Remember, elements in a bullet are all Sprite-type objects, that have loads of settings that modify their appearance.
Do we perhaps want our square bullets to have an outline? Use Rectangle's stroke* properties to set that.
Or even have shadow? No problem - just add a ShadowFilter to the square element.
In fact, let's try both:
// Add outline to the square bullet
square.stroke = am4core.color("#2F4858");
square.strokeWidth = 1;

// Make square drop shadow by adding a DropShadow filter
let shadow = new am4core.DropShadowFilter();
shadow.dx = 2;
shadow.dy = 2;
square.filters.push(shadow);
// Add outline to the square bullet
square.stroke = am4core.color("#2F4858");
square.strokeWidth = 1;

// Make square drop shadow by adding a DropShadow filter
var shadow = new am4core.DropShadowFilter();
shadow.dx = 2;
shadow.dy = 2;
square.filters.push(shadow);
{
  // ...
  "series": [{
    "type": "LineSeries",
    // ...
    "bullets": [{
      "children": [{
        "type": "Rectangle",
        // ...
        "stroke": "#2F4858",
        "strokeWidth": 1,
        "filters": [{
          "type": "DropShadowFilter",
          "dx": 2,
          "dy": 2
        }]
      }]
    }]
  }]
}
See the Pen amCharts V4: Bullets (3) by amCharts (@amcharts) on CodePen.
Built-in bullet classes
amCharts 4 comes preloaded with a few ready-made bullet classes that you can use straight away as bullets, without worrying to add anything into them.
At this point we have two: CircleBullet (which creates a bullet with a Circle element in it) and LabelBullet (a bullet with a Label element in it, so you can created value labels).
So, if we just want to use a circle as a bullet, we don't need to go through the trouble of creating a Bullet, then creating a Circle, and adding it to the bullet. We can just create a single CircleBullet instance:
let bullet = lineSeries.bullets.push(new am4charts.CircleBullet());
var bullet = lineSeries.bullets.push(new am4charts.CircleBullet());
{
  // ...
  "series": [{
    "type": "LineSeries",
    // ...
    "bullets": [{
      "type": "CircleBullet"
    }]
  }]
}
And, besides creating required element, it will also set correct positioning options and dimensional settings like radius.
If we still need to modify something in the appearance of the bullet's circle element, we will find the Circle object in the bullet's circle property.
Similarly, in bullets created using LabelBullet class we'll find our Label instance we can configure in bullet's label property.
You'll see examples of different bullets used throughout the rest of this article.
Inheriting series color
Usually, we want our bullets to automatically be colored the same as the series. This is why any bullet added to series, will automatically inherit its stroke and fill settings.
Need to carry over any other properties, like fillOpacity? You'll need to manually set it on a bullet or its elements.
Density control
Bullets look generally nice if you have relatively few data points. However, if you have, say, 500 data points, 500 bullets would look a bit awful when crammed together.
Obvious solution would be not to use bullets on charts where you expect a lot of data. But that would mean that there would be no bullets, even if user zooms in the chart where only a few data points are visible.
Good news is that you can have both, by using series' minBulletDistance setting.
In English it means this "if there is less pixels between two adjacent data points, hide the bullets".
The below chart does not have any bullets when it loads, because minBulletDistance prevents them from appearing - too crammed together. Once you start zooming in, the bullets will eventually start popping up. Go ahead, give it a try.
See the Pen Date Based Data by amCharts team (@amcharts) on CodePen.
Multi-element bullets
Adding multiple elements to our bullet is easy. We just create and push() several elements to the series' bullets list.
Let's try out adding both CircleBullet and LabelBullet from the previous example.
let circleBullet = lineSeries.bullets.push(new am4charts.CircleBullet());
let labelBullet = lineSeries.bullets.push(new am4charts.LabelBullet());
labelBullet.label.text = "{value}";
var circleBullet = lineSeries.bullets.push(new am4charts.CircleBullet());
var labelBullet = lineSeries.bullets.push(new am4charts.LabelBullet());
labelBullet.label.text = "{value}";
{
  // ...
  "series": [{
    "type": "LineSeries",
    // ...
    "bullets": [{
      "type": "CircleBullet"
    }, {
      "type": "LabelBullet",
      "label": {
        "text": "{value}"
      }
    }]
  }]
}
Please note how we are setting up a Label instance in our LabelBullet. The text is what we want to be shown in the label, and the {value} in it is an instruction to string formatter to replace with real data from the specific data point the bullet is for.
MORE INFO Read about text formatter and data its binding.
MORE INFO For more details, code and examples about CircleBullet check out "Using Circle Bullets" tutorial.
Now, let's see if it worked:
See the Pen amCharts V4: Bullets (4) by amCharts (@amcharts) on CodePen.
It did. At least in a sense that both circle bullets and data labels with correct values are there.
However, they're all overlapped (because they're all centered by default), which means we'll need to apply some shifting to fix the overlapping.
For relatively shifting an element, we can use its dx and dy properties, to apply horizontal and vertical shift respectively. Negative values will shift the element left/upwards, while positive value will shift it right/downwards.
Looks like shifting the label upwards should solve the issue. While at it, i'm going to add a small outline to the circle as well, to make our chart look even nicer:
let circleBullet = lineSeries.bullets.push(new am4charts.CircleBullet());
circleBullet.circle.stroke = am4core.color("#fff");
circleBullet.circle.strokeWidth = 2;

let labelBullet = lineSeries.bullets.push(new am4charts.LabelBullet());
labelBullet.label.text = "{value}";
labelBullet.label.dy = -20;
var circleBullet = lineSeries.bullets.push(new am4charts.CircleBullet());
circleBullet.circle.stroke = am4core.color("#fff");
circleBullet.circle.strokeWidth = 2;

var labelBullet = lineSeries.bullets.push(new am4charts.LabelBullet());
labelBullet.label.text = "{value}";
labelBullet.label.dy = -20;
{
  // ...
  "series": [{
    "type": "LineSeries",
    // ...
    "bullets": [{
      "type": "CircleBullet",
      "circle": {
        "stroke": "#fff",
        "strokeWidth": 2
      }
    }, {
      "type": "LabelBullet",
      "label": {
        "text": "{value}",
        "dy": -20
      }
    }]
  }]
}
Now, run the below example and tell me our ugly little duckling from the very first example didn't turn into a beautiful swan!
See the Pen amCharts V4: Bullets (5) by amCharts (@amcharts) on CodePen.
Showing tooltip
A bullet, just like any other element on the chart, can have tooltip displayed whenever hovered.
To enable it, use tooltipText property. It works just like text property for a label example above. You can set any text, or formatting directives, or references to data:
circleBullet.tooltipText = "Value: [bold]{value}[/]";
circleBullet.tooltipText = "Value: [bold]{value}[/]";
{
  // ...
  "series": [{
    "type": "LineSeries",
    // ...
    "bullets": [{
      "type": "CircleBullet",
      // ...
      "tooltipText": "Value: [bold]{value}[/]"
    }]
  }]
}
Try hovering on the bullets now:
See the Pen amCharts V4: Bullets (5 with tooltip) by amCharts (@amcharts) on CodePen.
Bullets in data
So far we have been using identical bullets for all data points.
However, what if we want to modify appearance of the bullet based on the data?
That's where propertyFields functionality comes in.
Property fields is an object, that ties visual element's properties to the actual values in the data.
For example we might bind bullet's angle property to a value in data to dynamically rotate an arrow in it to depict wind direction.
// Add a bullet
let bullet = lineSeries.bullets.push(new am4charts.Bullet());

// Bind `rotation` property to `angle` field in data
bullet.propertyFields.rotation = "angle";

// Add a triangle to act as am arrow
let arrow = bullet.createChild(am4core.Triangle);
arrow.horizontalCenter = "middle";
arrow.verticalCenter = "middle";
arrow.stroke = am4core.color("#fff");
arrow.direction = "top";
arrow.width = 10;
arrow.height = 25;
// Add a bullet
var bullet = lineSeries.bullets.push(new am4charts.Bullet());

// Bind `rotation` property to `angle` field in data
bullet.propertyFields.rotation = "angle";

// Add a triangle to act as am arrow
var arrow = bullet.createChild(am4core.Triangle);
arrow.horizontalCenter = "middle";
arrow.verticalCenter = "middle";
arrow.stroke = am4core.color("#fff");
arrow.direction = "top";
arrow.width = 10;
arrow.height = 25;
{
  // ...
  "series": [{
    "type": "LineSeries",
    // ...
    "bullets": [{
      "type": "Bullet",
      "children": [{
        "type": "Triangle",
        "horizontalCenter": "middle",
        "verticalCenter": "middle",
        "stroke": "#fff",
        "direction": "top",
        "width": 10,
        "height": 25
      }]
    }]
  }]
}
NOTE A Triangle, besides width and height, also needs its direction set to make it work.
Here's how the above looks in action: (we've dimmed out the line itself so that arrows become more prominent)
See the Pen amCharts V4: Bullets (6) by amCharts (@amcharts) on CodePen.
rotation is not the only property you can bind to data. You can bind fill, stroke, opacity, or just about any other property or a combination of.
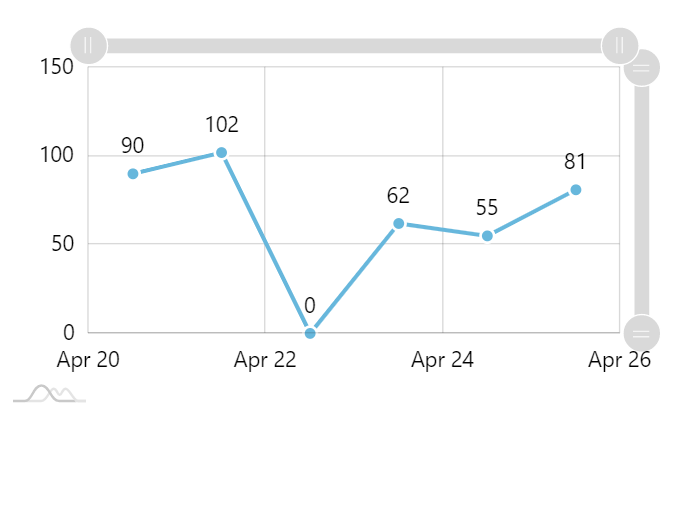
Bullets outside plot area
Disabling bullet clipping
The chart will mask (clip) bullets that do not fit into plot area. This might result in label bullets not fitting, or parts of the bullet circles cut off, etc.
If we want to disable that, we can set chart's maskBullets setting to false. This will allow bullets to "bleed" over the edge of plot area.
chart.maskBullets = false;
chart.maskBullets = false;
{
  // ...
  "maskBullets": false
}
The following demo shows how using maskBullets allows LabelBullet elements go outside plot area:
See the Pen amChrts 4: Masking bullets by amCharts (@amcharts) on CodePen.
Hiding unmasked bullets
Unmasking bullets can have an unwelcome side-effect: when chart is zoomed, bullets might still show well outside plot area.
Zoomed out chart 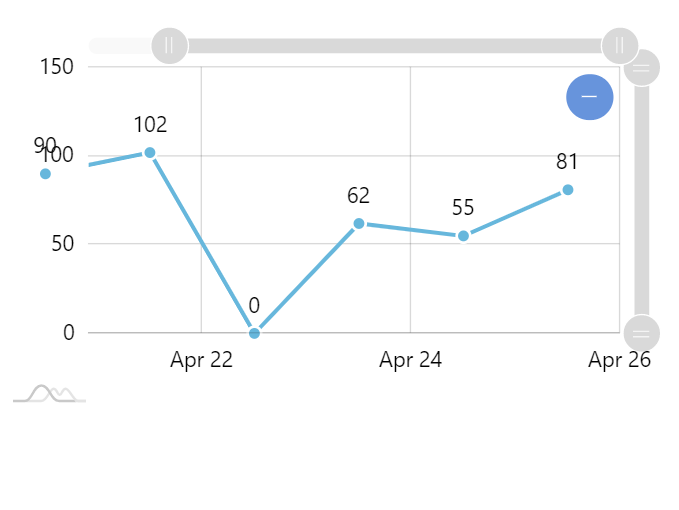
Zoomed in chart
If you have zooming enabled, we'll need to fix that through the use of adapters:
bullet.adapter.add("dy", function(dy, target) {
  hideBullet(target);
  return dy;
})

function hideBullet(bullet) {
  if (bullet.pixelX < 0 || bullet.pixelX > chart.plotContainer.measuredWidth || bullet.pixelY < 0 || bullet.pixelY > chart.plotContainer.measuredHeight) {
    bullet.visible = false;
  }
  else {
    bullet.visible = true;
  }
}
{
  // ...
  "series": [{
    "type": "LineSeries",
    // ...
    "bullets": [{
      "type": "Bullet",
      // ...
      "adapter": {
        "dy": function(dy, bullet) {
          var chart = bullet.baseSprite;
          if (bullet.pixelX < 0 || bullet.pixelX > chart.plotContainer.measuredWidth || bullet.pixelY < 0 || bullet.pixelY > chart.plotContainer.measuredHeight) {
            bullet.visible = false;
          }
          else {
            bullet.visible = true;
          }
          return dy;
        }
      }
    }]
  }]
}
See the Pen amCharts V4: Bullets (5 with tooltip) by amCharts team (@amcharts) on CodePen.
Using images as bullets
When creating bullets, we're not limited to basic shapes. As we discussed before, a Bullet as a Container which you can add virtually anything to.
That includes images. Let's explore our options here.
Same image for all bullets
If we want to use an image for all bullets in the series, we can just add an instance of the Image into our respective bullet container, just like we were doing with Rectangle objects in previous chapters.
let bullet = lineSeries.bullets.push(new am4charts.Bullet());
let image = bullet.createChild(am4core.Image);
image.href = "/path/to/image.svg";
image.width = 30;
image.height = 30;
image.horizontalCenter = "middle";
image.verticalCenter = "middle";
var bullet = lineSeries.bullets.push(new am4charts.Bullet());
var image = bullet.createChild(am4core.Image);
image.href = "/path/to/image/star.svg";
image.width = 30;
image.height = 30;
image.horizontalCenter = "middle";
image.verticalCenter = "middle";
{
  // ...
  "series": [{
    "type": "LineSeries",
    // ...
    "bullets": [{
      "type": "Bullet",
      "children": [{
        "type": "Image",
        "href": "/path/to/image/star.svg",
        "width": 30,
        "height": 30,
        "horizontalCenter": "middle",
        "verticalCenter": "middle"
      }]
    }]
  }]
}
See the Pen amCharts V4: Bullets (images 1) by amCharts (@amcharts) on CodePen.
TIP A href parameter for an Image does not necessarily have to point to a standalone file. It can be a "data URI".
Individual images for data items
We can also specify a separate image for each individual data item as well.
For that we'll turn to the "property fields" - a topic we already touched in "Bullets in data" chapter.
Since all bullets, including its children have access to the same data point, we can add image information to our data items in our source data. Something like this:
[{
  "date": new Date(2018, 3, 20),
  "value": 90,
  "bullet": "data:image/svg+xml;charset=utf-8;base64,PHN2ZyBoZWlnaHQ9Ijc5NCIgdmVyc2lvbj0iMSIgdmlld0JveD0iMCAwIDIxMCAyMTAiIHdpZHRoPSI3OTQiIHhtbG5zPSJodHRwOi8vd3d3LnczLm9yZy8yMDAwL3N2ZyI+PHBhdGggZD0iTTE4IDZDMTEgNiA2IDExIDYgMTd2MTc1YzAgNyA1IDEyIDEyIDEyaDE3NWM2IDAgMTEtNSAxMS0xMlYxN2MwLTYtNS0xMS0xMS0xMUgxOHoiIGZpbGw9IiMwMDI0N2QiLz48cGF0aCBkPSJNNiAzOXYxN2w4NCA0OS04NCA0OHYxOGw5OS01OCA5OSA1OHYtMThsLTg0LTQ4IDg0LTQ5VjM5bC05OSA1N0w2IDM5eiIgZmlsbD0iI2NmMTQyYiIgcGFpbnQtb3JkZXI9Im1hcmtlcnMgZmlsbCBzdHJva2UiLz48cGF0aCBkPSJNODggNnY4Mkg2djM0aDgydjgyaDM0di04Mmg4MlY4OGgtODJWNkg4OHoiIGZpbGw9IiNjZjE0MmIiIHBhaW50LW9yZGVyPSJtYXJrZXJzIGZpbGwgc3Ryb2tlIi8+PHBhdGggZD0iTTg1IDZ2NzVMNiAzNXY4bDcyIDQySDYyTDYgNTN2N2w0MyAyNUg2djZoODZWNnptMzQgMHY4NWg4NXYtNmgtNDJsNDItMjV2LTdsLTU1IDMyaC0xN2w3Mi00MnYtOGwtNzggNDZWNnpNOTIgMTE5SDZ2Nmg0M0w2IDE0OXY4bDU2LTMyaDE2TDYgMTY3djdsNzktNDV2NzVoN3YtNzl6bTI3IDB2ODVoN3YtNzVsNzggNDV2LTdsLTcyLTQyaDE3bDU1IDMydi04bC00Mi0yNGg0MnYtNmgtODV6IiBzdHlsZT0ibGluZS1oZWlnaHQ6bm9ybWFsO2ZvbnQtdmFyaWFudC1saWdhdHVyZXM6bm9ybWFsO2ZvbnQtdmFyaWFudC1wb3NpdGlvbjpub3JtYWw7Zm9udC12YXJpYW50LWNhcHM6bm9ybWFsO2ZvbnQtdmFyaWFudC1udW1lcmljOm5vcm1hbDtmb250LXZhcmlhbnQtYWx0ZXJuYXRlczpub3JtYWw7Zm9udC1mZWF0dXJlLXNldHRpbmdzOm5vcm1hbDt0ZXh0LWluZGVudDowO3RleHQtYWxpZ246c3RhcnQ7dGV4dC1kZWNvcmF0aW9uLWxpbmU6bm9uZTt0ZXh0LWRlY29yYXRpb24tc3R5bGU6c29saWQ7dGV4dC1kZWNvcmF0aW9uLWNvbG9yOiMwMDA7dGV4dC10cmFuc2Zvcm06bm9uZTt0ZXh0LW9yaWVudGF0aW9uOm1peGVkO3NoYXBlLXBhZGRpbmc6MDtpc29sYXRpb246YXV0bzttaXgtYmxlbmQtbW9kZTpub3JtYWwiIGNvbG9yPSIjMDAwIiBmb250LXdlaWdodD0iNDAwIiBmb250LWZhbWlseT0ic2Fucy1zZXJpZiIgd2hpdGUtc3BhY2U9Im5vcm1hbCIgb3ZlcmZsb3c9InZpc2libGUiIGZpbGw9IiNmZmYiIHBhaW50LW9yZGVyPSJtYXJrZXJzIGZpbGwgc3Ryb2tlIi8+PC9zdmc+"
}, {
  "date": new Date(2018, 3, 21),
  "value": 102,
  "bullet": "data:image/svg+xml;charset=utf-8;base64,PHN2ZyBoZWlnaHQ9Ijc5NCIgdmVyc2lvbj0iMSIgdmlld0JveD0iMCAwIDIxMCAyMTAiIHdpZHRoPSI3OTQiIHhtbG5zPSJodHRwOi8vd3d3LnczLm9yZy8yMDAwL3N2ZyI+PHBhdGggZD0iTTE4IDZDMTEgNiA2IDExIDYgMTd2MTc1YzAgNyA1IDEyIDEyIDEyaDE3NWM2IDAgMTEtNSAxMS0xMlYxN2MwLTYtNS0xMS0xMS0xMUgxOHoiIGZpbGw9IiNmZmYiLz48cGF0aCBkPSJNMTA1IDY3bC03IDEyLTYtMiAzIDIxLTktMTEtMiA1LTEyLTEgMyAxMS01IDMgMTMgMTBjMSAxIDUgNCA1IDZsLTEgNCAzLTEgMTQtMnYyMGgydi0yMGwxNCAyIDMgMXMtMi0zLTEtNGMwLTIgNC01IDUtNmw4LTYgNi00LTUtMyAyLTExLTExIDEtMi01LTEwIDEzIDMtMjMtNiAyek0xOCA2QzExIDYgNiAxMSA2IDE3djE3NWMwIDcgNSAxMiAxMiAxMmgzMVY2SDE4ek0xOTMgNmM2IDAgMTEgNSAxMSAxMXYxNzVjMCA3LTUgMTItMTEgMTJoLTMyVjZ6IiBmaWxsPSJyZWQiIHBhaW50LW9yZGVyPSJtYXJrZXJzIGZpbGwgc3Ryb2tlIi8+PC9zdmc+"
}, {
  "date": new Date(2018, 3, 22),
  "value": 65,
  "bullet": "data:image/svg+xml;charset=utf-8;base64,PHN2ZyBoZWlnaHQ9Ijc5NCIgdmVyc2lvbj0iMSIgdmlld0JveD0iMCAwIDIxMCAyMTAiIHdpZHRoPSI3OTQiIHhtbG5zPSJodHRwOi8vd3d3LnczLm9yZy8yMDAwL3N2ZyI+PHBhdGggZD0iTTE4IDZDMTEgNiA2IDExIDYgMTd2MTc1YzAgNyA1IDEyIDEyIDEyaDE3NWM2IDAgMTEtNSAxMS0xMlYxN2MwLTYtNS0xMS0xMS0xMUgxOHoiIGZpbGw9IiNmZmYiLz48Y2lyY2xlIGN4PSIxMDUiIGN5PSIxMDUiIHI9IjM2IiBmaWxsPSIjYmMwMDJkIiBwYWludC1vcmRlcj0ibWFya2VycyBmaWxsIHN0cm9rZSIvPjwvc3ZnPg=="
}, {
  "date": new Date(2018, 3, 23),
  "value": 62,
  "bullet": "data:image/svg+xml;charset=utf-8;base64,PHN2ZyBoZWlnaHQ9Ijc5NCIgdmVyc2lvbj0iMSIgdmlld0JveD0iMCAwIDIxMCAyMTAiIHdpZHRoPSI3OTQiIHhtbG5zPSJodHRwOi8vd3d3LnczLm9yZy8yMDAwL3N2ZyI+PHBhdGggZD0iTTE4IDZDMTEgNiA2IDExIDYgMTd2NTVoMTk4VjE3YzAtNi01LTExLTExLTExaC04N3pNNiAxMzh2NTRjMCA3IDUgMTIgMTIgMTJoMTc1YzYgMCAxMS01IDExLTEydi01NHoiIGZpbGw9IiNlZDI5MzciLz48cGF0aCBkPSJNNiA3MnY2NmgxOThWNzJINnoiIGZpbGw9IiNmOWY5ZjkiLz48L3N2Zz4="
}, {
  "date": new Date(2018, 3, 24),
  "value": 55,
  "bullet": "data:image/svg+xml;charset=utf-8;base64,PHN2ZyBoZWlnaHQ9Ijc5NCIgdmVyc2lvbj0iMSIgdmlld0JveD0iMCAwIDIxMCAyMTAiIHdpZHRoPSI3OTQiIHhtbG5zPSJodHRwOi8vd3d3LnczLm9yZy8yMDAwL3N2ZyI+PHBhdGggZD0iTTE4IDZDMTEgNiA2IDExIDYgMTd2MTc1YzAgNyA1IDEyIDEyIDEyaDU0VjZIMTh6Ii8+PHBhdGggZD0iTTEzOCA2djE5OGg1NWM2IDAgMTEtNSAxMS0xMlYxN2MwLTYtNS0xMS0xMS0xMXoiIGZpbGw9IiNlZDI5MzkiLz48cGF0aCBkPSJNNzIgNnYxOThoNjZWNkg3MnoiIGZpbGw9IiNmYWUwNDIiLz48L3N2Zz4="
}, {
  "date": new Date(2018, 3, 25),
  "value": 81,
  "bullet": "data:image/svg+xml;charset=utf-8;base64,PHN2ZyBoZWlnaHQ9Ijc5NCIgdmVyc2lvbj0iMSIgdmlld0JveD0iMCAwIDIxMCAyMTAiIHdpZHRoPSI3OTQiIHhtbG5zPSJodHRwOi8vd3d3LnczLm9yZy8yMDAwL3N2ZyI+PHBhdGggZD0iTTE4IDZDMTEgNiA2IDExIDYgMTd2ODhoMTk4VjE3YzAtNi01LTExLTExLTExSDE4eiIgZmlsbD0iI2RmMTEyYiIvPjxwYXRoIGQ9Ik02IDEwNXY4N2MwIDcgNSAxMiAxMiAxMmgxNzVjNiAwIDExLTUgMTEtMTJ2LTg3SDZ6IiBmaWxsPSIjZmZmIi8+PC9zdmc+"
}]
NOTE We mentioned "data URIs" in previous example. The above data example uses them. That mumbolajumbo is actually a Base64-encoded SVG. Data URIs is a good way to embed full image info into our data, without requiring for any external files.
OK, so now that we know we have images in our data, we have to tell an Image in our bullet to use that.
For that, we'll use propertyFields which is basically a way to override any property of an object from the field in its related data.
The field we need to be overriding is href. And we're overriding it values with key "bullet" in our data:
let bullet = lineSeries.bullets.push(new am4charts.Bullet());
let image = bullet.createChild(am4core.Image);
image.propertyFields.href = "bullet";
image.width = 30;
image.height = 30;
image.horizontalCenter = "middle";
image.verticalCenter = "middle";
var bullet = lineSeries.bullets.push(new am4charts.Bullet());
var image = bullet.createChild(am4core.Image);
image.propertyFields.href = "bullet";
image.width = 30;
image.height = 30;
image.horizontalCenter = "middle";
image.verticalCenter = "middle";
{
  // ...
  "series": [{
    "type": "LineSeries",
    // ...
    "bullets": [{
      "type": "Bullet",
      "children": [{
        "type": "Image",
        "propertyFields": {
          "href": "bullet"
        },
        "width": 30,
        "height": 30,
        "horizontalCenter": "middle",
        "verticalCenter": "middle"
      }]
    }]
  }]
}
As you can see, nothing much has changed from the previous example. Only the explicit href setting was replaced with propertyFields.href setting.
Let's see how this looks in real life:
See the Pen amCharts V4: Bullets (images 2) by amCharts (@amcharts) on CodePen.
Modifying appearance via states
Let us introduce you to another very powerful feature of amCharts 4 - states.
In short, a state is a set of property values to apply to an element whenever certain conditions are met or some event occurs. Like for instance an element is hovered.
For example, we might want to enlarge the whole bullet whenever we hover over it. Besides overriding simple properties, it can also apply advanced visual effects, such as filters.
Hover state
Let's modify our above example to enlarge the arrows, whenever those are hovered.
let hoverState = bullet.states.create("hover");
hoverState.properties.scale = 1.7;
var hoverState = bullet.states.create("hover");
hoverState.properties.scale = 1.7;
{
  // ...
  "series": [{
    "type": "LineSeries",
    // ...
    "bullets": [{
      "type": "Bullet",
      // ...
      "states": {
        "hover": {
          "properties": {
            "scale": 1.7
          }
        }
      }
    }]
  }]
}
Try running the example below, and hovering on those arrows: (we've also enabled "animated" theme for a nicer transition; read more about themes here)
See the Pen amCharts V4: Bullets (7) by amCharts (@amcharts) on CodePen.
NOTE If chart has Cursor enabled, a "hover" state will be applied automatically for all bullets in current Cursor's location. More info about it in "Cursor: Series bullets".
Advanced use
Positioning within column
Putting a bullet on a Line series elbow was easy, since it has a fine connection point.
But what about putting on other shapes, like, say, column? Suppose we want to place a data label in the middle of the column.
Let's try using LabelBullet we examined earlier:
let columnSeries = chart.series.push(new am4charts.ColumnSeries());
columnSeries.dataFields.valueY = "value";
columnSeries.dataFields.dateX = "date";
columnSeries.name = "Sales";

// Add a bullet
let bullet = columnSeries.bullets.push(new am4charts.LabelBullet());
bullet.label.text = "{value}";
var columnSeries = chart.series.push(new am4charts.ColumnSeries());
columnSeries.dataFields.valueY = "value";
columnSeries.dataFields.dateX = "date";
columnSeries.name = "Sales";

// Add a bullet
var bullet = columnSeries.bullets.push(new am4charts.LabelBullet());
bullet.label.text = "{value}";
{
  // ...
  "series": [{
    "type": "ColunSeries",
    // ...
    "bullets": [{
      "type": "LabelBullet",
      "label": {
        "text": "{value}"
      }
    }]
  }]
}
See the Pen amCharts V4: Bullets (9) by amCharts (@amcharts) on CodePen.
Functionality is there, but text, stuck on top of the column does not look too good.
We could use bullet's dy property with a negative value to shift the label upwards, which would definitely make things better:
See the Pen amCharts V4: Bullets (10) by amCharts (@amcharts) on CodePen.
Better, but not let's stop there.
Let's position our labels in the middle of each respective column. To set vertical positioning of the bullet in respect to the column, we can use its locationX and locationY properties.
Since we're OK with horizontal positioning, we're going to use only locationY which accepts values from 0 (top) to 1 (bottom), with 0.5 being in the middle.
bullet.locationY = 0.5;
bullet.locationY = 0.5;
{
  // ...
  "series": [{
    "type": "ColunSeries",
    // ...
    "bullets": [{
      "type": "LabelBullet",
      // ...
      "locationY": 0.5
    }]
  }]
}
For the kick of it, we've thrown in another bullet (CircleBullet) to serve as a nice background for our bullets:
See the Pen amCharts V4: Bullets (11) by amCharts (@amcharts) on CodePen.
Looks good, doesn't it?
There's one caveat, though. For bullets, locationY property means the relative vertical position in the whole height of the column. That means that if our scale would not start at zero, it would be not in the direct center of the currently visible portion of the column.
To work around it, we can drop the bullet concept altogether, and push our items directly into Column series template. (read more about concept of list templates)
let label = columnSeries.columns.template.createChild(am4core.Label);
label.text = "{value}";
label.align = "center";
label.valign = "middle";
label.zIndex = 2;
label.fill = am4core.color("#000");
label.strokeWidth = 0;

let bullet = columnSeries.columns.template.createChild(am4core.Circle);
bullet.locationY = 0.5;
bullet.align = "center";
bullet.valign = "middle";
bullet.fill = am4core.color("#fff");
bullet.fillOpacity = 0.5;
bullet.radius = 20;
var label = columnSeries.columns.template.createChild(am4core.Label);
label.text = "{value}";
label.align = "center";
label.valign = "middle";
label.zIndex = 2;
label.fill = am4core.color("#000");
label.strokeWidth = 0;

var bullet = columnSeries.columns.template.createChild(am4core.Circle);
bullet.locationY = 0.5;
bullet.align = "center";
bullet.valign = "middle";
bullet.fill = am4core.color("#fff");
bullet.fillOpacity = 0.5;
bullet.radius = 20;
{
  // ...
  "series": [{
    "type": "ColunSeries",
    // ...
    "columns": [{
      "children": [{
        "type": "Label",
        "align": "center",
        "valign": "middle",
        "zIndex": 2,
        "strokeWidth": 0
      }]
    }, {
      "children": [{
        "type": "Circle",
        "align": "center",
        "valign": "middle",
        "fill": "#fff",
        "fillOpacity": 0.5,
        "radius": 20
      }]
    }]
  }]
}
See the Pen amCharts V4: Bullets (12) by amCharts (@amcharts) on CodePen.
Here, you just learned how to nest various elements in amCharts 4!
MORE INFO For more information about how Containers work, visit "Working with Containers" article.
Showing bullets selectively
Sometimes you will need to show bullets only on certain data items.
The workflow is as follows:
- Disable your bullet by setting its
disabled = true. - Set up bullet's
propertyFieldsto look for values overridingdisabledin data.
Example:
bullet.disabled = true;
bullet.propertyFields.disabled = "disabled";
bullet.disabled = true;
bullet.propertyFields.disabled = "disabled";
{
  // ...
  "series": [{
    "bullets": [{
      // ...
      "disabled": true,
      "propertyFields": {
        "disabled": "disabled"
      }
    }]
  }]
}
This way, all of the bullets will be disabled, except for those that will find false in their respective data items' disabled fields.
See the Pen amCharts V4: Bullets (3) by amCharts team (@amcharts) on CodePen.
Bullet performance
Since bullets usually come in packs, they might reduce chart performance.
Please check "Bullets" section in our "Performance" article for tips on how to set up bullets so they don't bog down your website or application.
Value-sensitive bullet adjustments
We can use Adapters to dynamically adjust bullet settings like position, color and rotation, based on the value.
We do have a separate tutorial for such usage:
Related content
- Ordering zIndex of series lines and bullets
- Using label bullets on a horizontal bar chart
- Using error bullets
- Totals on column stacks
- Plugin: Bullets (creating advanced bullets like flags, pins, stars)
- Range Bullets (adding bullets to axes)
- Using "sticky" tooltips
- Tackling label background


