Any element on a chart can have tooltipText set to display in form of a tooltip when hovered or touched. This tutorial will show how you can turn those tooltips into "sticky", so they are always shown, without requiring to hover/touch the element.
Requirements
The functionality was introduced in version 4.5.4, so if you happen to be using some older version, you'll need to upgrade.
Enabling sticky tooltip
Single element
To make an element display its tooltip permanently, we use its showTooltipOn property. To make tooltip always be shown, set it to "always".
The following will create a simple circle with it's tooltip always visible:
let circle = chart.createChild(am4core.Circle);
circle.radius = 50;
circle.fill = am4core.color("#c00");
circle.align = "center";
circle.valign = "middle";
circle.tooltipText = "Hi, I'm Mr. Circle.";
circle.showTooltipOn = "always";
var circle = chart.createChild(am4core.Circle);
circle.radius = 50;
circle.fill = am4core.color("#c00");
circle.align = "center";
circle.valign = "middle";
circle.tooltipText = "Hi, I'm Mr. Circle.";
circle.showTooltipOn = "always";
{
  // ...
  "children": [{
    "type": "Circle",
    "radius": 50,
    "fill": "#c00",
    "align": "center",
    "valign": "middle",
    "tooltipText": "Hi, I'm Mr. Circle.",
    "showTooltipOn": "always"
  }]
}
See the Pen amCharts 4: sticky tooltips by amCharts team (@amcharts) on CodePen.
Template
However, most of the time we won't be using it on a single element, but rather on all items of, say, Series.
In this case we can set it on list template, which will propagate it all elements.
For example, let's enable sticky tooltips on all columns of a ColumnSeries:
series.columns.template.tooltipText = "{categoryX}\n[bold]{valueY}[/]";
series.columns.template.showTooltipOn = "always";
series.columns.template.tooltipText = "{categoryX}\n[bold]{valueY}[/]";
series.columns.template.showTooltipOn = "always";
{
  // ...
  "series": [{
    "type": "ColumnSeries",
    // ...
    "columns": {
      "tooltipText": "{categoryX}\n[bold]{valueY}[/]",
      "showTooltipOn": "always"
    }
  }]
}
See the Pen amCharts 4: sticky tooltips by amCharts team (@amcharts) on CodePen.
Position and orientation
Tooltip positioning is bound to a certain logic in amCharts 4.
For series, it usually is placed to the side. It also depends on vertical and horizontal position.
For sticky tooltips that might not work, and we might want to micro-manage tooltip positions and orientation.
Orientation
For that we can use Tooltip property pointerOrientation.
Let's make our tooltips always stick upwards instead of to the side:
series.tooltip.pointerOrientation = "down";
series.tooltip.pointerOrientation = "down";
{
  // ...
  "series": [{
    "type": "ColumnSeries",
    // ...
    "tooltip": {
      "pointerOrientation": "down"
    }
  }]
}
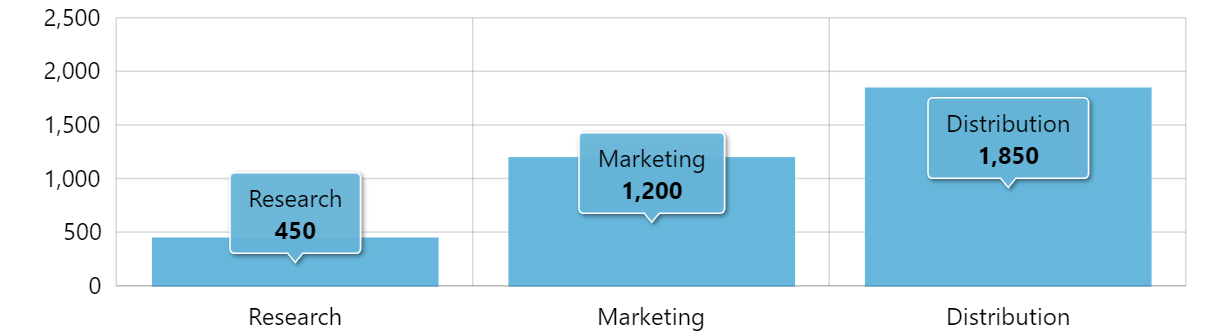
pointerOrientation is set to "down"Position
Positioning within target element
You can see that the tooltip is now pointing to the center of each column.
Let's make them point to the top.
For that we do have a handy properties like tooltipX and tooltipY, which indicate the relative position within element where tooltip should point to horizontally and vertically.
We want to position the tooltip on the very top of the column, which means we need to set tooltipY to zero.
series.columns.template.tooltipY = 0;
series.columns.template.tooltipY = 0;
{
  // ...
  "series": [{
    "type": "ColumnSeries",
    // ...
    "columns": {
      // ...
      "tooltipY": 0
    }
  }]
}
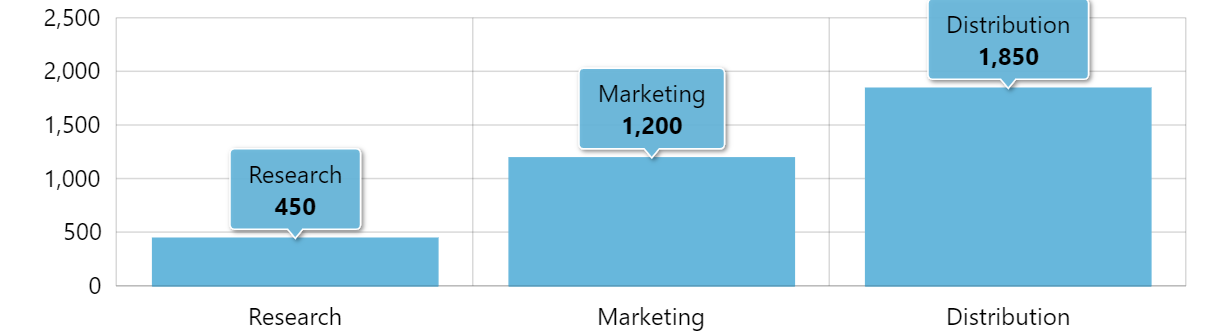
tooltipY = 0Micro-adjusting position
If we want, we can micro-adjust the position using tooltip's dx and dy, which move element by X pixels horizontally or vertically respectively.
Let's move the tooltip a few pixels up.
series.tooltip.dy = -5;
series.tooltip.dy = -5;
{
  // ...
  "series": [{
    "type": "ColumnSeries",
    // ...
    "tooltip": {
      // ...
      "dy": -5
    }
  }]
}
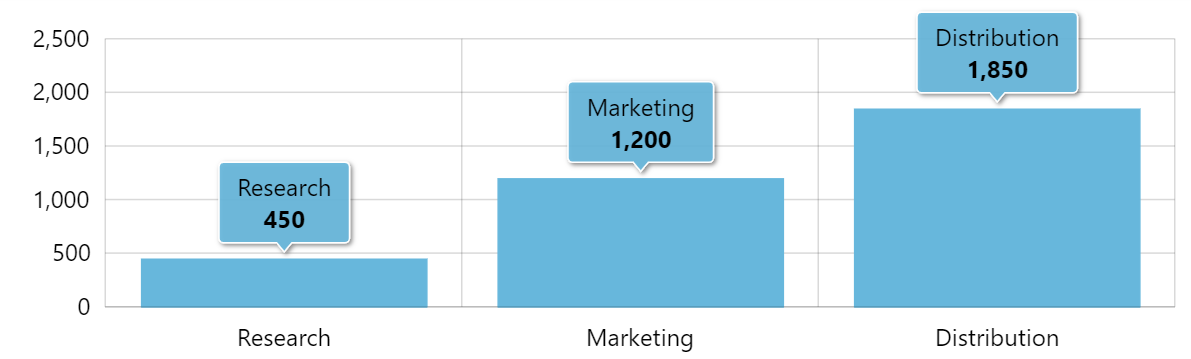
dy = -5Selective sticky tooltips
Sometimes we won't want to show tooltips for all items in the series.
Let's say we want to show a tooltip for the first and last item.
That's where "property fields" come into play.
Property fields allow overriding virtually any property of an item in series with a value from data. The properties like showTooltipOn, pointerOrientation, and dy are no exception.
bullet.propertyFields.showTooltipOn = "showTooltip";
series.tooltip.propertyFields.pointerOrientation = "orientation";
series.tooltip.propertyFields.dy = "offset";
bullet.propertyFields.showTooltipOn = "showTooltip";
series.tooltip.propertyFields.pointerOrientation = "orientation";
series.tooltip.propertyFields.dy = "offset";
{
  // ...
  "series": [{
    "type": "ColumnSeries",
    // ...
    "bullets": [{
      // ...
      "propertyFields": {
        "showTooltipOn": "showTooltip"
      }
    }],
    "tooltip": {
      // ...
      "propertyFields": {
        "pointerOrientation": "orientation",
        "dy": "offset"
      }
    }
  }]
}
The above means that for each and every item, the chart will look for values keys showTooltip, orientation, and offset in data context of the data item, to override default settings for properties showTooltipOn, pointerOrientation, and dy respectively.
See the Pen amCharts 4: sticky tooltips by amCharts team (@amcharts) on CodePen.
Deprecation notice
If you were using alwaysShowTooltip = true property before, make sure you update your code to use showTooltipOn = "always" instead. The former method is being deprecated in favor of the latter, which is more flexible.
Examples
Column series
See the Pen amCharts 4: sticky tooltips by amCharts team (@amcharts) on CodePen.
Line series
For LineSeries, we are setting tooltip information on its bullets.
See the Pen amCharts 4: sticky tooltips by amCharts team (@amcharts) on CodePen.
TreeMap chart
See the Pen amCharts 4: TreeMap with always on tooltips by amCharts team (@amcharts) on CodePen.
MapChart
See the Pen Show always-on tooltips on MapChart by amCharts team (@amcharts) on CodePen.