amCharts 4 offers a stunning framework for animations. Everything - positions, sizes, colors, even shapes - can be animated. Smoothly, automatically, no hassles.
This article aims to explain how to enable, configure, and tweak animations on your charts and their respective elements.
Using "Animated" theme
Animations are actually automatically enabled. It's the various *Duration properties on Charts, Series, Axes, etc. that determine if something animates. The easiest way to get started, to give these properties decent timings, is by using the "Animated" theme.
To use a theme, you'll need first to import a relative module or load a theme file:
// ... other imports
import am4themes_animated from "@amcharts/amcharts4/themes/animated";
<!-- other includes -->
<script src="//www.amcharts.com/lib/4/themes/animated.js"></script>
Then enable it before instantiating any charts:
am4core.useTheme(am4themes_animated);
am4core.useTheme(am4themes_animated);
This will automatically enable all animations in all the places that matter.
Here's a basic chart with Animated theme enabled:
See the Pen amCharts V4: Animations (1) by amCharts (@amcharts) on CodePen.
Notice the chart initial animation? How chart cursor moves smoothly from position to position, instead of jumping? How tooltips transit from one place to another, and fade in and out? It's all enabled by Animated theme.
MORE INFO For more information about amCharts 4 themes and how to use them, check our "Themes" article.
Manual animation settings
In case enabling animations all over the chart is not an option for you. Or, perhaps, you want to fine-tune the timing, you can do so by applying animation-related settings on various objects manually.
This might seem overly complicated, but there are four distinctive settings that control animations: animationDuration, interpolationDuration, transitionDuration, and rangeChangeDuration.
Not all are available in all objects, so perhaps it's best if we explain them one by one.
"transitionDuration"
This is perhaps the main animation-related setting as it applies to states.
"States" is an amCharts 4 concept where you define certain sets of properties to apply in a certain situation. (state)
transitionDuration is a property of a State object. It basically means: "when this particular State is applied to an object, animate each of the properties from their current value to the target value (as defined in State) for X milliseconds".
For example, "hidden" state is applied when you hide an object. Normally, the object would just pop out of view instantly.
However, if we set transitionDuration on object's "hidden" state, it will gradually fade out when object is hidden.
For the sake of test, let's disable Animated theme in our previous example, and manually enable transitionDuration on first series "hidden" state: ("hidden" state object is accessible via series' shortcut accessor hiddenState)
series1.hiddenState.transitionDuration = 5000;
series1.hiddenState.transitionDuration = 5000;
{
  // ...
  "series": [{
    // ...
    "hiddenState": {
       "transitionDuration": 5000
    }
  }, {
    // ...
  }]
}
We're basically telling our first series: "make your hiding animation take 5 seconds". Normally, you would not make your users suffer through 5 seconds of slow motion series hiding, but we're going to use this here, so that you see what's going on.
Now, when Series #1 is hidden, we'll see it gradually fade out over the course of 5 seconds. We haven't set anything for Series #2. So, whenever it is hidden it will just vanish instantly.
Let's try it out on a live chart. Click Legend's items to toggle both of the series and see how the hiding differs.
See the Pen amCharts V4: Animations (2) by amCharts (@amcharts) on CodePen.
While toggling series in the example above, you might have noticed, that Series #1 fades out when it is hidden, but pops back in instantaneously when it is toggled on. This is because we have set transitionDuration on a "hidden" state, but haven't done so for series' "default" state - a state that is applied to the object when it isn't in any other state. To make it complete our code would probably have to look like this:
series1.defaultState.transitionDuration = 5000;
series1.hiddenState.transitionDuration = 5000;
series1.defaultState.transitionDuration = 5000;
series1.hiddenState.transitionDuration = 5000;
{
  // ...
  "series": [{
    // ...
    "hiddenState": {
      "transitionDuration": 5000
    },
    "hiddenState": {
       "transitionDuration": 5000
    }
  }, {
    // ...
  }]
}
See the Pen amCharts V4: Animations (3) by amCharts (@amcharts) on CodePen.
NOTE "Default" state is applied when the chart first loads, hence the initial animation on our Series #1.
MORE INFO Make sure you check out our article "States" for further info about this concept.
"interpolationDuration"
If transitionDuration was timing to transit between visual states, the interpolationDuration is time (in milliseconds) taken to animate data values.
For example, whenever data values change, for example you have changed your source data, or when you hide, say, a series, its values become zeroes, so it no longer influences axis scales and stacks that might be going on.
If interpolationDuration is zero, such value transitions happen instantly. No animations.
However, if we set it to some value, the changes will happen gradually, which will result in a nice animation.
Extending our previous example, let's enable interpolationDuration for our Series #1.
NOTE interpolationDuration is a property set directly on an object in question, not on its state.
series1.interpolationDuration = 5000;
series1.interpolationDuration = 5000;
{
  // ...
  "series": [{
    // ...
    "interpolationDuration": 500
  }, {
    // ...
  }]
}
See the Pen amCharts V4: Animations (4) by amCharts (@amcharts) on CodePen.
Notice, how instead of just fading in, Series #1 now also shrinks down when hidden, and back up when toggled on.
Sequenced VS linear interpolation
To make things even more interesting, interpolation can be either linear or sequenced. The latter is default.
This setting is controlled by element's sequencedInterpolation boolean property.
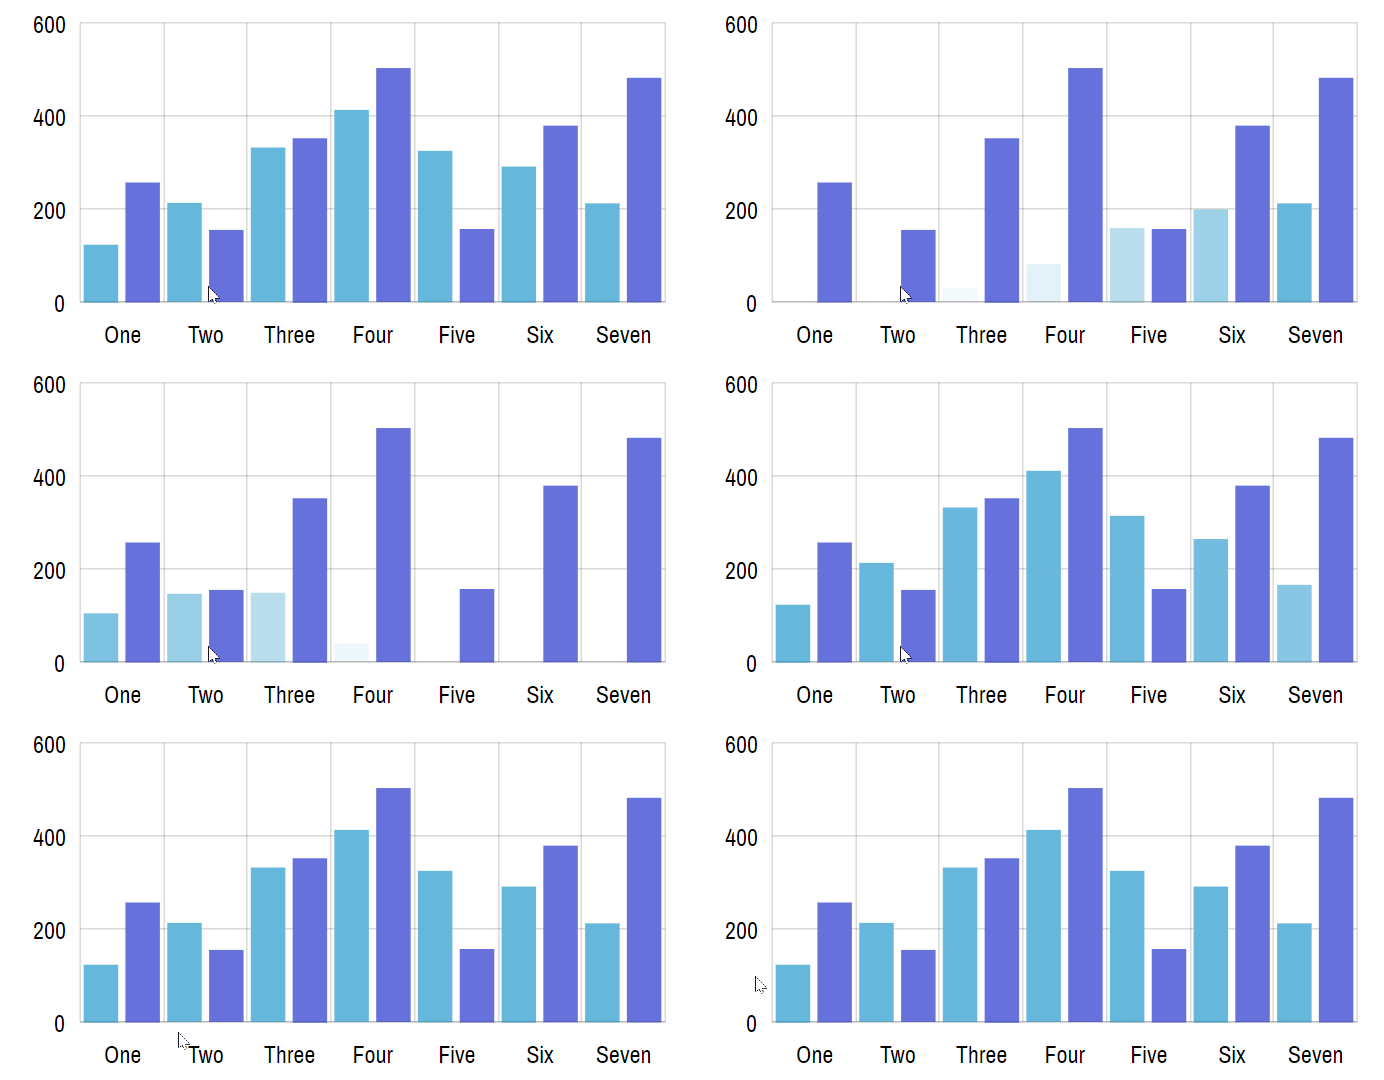
Linear interpolation (sequencedInterpolation = false) means all animations will happen in parallel. E.g. all columns in a Column series will start growing and finish at the same time:
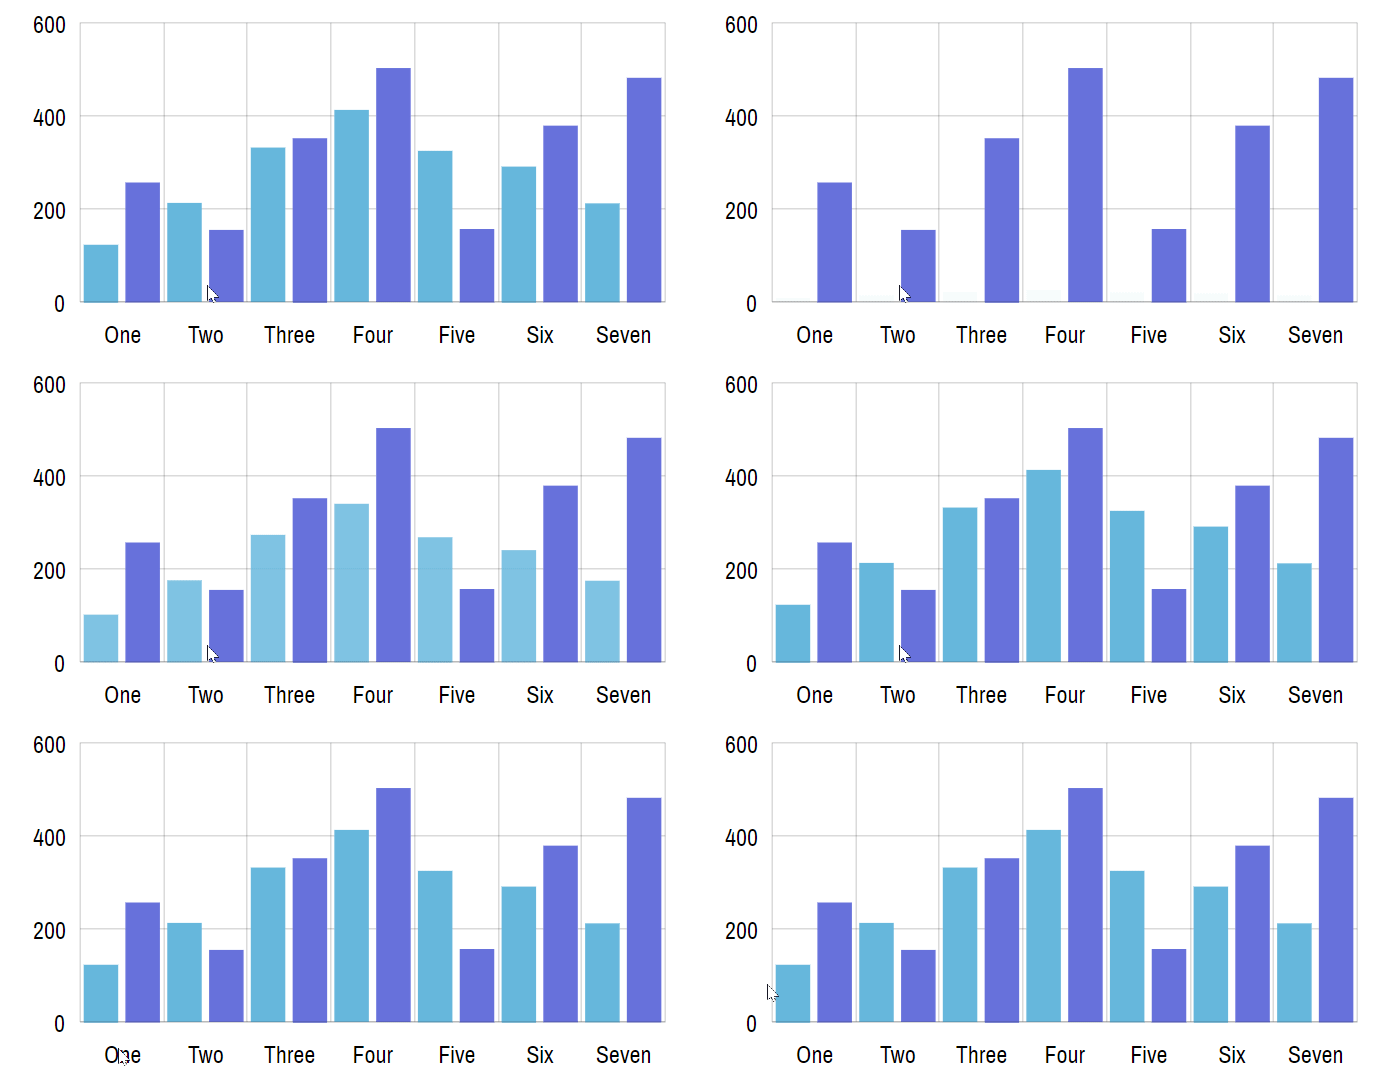
series.sequencedInterpolation = falseSequenced interpolation (sequencedInterpolation = true) means each subsequent element will start animating after a small delay, as defined in interpolationDelay.
series.sequencedInterpolation = true"animationDuration"
transitionDuration was applicable only to States. interpolationDuration was applicable to most of the elements that use data.
animationDuration is relevant to only few types of elements that have moving parts. Let's look at all of them.
Tooltip
A Tooltip is a shared balloon-like element that displays context-related information. E.g. when you hover over a column in Column series, it may display a value of column.
When you shift your hover from one element to another, the Tooltip moves to a new location.
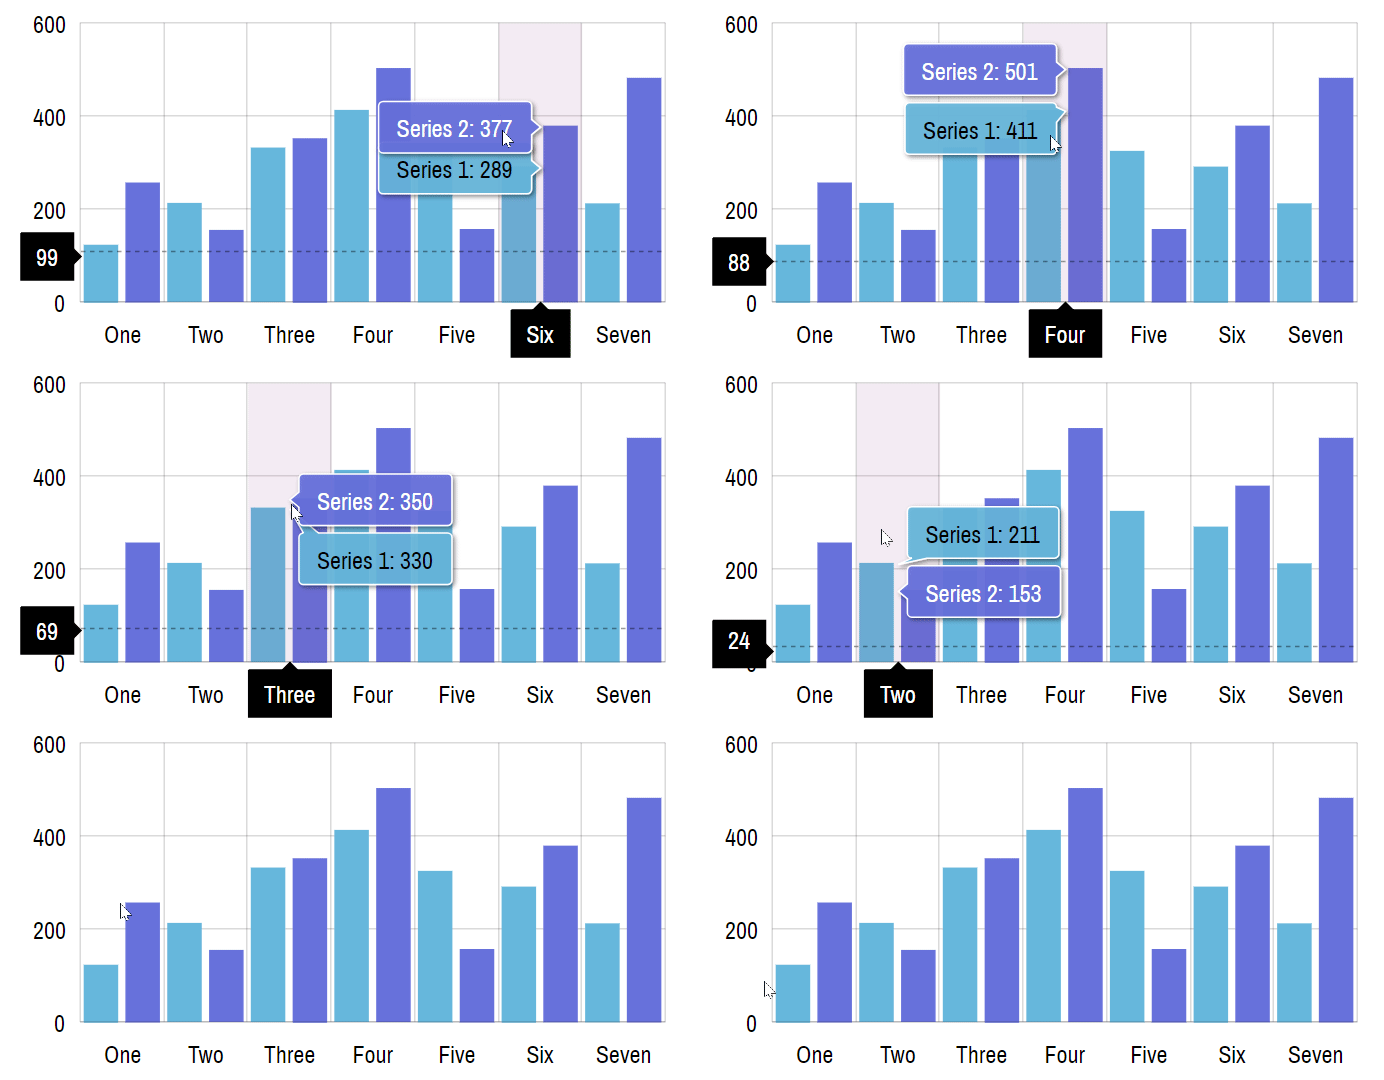
animationDuration determines how fast that happens.
Value of 0 will mean Tooltip will jump to a new location instantly, while any non-zero value will make Tooltip "glide over" to a new location.
As with other "duration" settings, the value is time in milliseconds, and is relative to a Tooltip setting for the particular element:
series1.tooltip.animationDuration = 500;
series2.tooltip.animationDuration = 500;
series1.tooltip.animationDuration = 500;
series2.tooltip.animationDuration = 500;
{
  // ...
  "series": [{
    // ...
    "tooltip": {
      "animationDuration": 500
    }
  }, {
    // ...
    "tooltip": {
      "animationDuration": 500
    }
  }]
}
series.tooltip.animationDuration = 0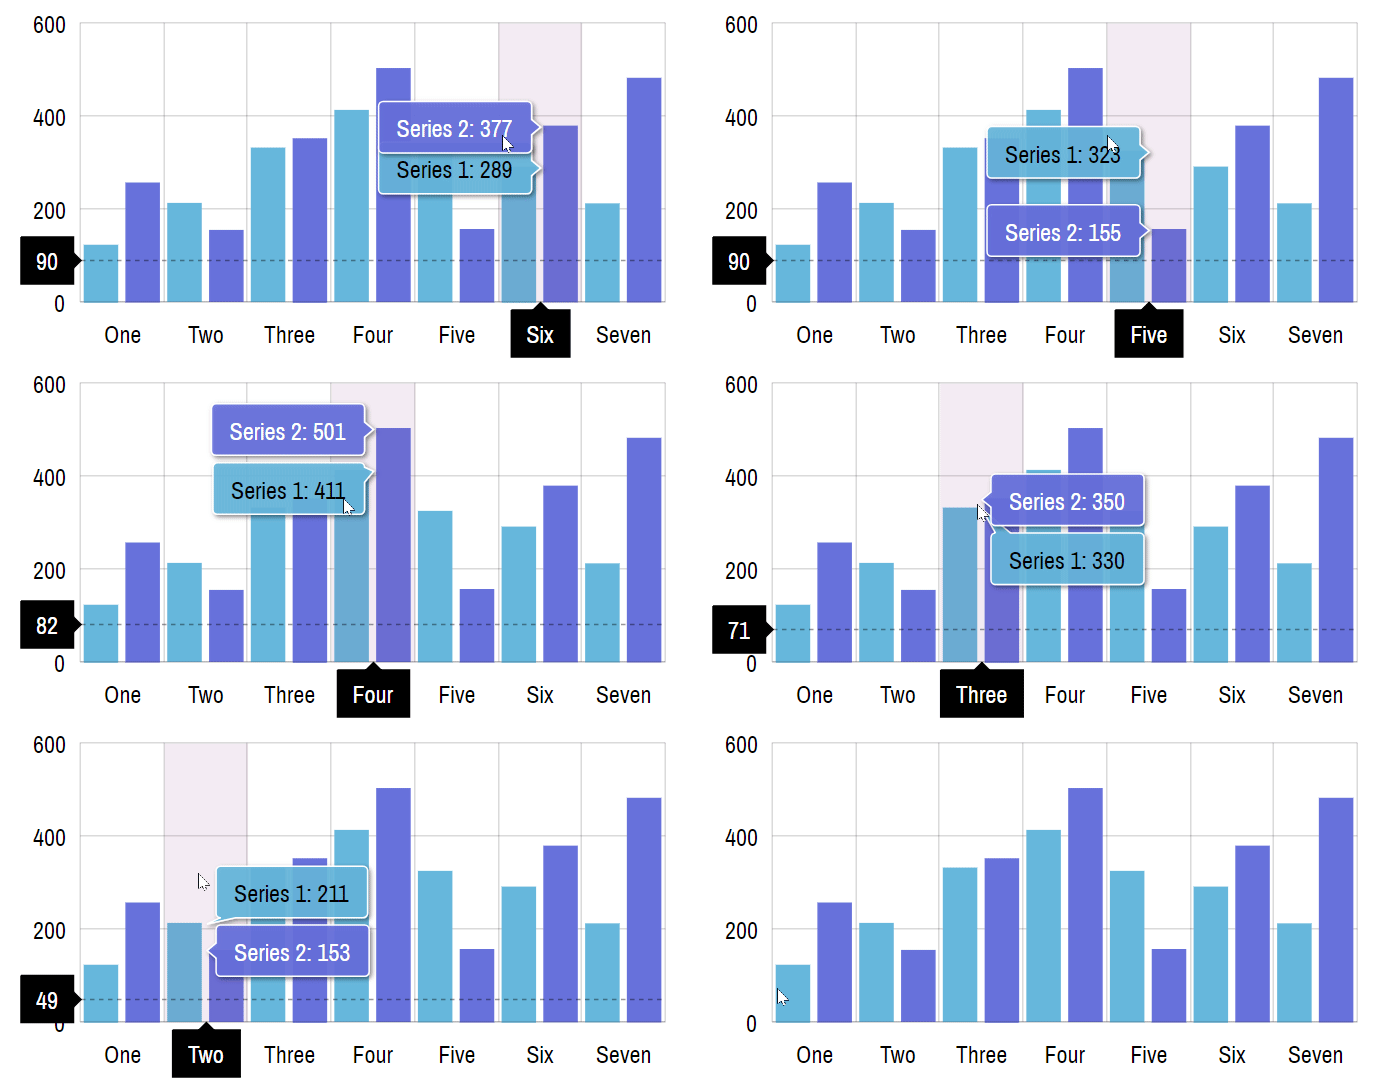
series.tooltip.animationDuration = 500Chart Scrollbar
Scrollbar does move itself, but it has a lot of moving parts: two grips and a fill in-between them.
These can move on a number of occasions, e.g. you double click on the fill to zoom-out chart, or click on a non-selected part to move selection. The chart can be zoomed some other tool, like Cursor, in which case Scrollbar needs to adjust to the new zoom.
That's where animationDuration comes into play. It determines how fast those elements move into their positions.
Zero value will mean that they will jump to their new places instantaneously. Non-zero value will make their position to be animated.
Again, the setting value is in milliseconds, and is set directly on the element in question, e.g. Scrollbar instance:
chart.scrollbarX = new am4core.Scrollbar();
chart.scrollbarX.animationDuration = 500;
chart.scrollbarX = new am4core.Scrollbar();
chart.scrollbarX.animationDuration = 500;
{
  // ...
  "scrollbarX": {
    "type": "Scrollbar",
    "animationDuration": 500
  }
}
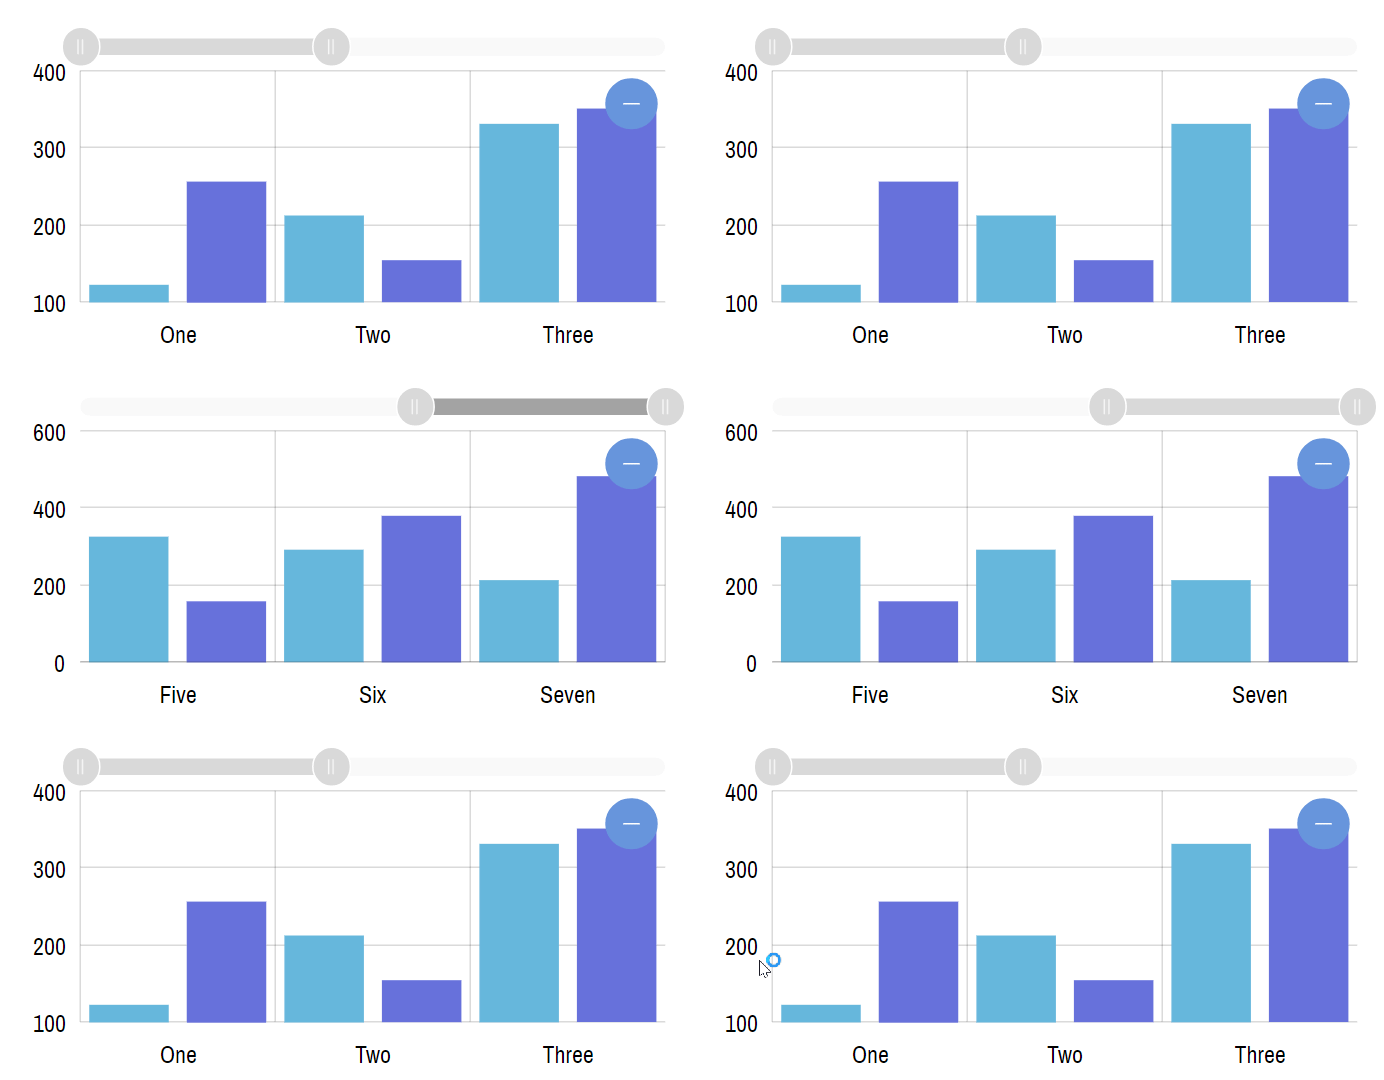
chart.scrollbarX.animationDuration = 0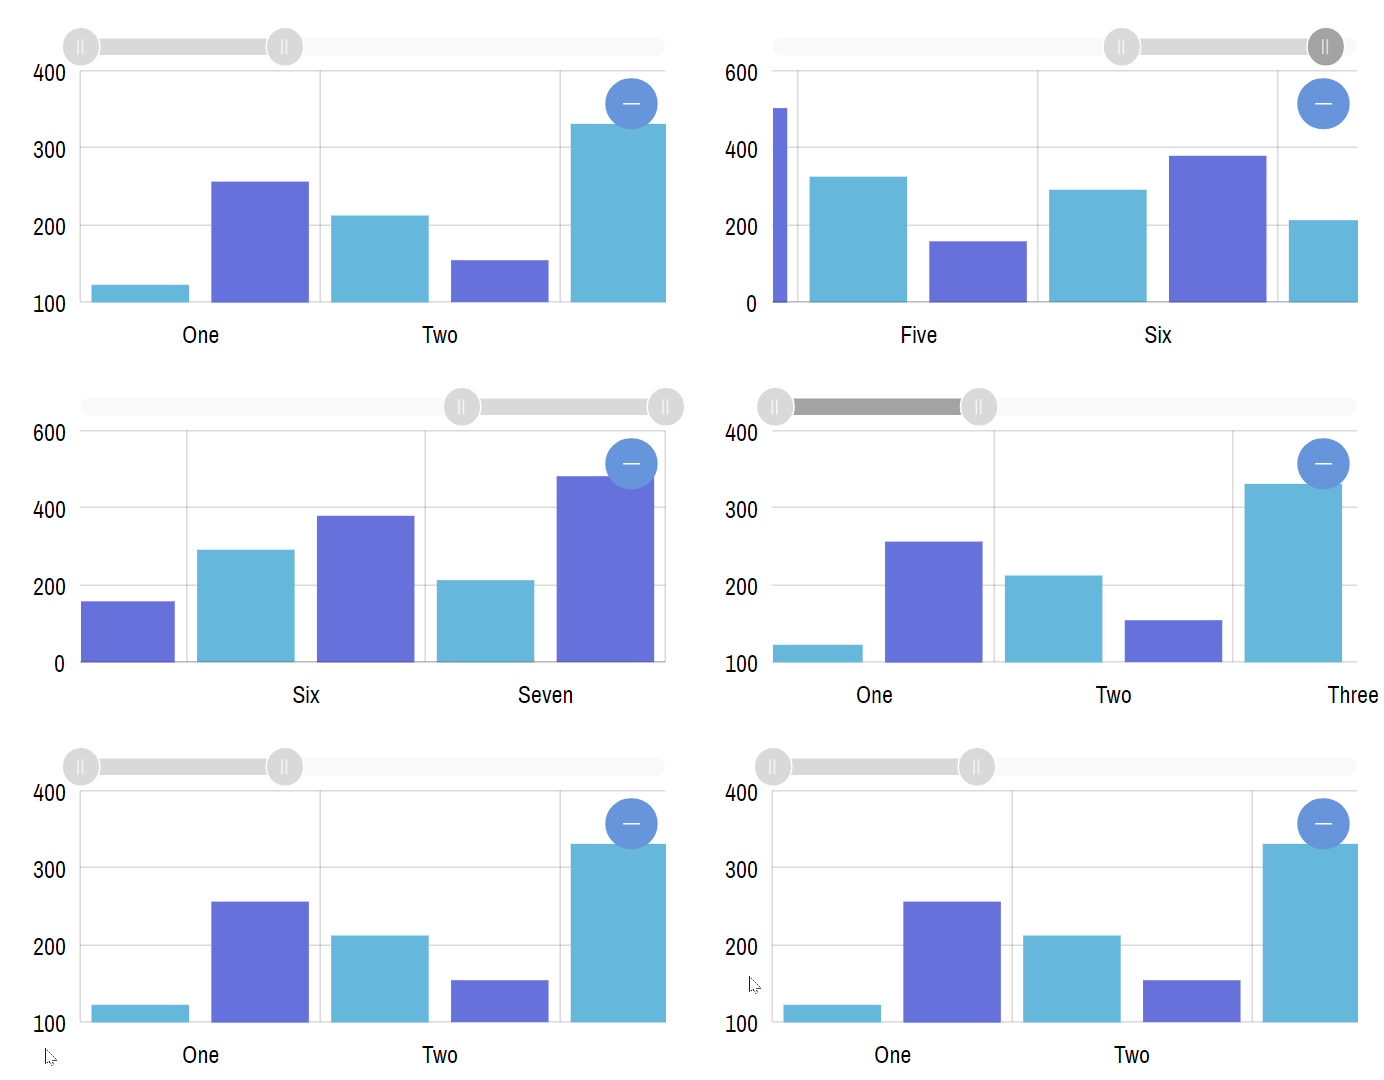
chart.scrollbarX.animationDuration = 500"rangeChangeDuration"
The last of our four animation-related settings is rangeChangeDuration.
Whenever a chart is zoomed or panned, at least one of its axis is affected.
For example, we start off with completely zoomed out chart which shows vertical Value axis at its complete value range, since we have all of the available data items on screen. Say, we have values from 0 to 1000.
Suppose we zoom in. Now, we have fewer data items on screen, and possibly different range of values. Say, from 400 to 600.
Our Value axis adjusts its scale accordingly - its "range changes".
rangeChangeDuration determines how this plays out on screen.
If it's set to zero (0), the scale change is instantaneous.
However, if it's set to some non-zero value (in milliseconds), the scale will smoothly transit from it's current range of values, to the new target range, resulting in a nice animation, where axis itself and all related series animate into their new positions.
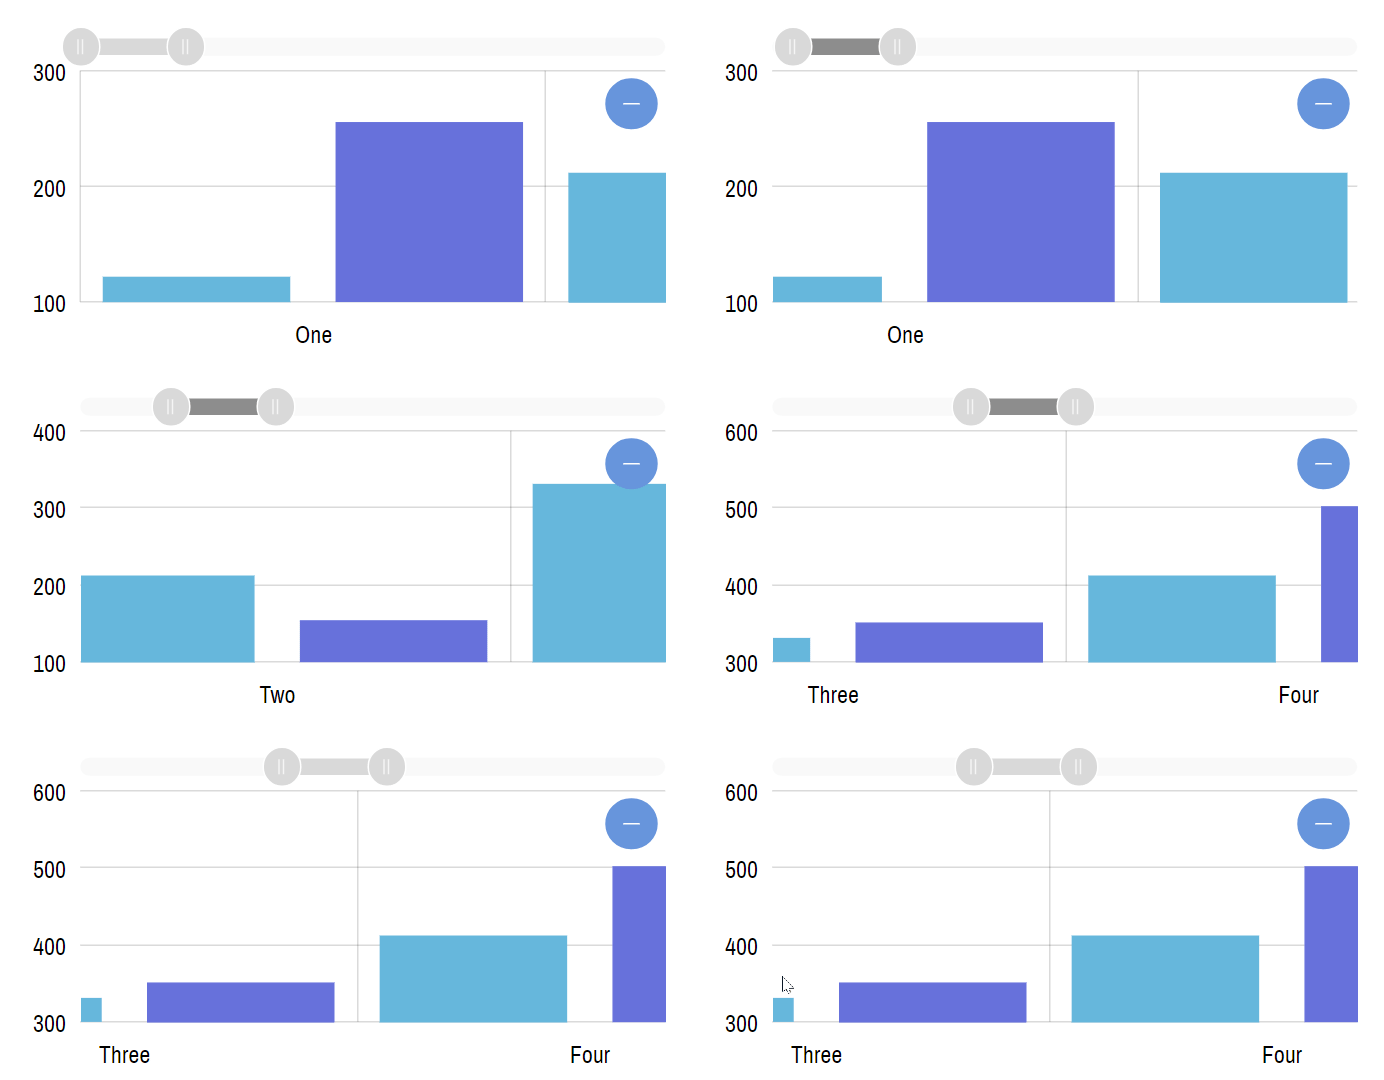
valueAxis.rangeChangeDuration = 0;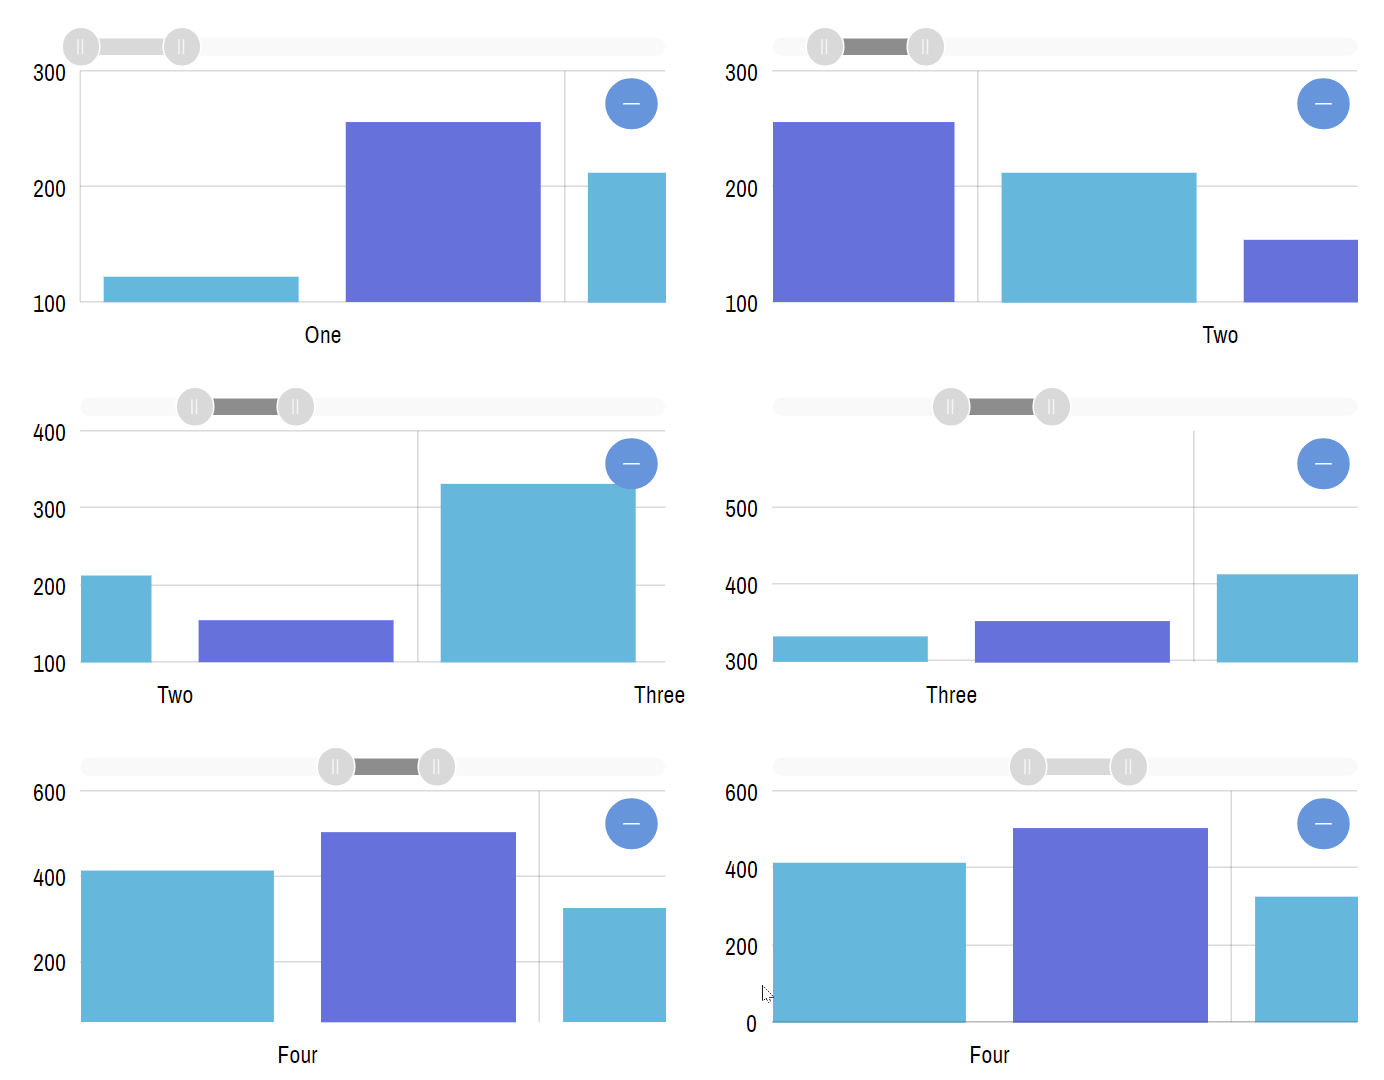
valueAxis.rangeChangeDuration = 500;Animation-able values
When state is applied or properties are animated manually, only certain types of values can be transited smoothly. Refer to below table for a list of "animate-able" value types:
| Type | Comment |
|---|---|
number |
Any numeric value, including negative ones. When animating, the value will transit gradually from start to end value. |
Color |
A color as expressed by a Color object. When animating it will interpolate intermediate color between current color and target color. |
Percent |
A relative value in form of a Percent object. |
any |
Any other types will not have any intermediate values. The target value will be applied on animation end, e.g. after transitionDuration. |
Advanced usage
Animating properties via API
There might be cases where we want to occasionally animate just one property from one value to another.
It might be worth considering creating a State and applying it.
If that seems like an unnecessary overhead, you can animate an element's properties using its animate() method.
The function takes 3 parameters:
| Parameter | Type | Comment |
|---|---|---|
options |
ISpriteAnimationOptions or ISpriteAnimationOptions[] |
A single object if we want to animate just one property, or an array of objects.
Sample structure of the animation object: {
"from": 0,
"to": 1,
"property": "fillOpacity"
}
|
duration |
number |
Duration (in milliseconds) the animation should play. |
easing (optional) |
function |
Easing function. See next section about easing. |
Using easing functions
In previous sections, in order to maintain relative simplicity, we deliberately left out some of the animation-related properties.
Those are properties, related to "easing functions".
An easing function is a function which manipulates speed of the animation based on the animation's progress.
For example, easeOut function will slow down animation at the very end, which feels more natural. Like a car slows down before stopping.
Every *Duration property has a cousin *Easing property, which it uses for animations.
amCharts 4 comes pre-bundled with a number of easing functions, all accessible via am4core.ease.* name-space:
| Easing Function | |||
|---|---|---|---|
linear |
quadIn |
quadOut |
quadInOut |
polyIn |
polyOut |
polyInOut |
polyIn3 |
polyOut3 |
polyInOut3 |
expIn |
expOut |
expInOut |
sinIn |
sinOut |
sinInOut |
cubicIn |
cubicOut |
cubicInOut |
circleIn |
circleOut |
circleInOut |
bounceIn |
bounceOut |
bounceInOut |
elasticIn |
elasticOut |
elasticInOut |
Set it like you would set any other property:
series1.hiddenState.transitionDuration = 5000;
series1.hiddenState.transitionEasing = am4core.ease.elasticInOut;
series1.hiddenState.transitionDuration = 5000;
series1.hiddenState.transitionEasing = am4core.ease.elasticInOut;
{
  // ...
  "series": [{
    // ...
    "hiddenState": {
       "transitionDuration": 5000,
       "transitionEasing": am4core.ease.elasticInOut
    }
  }, {
    // ...
  }]
}
You can use your own custom functions as well. Your function should accept a number parameter which indicates progress, and return another number that indicates position in the value range you should use.