Word clouds help visualize weight or importance of individual words from a keyword list or text.

Creating a Word Cloud
To create a Word Cloud you will only need just three things:
- A chart instance.
- A series.
- List of keywords OR a text.
This is a minimum requirement for the chart. We'll go over each of those shortly.
Version info
Word Cloud is available in amCharts 4 since version 4.1.10.
Importing modules/scripts
Needless to say, before you can use modules/objects, you need to make sure all required modules (in TypeScript), or files (in JavaScript) are imported. Please refer to our Getting started articles for more details:
Word Cloud comes in a form of a plugin. To start using it we will need to include both core (main module) and charts modules, as well as wordCloud plugin.
import * as am4core from "@amcharts/amcharts4/core";
import * as am4charts from "@amcharts/amcharts4/charts";
import * as am4plugins_wordCloud from "@amcharts/amcharts4/plugins/wordCloud";
<script src="//cdn.amcharts.com/lib/4/core.js"></script>
<script src="//cdn.amcharts.com/lib/4/charts.js"></script>
<script src="//cdn.amcharts.com/lib/4/plugins/wordCloud.js"></script>
We'll be importing and referring these as am4core, am4charts, and am4plugins_wordCloud in the course of this article, and overall in our demos and tutorials.
Creating chart instance
For that we're going to be using am4core.create() function. (or am4core.createFromConfig() if you are using JSON-based config approach)
let chart = am4core.create("chartdiv", am4plugins_wordCloud.WordCloud);
var chart = am4core.create("chartdiv", am4plugins_wordCloud.WordCloud );
var chart = am4core.createFromConfig({
  // ... chart config
}, "chartdiv", am4plugins_wordCloud.WordCloud);
Creating a series
As we mentioned earlier, the chart needs to have at least one series. It is created just like on any other serial chart: create a series object (in this case it's WordCloudSeries) and push it to chart's series list:
let series = chart.series.push(new am4plugins_wordCloud.WordCloudSeries());
var series = chart.series.push(new am4plugins_wordCloud.WordCloudSeries());
{
  "series": [{
    "type": "WordCloudSeries"
  }]
}
The data in Word Cloud is always set to the series. We'll see how, in the next chapter.
Data
There are two ways to add data to a Word Cloud: via plain text or as a structured array. Let's cover both.
Plain text
Setting text
The Word Cloud chart can extract words and their weight - number of times the word was used - from a text.
To do that, simply set text property of the series. The chart will do the rest.
series.text = "Lorem impsum...";
series.text = "Lorem impsum...";
{
  "series": [{
    "type": "WordCloudSeries",
    "text": "Lorem impsum..."
  }]
}
That's all that is needed for a minimal operation of the chart. Let's try it out.
See the Pen amCharts 4: Word Cloud by amCharts team (@amcharts) on CodePen.
Configuring text parser
By default, text parser will take and show every single word in the text.
You can tweak it to your needs using a number of options, like limiting number of words shown, or requiring word to be of certainly length, or even excluding particular words from the results.
We've outlined some of the most important settings in the below table:
| Setting | Type | Default | Comment |
|---|---|---|---|
excludeWords |
string[] |
[] |
Do not include these words in the cloud. |
maxCount |
number |
- |
Maximum number of words to show. The words with least occurrences will be removed from results first |
minValue |
number |
1 |
Include words with at least X occurrences. |
minWordLength |
number |
1 |
Minimum number of characters in a word to be included in results. |
Let's try eliminating most common words and restrict word length:
series.maxCount = 100;
series.minWordLength = 2;
series.excludeWords = ["the", "an", "to"];
series.maxCount = 100;
series.minWordLength = 2;
series.excludeWords = ["the", "an", "to"];
{
  "series": [{
    // ...
    "maxCount": 100,
    "minWordLength": 2,
    "excludeWords": ["the", "an", "to"]
  }]
}
See the Pen amCharts 4: Word Cloud by amCharts team (@amcharts) on CodePen.
Using structured data
You can also go around Word Cloud's text parser and pass in your list of words along their weights.
A data consists of an array of objects. Each object represents a word and has to have at least two keys: word (the word) and value (number of times word appear, or its weight).
Sample data
[{
  "tag": "Breaking News",
  "weight": 60
}, {
  "tag": "Environment",
  "weight": 80
}, {
  "tag": "Politics",
  "weight": 90
}, {
  "tag": "Business",
  "weight": 25
}, {
  "tag": "Lifestyle",
  "weight": 30
}, {
  "tag": "World",
  "weight": 45
}, {
  "tag": "Sports",
  "weight": 160
}, {
  "tag": "Fashion",
  "weight": 20
}, {
  "tag": "Education",
  "weight": 78
}]
Setting and configuring data
You set it directly to series data property.
series.data = [
  // ...
];
series.data = [
  // ...
];
{
  "series": [{
    // ...
    "data": [
      // ...
    ]
  }]
}
NOTE The chart assumes the data to be pre-filtered good data. It will not apply filter settings like minWordLength discussed in the previous section.
Like with any other Series, we also need to tell our series where in data to look for words and their weight.
For that we need to set up series' data fields.
Say we have "tag" and "weight" fields that have word and their weight respectively in our data. We'll need to set up Series' dataFields accordingly:
series.dataFields.word = "tag";
series.dataFields.value = "weight";
series.dataFields.word = "tag";
series.dataFields.value = "weight";
{
  "series": [{
    // ...
    "dataFields": {
      "word": "tag",
      "value": "weight"
    }
  }]
}
See the Pen amCharts 4: Word Cloud by amCharts team (@amcharts) on CodePen.
Configuring
Layout
There is a number of settings that affect how words in the Word Cloud series are laid out.
| Setting | Type | Default | Comment |
|---|---|---|---|
minFontSize |
number | Percent |
2% |
The size of the smallest words. It can be set in pixels, or in When using percent value, it will take series width or height (whichever is smaller) as a reference point. |
maxFontSize |
number | Percent |
20% |
The size of the biggest words. It can be set in pixels, or in When using percent value, it will take series width or height (whichever is smaller) as a reference point. |
accuracy |
number (0 - x) |
5 |
How accurate Word Cloud will be when searching for suitable place for a word. The higher the accuracy - the more closely packed word will be. Please note, higher accuracy comes at a cost of performance. Find your middle ground. |
randomness |
number (0-1) |
0.2 |
How scattered words should be. Zero means no randomness - all biggest words will be concentrated in the middle with smallest on the outside. 1 means complete randomness, or each word can appear anywhere, regardless of its weight. |
Below figures show how randomness affects the layout of the cloud:
Appearance
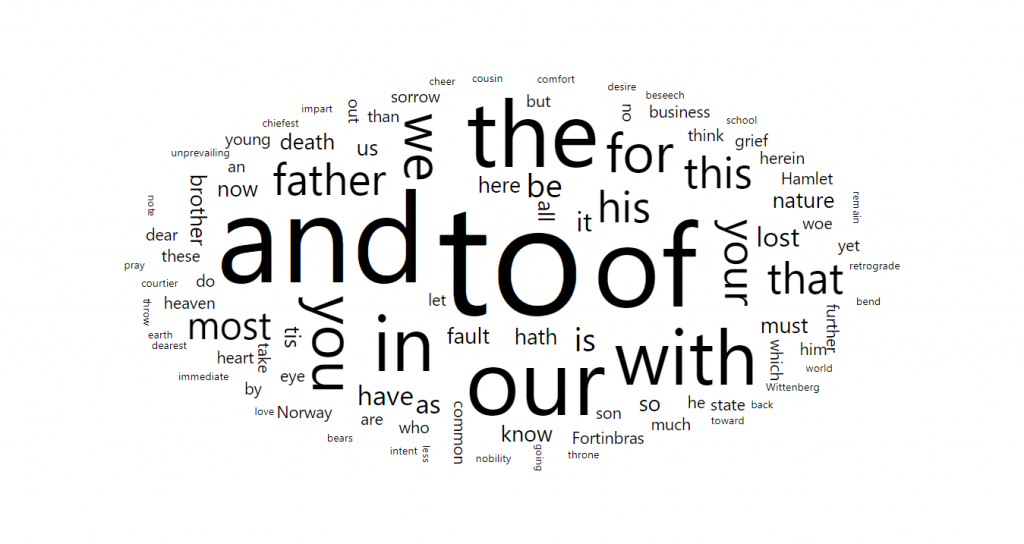
randomness = 0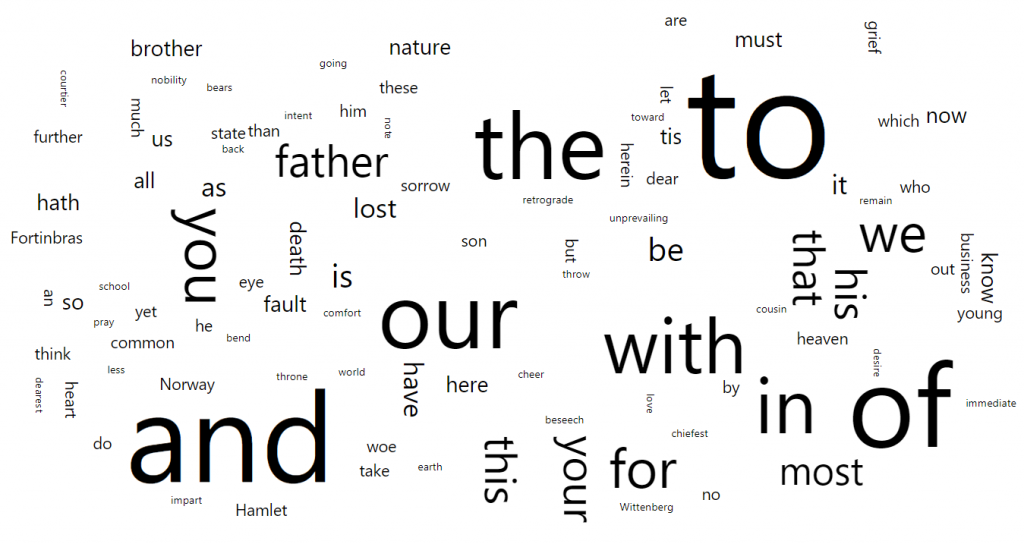
randomness = 0.9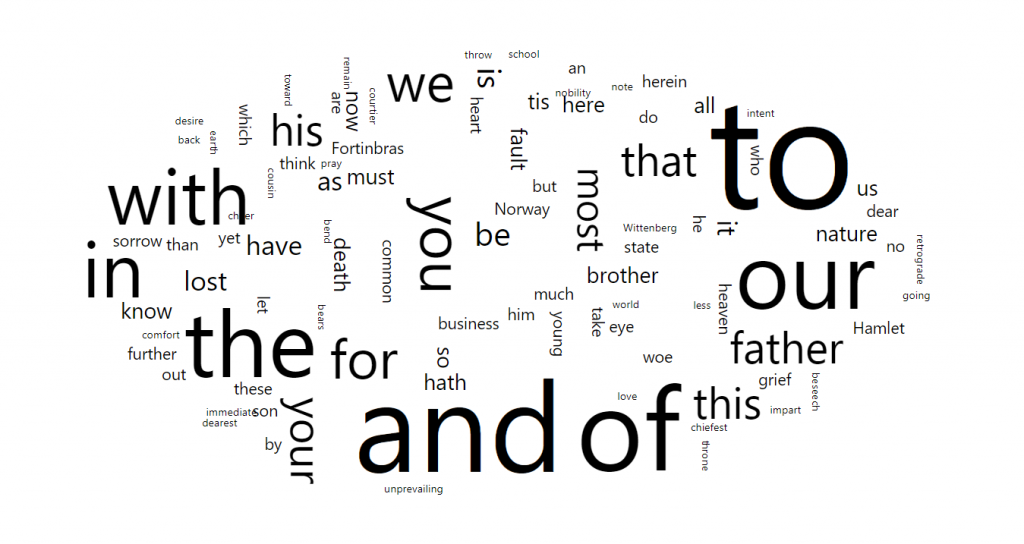
randomness = 0.5Rotation
Word Cloud will alternate angle of words for a better fit. This will result in some words being horizontal, and some vertical.
Let's see how we can control this process.
Setting possible angles
Series property responsible for identifying possible angles is named predictably angles.
It's an array of numbers, and the default is [0, 0, 90] meaning that words can come at zero (horizontal) or 90 (vertical) angle, with the former coming twice as much because it is listed twice.
In current version no other angles than 0 and 90 is supported.
To make all words horizontal, set it to [0]. To make all vertical, use [90].
Rotation threshold
Here's a thing: long words don't look good when positioned vertically. For that reason, longer words are always drawn horizontally.
The setting which controls this behavior is rotationThreshold. It's a number between 0 and 1 (default is 0.7).
It sets a threshold relative to series height. If word length exceeds series height * rotationThreshold, the word will not be rotated.
Rotating whole series
Even though non-horizontal/vertical angles are not supported, the whole series can easily be rotated to achieve intermediate angle effect.
We can apply a custom angle to whole series, by setting rotation on series' labelContainer:
series.labelsContainer.rotation = -45;
series.labelsContainer.rotation = -45;
{
  "series": [{
    // ...
    "labelsContainer": {
      "rotation": -45
    }
  }]
}
See the Pen amCharts 4: Word Cloud by amCharts team (@amcharts) on CodePen.
Colors
By default, all words in a Word Cloud are drawn in standard text color, which is set by theme, and is usually black.
Let's see what options we have in manipulating it.
Setting color for the whole series
The easiest way to set color that would be applied to all the words is to set fill setting directly on a series's labels template:
series.labels.template.fill = am4core.color("#9F6BA0");
series.labels.template.fill = am4core.color("#9F6BA0");
{
  "series": [{
    // ...
    "labels": {
      "fill": "#9F6BA0"
    }
  }]
}
Auto-assigning colors from theme list
The above code will set a custom color, but all words will still be colored identically.
We can use theme's color list to rotate colors and assign each one from a "color set". (more about color sets)
To enable that, we need to assign a ColorSet object to series' colors property.
series.colors = new am4core.ColorSet();
series.colors.passOptions = {};
series.colors.reuse = true;
series.colors = new am4core.ColorSet();
series.colors.passOptions = {};
series.colors.reuse = true;
{
  "series": [{
    // ...
    "colors": {
      "type": "ColorSet",
      "passOptions": {},
      "reuse": true
    }
  }]
}
NOTE The two subsequent lines ensure that Color Set will rotate the same colors when it runs out, instead of trying to come up with new colors.
See the Pen amCharts 4: Word Cloud by amCharts team (@amcharts) on CodePen.
Colors via data
We can also control which word gets what color by specifying colors in our data, and with a little help of property fields.
Property fields is a way to attach almost any property of the target element (words) to a field in data. E.g.:
series.labels.template.propertyFields.fill = "color";
series.labels.template.propertyFields.fill = "color";
{
  "series": [{
    // ...
    "labels": {
      "propertyFields": {
        "fill": "color"
      }
    }
  }]
}
See the Pen amCharts 4: Word Cloud by amCharts team (@amcharts) on CodePen.
Using heat rules
It's also possible to modify word color based on its position within the range of weights from total words in the series.
For that we can use "heat rules". Our "Heatmaps" section of "Series" article has more details, but basically, heat rules allow assigning an intermediate value in the spectrum of values based on item's value.
In our case we can automatically make more important words "hotter".
series.heatRules.push({
 "target": series.labels.template,
 "property": "fill",
 "min": am4core.color("#ffaaaa"),
 "max": am4core.color("#ff5555"),
 "dataField": "value"
});
series.heatRules.push({
 "target": series.labels.template,
 "property": "fill",
 "min": am4core.color("#ffaaaa"),
 "max": am4core.color("#ff5555"),
 "dataField": "value"
});
{
  "series": [{
    // ...
    "heatRules": [{
      "target": "labels.template",
      "property": "fill",
      "min": "#ffaaaa",
      "max": "#ff5555",
      "dataField": "value"
    }]
  }]
}
See the Pen amCharts 4: Word Cloud by amCharts team (@amcharts) on CodePen.
You're note limited to just color, though. You can use any quantifiable property for those as well, such as opacity, and many others. You can also combine several heat rules.
Using events
Adding events
Word Cloud has a few unique events up its sleeve. Let's learn what they are and how we can use them.
When chart is laying out the words, they appear one by one. There are events that are triggered when this operation starts, progresses, and ends.
| Event | Comment |
"arrangestarted" | Invoked when arranging of words starts. |
"arrangeprogress" | Invoked after each words is drawn. Object, passed into handler will also have progress property. |
"arrangeended" | Invoked when all words are arranged. |
NOTE These are events of WordCloudSeries, not the chart itself.
series.events.on("arrangestarted", function(ev) {
  console.log("start");
});

series.events.on("arrangeended", function(ev) {
  console.log("end");
});

series.events.on("arrangeprogress", function(ev) {
  console.log(ev.progress);
});
series.events.on("arrangestarted", function(ev) {
  console.log("start");
});

series.events.on("arrangeended", function(ev) {
  console.log("end");
});

series.events.on("arrangeprogress", function(ev) {
  console.log(ev.progress);
});
{
  // ...
  "series": [{
    // ...
    "events": {
      "arrangestarted": function(ev) {
        console.log("start");
      },
      "arrangeended": function(ev) {
        console.log("end");
      },
      "arrangeprogress": function(ev) {
        console.log(ev.progress);
      },
    }
  }]
}
Displaying progress indicator
Now, let's put those events to good use: display a progress indicator while series is getting its ducks... eh words in a row.
We're going to use a built-in Preloader.
series.events.on("arrangestarted", function(ev) {
  ev.target.baseSprite.preloader.show(0);
});

series.events.on("arrangeprogress", function(ev) {
  ev.target.baseSprite.preloader.progress = ev.progress;
});
series.events.on("arrangestarted", function(ev) {
  ev.target.baseSprite.preloader.show(0);
});

series.events.on("arrangeprogress", function(ev) {
  ev.target.baseSprite.preloader.progress = ev.progress;
});
{
  // ...
  "series": [{
    // ...
    "events": {
      "arrangestarted": function(ev) {
        ev.target.baseSprite.preloader.show(0);
      },
      "arrangeprogress": function(ev) {
        ev.target.baseSprite.preloader.progress = ev.progress;
      },
    }
  }]
}
NOTE We don't need "arrangeended" event since Preloader will hide itself when progress reaches 100% (1).
See the Pen amCharts 4: Word Cloud by amCharts team (@amcharts) on CodePen.
Advanced topics
Displaying weight next to label
A Word Cloud label is just like any other Label which means we can do binding to data.
OK, so we're going to display word's weight by binding it to value data using curly brackets.
series.labels.template.text = "{word} {value}";
series.labels.template.text = "{word} {value}";
{
  "series": [{
    // ...
    "labels": {
      "text": "{word} {value}"
    }
  }]
}
See the Pen amCharts 4: Word Cloud by amCharts team (@amcharts) on CodePen.
Hyperlinking words
To add a hyperlink to any object on the chart, we can use url property. We can also use urlTarget if we want links to open in a new window, rather than current one.
So, if we want to link our words to some URL, we need to set url of the labels template.
Best of all, url accepts the same curly bracket data bindings as the text, so we can make URLs dynamic:
series.labels.template.url = "https://stackoverflow.com/questions/tagged/{word}";
series.labels.template.urlTarget = "_blank";
series.labels.template.url = "https://stackoverflow.com/questions/tagged/{word}";
series.labels.template.urlTarget = "_blank";
{
  "series": [{
    // ...
    "labels": {
      // ...
      "url": "https://stackoverflow.com/questions/tagged/{word}",
      "urlTarget": "_blank"
    }
  }]
}
See the Pen amCharts 4: Tag cloud by amCharts team (@amcharts) on CodePen.
Enabling tooltips
We can also enable tooltips to be displayed when hovering the word.
For that, we use tooltipText property of the word template. Just like text and url we looked at earlier, it accepts data binding using curly brackets, as well as in-line formatting using square bracket options.
series.labels.template.tooltipText = "{word}:\n[bold]{value}[/]";
series.labels.template.tooltipText = "{word}:\n[bold]{value}[/]";
{
  "series": [{
    // ...
    "labels": {
      // ...
      "tooltipText": "{word}:\n[bold]{value}[/]"
    }
  }]
}
See the Pen amCharts 4: Tag cloud by amCharts team (@amcharts) on CodePen.