TreeMap is a great way to represent distribution of values among hierarchical categories in a clear and compact format.
This article will walk you through steps required to create TreeMaps in amCharts 4.
Creating a TreeMap chart
To create a TreeMap chart you will only need just three things:
- A chart instance;
- Data for the chart;
- Defined data fields.
This is a minimum requirement for the chart. We'll go over each of those shortly.
Importing modules/scripts
Needless to say, before you can use modules/objects, you need to make sure all required modules (in TypeScript), or files (in JavaScript) are imported. Please refer to our Getting started articles for more details:
For a TreeMap chart, we'll need to import core (main module) and charts modules.
import * as am4core from "@amcharts/amcharts4/core";
import * as am4charts from "@amcharts/amcharts4/charts";
<script src="//cdn.amcharts.com/lib/4/core.js"></script>
<script src="//cdn.amcharts.com/lib/4/charts.js"></script>
We'll be importing and referring these as am4core and am4charts in the course of this article, and overally in our demos and tutorials.
Creating chart instance
For that we're going to be using am4core.create() function. (or am4core.createFromConfig() if you are using JSON-based config approach)
let chart = am4core.create("chartdiv", am4charts.TreeMap);
var chart = am4core.create("chartdiv", am4charts.TreeMap);
var chart = am4core.createFromConfig({
  // ... chart config
}, "chartdiv", am4charts.TreeMap);
Data
Data structure
TreeMap, just like most charts, use an array of objects as the data.
As we will see later in this article data for a TreeMap can be multi-level, since the chart itself can be hierarchical.
More about that later. Let's start with a basic data example.
There's only one thing that TreeMap needs to know about each of its items - a numeric value.
Just like on a Pie chart, the value determines how much of a total chart space this particular item will take, by comparing its value to the values of other items.
For example a TreeMap with two items with values 60 and 40 will display two squares: one will take up 60% of the space of the chart, while the other one will take up the rest 40%.
Let's see take a very basic example of a 5-item TreeMap data:
[{
  "value": 190
}, {
  "value": 289
}, {
  "value": 635
}, {
  "value": 732
}, {
  "value": 835
}];
NOTE The actual fields do not necessarily have to be named "value". You can name them anything, and then just instruct the chart which fields to us, as we will see later in this article in a section about "data fields".
Item names in data
While we only need values to draw the chart, it would also be nice to name our items, so that it's not just plain squares.
For that we can add names to our data as well:
[{
  "name": "First",
  "value": 190
}, {
  "name": "Second",
  "value": 289
}, {
  "name": "Third",
  "value": 635
}, {
  "name": "Fourth",
  "value": 732
}, {
  "name": "Fifth",
  "value": 835
}]
NOTE Again, actual name of the field does not matter, as we will need to use "data fields" to specify what type of data is in what field.
Multi-level data
As we might have already mentioned several times, TreeMap chart is not limited to a single level. Each item can have sub-items. Those can have sub-items of their own.
When an item has sub-items, let's call them children, the square for the item becomes a mini-TreeMap itself, acting as area for its children.
A data for multi-level TreeMap is also multi-level.
If an item has children, it has a field in data which will hold an array of items. E.g.:
[{
  "name": "First",
  "children": [
    { "name": "A1", "value": 100 },
    { "name": "A2", "value": 60 },
    { "name": "A3", "value": 30 }
  ]
}, {
  "name": "Second",
  "children": [
    { "name": "B1", "value": 135 },
    { "name": "B2", "value": 98 },
    { "name": "B3", "value": 56 }
  ]
}, {
  "name": "Third",
  "children": [
    { "name": "C1", "value": 335 },
    { "name": "C2", "value": 148 },
    { "name": "C3", "value": 126 },
    { "name": "C4", "value": 26 }
  ]
}, {
  "name": "Fourth",
  "children": [
    { "name": "D1", "value": 415 },
    { "name": "D2", "value": 148 },
    { "name": "D3", "value": 89 },
    { "name": "D4", "value": 64 },
    { "name": "D5", "value": 16 }
  ]
}, {
  "name": "Fifth",
  "children": [
    { "name": "E1", "value": 687 },
    { "name": "E2", "value": 148 }
  ]
}]
NOTE Once again, we're using "children" here, but it does not have to be named like that. We can have it named "jedi" and use "data fields" to specify that this field holds sub-items.
IMPORTANT If item has children, it does not have to have value set, because its value will automatically become the sum of the values of its children.
In-line data
We assign the data to the chart's data property:
chart.data = [{
  "value": 190
}, {
  "value": 289
}, {
  "value": 635
}, {
  "value": 732
}, {
  "value": 835
}];
chart.data = [{
  "value": 190
}, {
  "value": 289
}, {
  "value": 635
}, {
  "value": 732
}, {
  "value": 835
}];
{
  // ...
  "data": [{
    "value": 190
  }, {
    "value": 289
  }, {
    "value": 635
  }, {
    "value": 732
  }, {
    "value": 835
  }]
}
External data
We can also make the chart load external data using dataSource.
chart.dataSource.url = "chart_data.json";
chart.dataSource.url = "chart_data.json";
{
  // ...
  "dataSource": {
    "url": "chart_data.json"
  }
}
MORE INFO Please refer to our "External data" article, for more details.
Setting data fields
OK, so we mentioned "data fields" several times, already. Here's what they are.
Data fields are used to instruct the chart which fields in data hold specific information.
We specify data fields via chart's dataFields property, which is basically a key-value object. The key is a specific structured field, like sake a value or a name, while value is a string key of a field in data to look for in each data item.
TreeMaps support four types of data fields: (as defined by ITreeMapDataFields)
"value"- numeric value of the item;"name"- name of the item;"children"- array of sub-items (children);"color"- a color to be used for the item fill.
All fields are optional, with one caveat: if item does not have children, it has to have a "value" data field set, because without it, the chart won't be able to determine its value and therefore its area.
Here's how dataFields would look like for the sample data we had above:
chart.dataFields.value = "value";
chart.dataFields.name = "name";
chart.dataFields.children = "children";
chart.dataFields.value = "value";
chart.dataFields.name = "name";
chart.dataFields.children = "children";
{
  // ...
  "dataFields": {
    "value": "value",
    "name": "name",
    "children": "children"
  }
}
And, we're done. Our chart is ready.
Data order
The nature of the TreeMap chart is to automatically sort its items by value, so that the biggest chunk is always in the upper left corner.
That's the default behavior. If we're going to be sticking with it, the actual order of items in data is not important - the chart will sort them out for us.
We can, however, modify default behavior using TreeMap's sorting property.
Possible values are: "descending" (default), "ascending", and "none". The latter will just display items in the same order as they are in data.
Zero/negative values
TreeMap chart is meant to display proportional analysis of single items relative to the total sum of all items' value.
In this context having negative values does not make a lot of sense. If your data contains negative values, you will need to convert them to absolute values before supplying it to the chart.
Zero values will result in zero-size squares, making such items effectively invisible.
Complete example
Basic example
/* Create chart */
let chart = am4core.create("chartdiv", am4charts.TreeMap);
chart.data = [{
  "name": "First",
  "value": 190
}, {
  "name": "Second",
  "value": 289
}, {
  "name": "Third",
  "value": 635
}, {
  "name": "Fourth",
  "value": 732
}, {
  "name": "Fifth",
  "value": 835
}];

/* Define data fields */
chart.dataFields.value = "value";
chart.dataFields.name = "name";
/* Create chart */
var chart = am4core.create("chartdiv", am4charts.TreeMap);
chart.data = [{
  "name": "First",
  "value": 190
}, {
  "name": "Second",
  "value": 289
}, {
  "name": "Third",
  "value": 635
}, {
  "name": "Fourth",
  "value": 732
}, {
  "name": "Fifth",
  "value": 835
}];

/* Define data fields */
chart.dataFields.value = "value";
chart.dataFields.name = "name";
var chart am4core.createFromConfig({
  "type": "TreeMap",
  "data": [{
    "name": "First",
    "value": 190
  }, {
    "name": "Second",
    "value": 289
  }, {
    "name": "Third",
    "value": 635
  }, {
    "name": "Fourth",
    "value": 732
  }, {
    "name": "Fifth",
    "value": 835
  }],
  "dataFields": {
    "value": "value",
    "name": "name"
  }
}, "chartdiv");
See the Pen amCharts V4: Treemap (1) by amCharts (@amcharts) on CodePen.
Multi-level example
/* Create chart */
let chart = am4core.create("chartdiv", am4charts.TreeMap);
chart.data = [{
  "name": "First",
  "children": [
    { "name": "A1", "value": 100 },
    { "name": "A2", "value": 60 },
    { "name": "A3", "value": 30 }
  ]
}, {
  "name": "Second",
  "children": [
    { "name": "B1", "value": 135 },
    { "name": "B2", "value": 98 },
    { "name": "B3", "value": 56 }
  ]
}, {
  "name": "Third",
  "children": [
    { "name": "C1", "value": 335 },
    { "name": "C2", "value": 148 },
    { "name": "C3", "value": 126 },
    { "name": "C4", "value": 26 }
  ]
}, {
  "name": "Fourth",
  "children": [
    { "name": "D1", "value": 415 },
    { "name": "D2", "value": 148 },
    { "name": "D3", "value": 89 },
    { "name": "D4", "value": 64 },
    { "name": "D5", "value": 16 }
  ]
}, {
  "name": "Fifth",
  "children": [
    { "name": "E1", "value": 687 },
    { "name": "E2", "value": 148 }
  ]
}];

/* Define data fields */
chart.dataFields.value = "value";
chart.dataFields.name = "name";
chart.dataFields.children = "children";
/* Create chart */
var chart = am4core.create("chartdiv", am4charts.TreeMap);
chart.data = [{
  "name": "First",
  "children": [
    { "name": "A1", "value": 100 },
    { "name": "A2", "value": 60 },
    { "name": "A3", "value": 30 }
  ]
}, {
  "name": "Second",
  "children": [
    { "name": "B1", "value": 135 },
    { "name": "B2", "value": 98 },
    { "name": "B3", "value": 56 }
  ]
}, {
  "name": "Third",
  "children": [
    { "name": "C1", "value": 335 },
    { "name": "C2", "value": 148 },
    { "name": "C3", "value": 126 },
    { "name": "C4", "value": 26 }
  ]
}, {
  "name": "Fourth",
  "children": [
    { "name": "D1", "value": 415 },
    { "name": "D2", "value": 148 },
    { "name": "D3", "value": 89 },
    { "name": "D4", "value": 64 },
    { "name": "D5", "value": 16 }
  ]
}, {
  "name": "Fifth",
  "children": [
    { "name": "E1", "value": 687 },
    { "name": "E2", "value": 148 }
  ]
}];

/* Define data fields */
chart.dataFields.value = "value";
chart.dataFields.name = "name";
chart.dataFields.children = "children";
var chart am4core.createFromConfig({
  "type": "TreeMap",
  "data": [{
    "name": "First",
    "children": [
      { "name": "A1", "value": 100 },
      { "name": "A2", "value": 60 },
      { "name": "A3", "value": 30 }
    ]
  }, {
    "name": "Second",
    "children": [
      { "name": "B1", "value": 135 },
      { "name": "B2", "value": 98 },
      { "name": "B3", "value": 56 }
    ]
  }, {
    "name": "Third",
    "children": [
      { "name": "C1", "value": 335 },
      { "name": "C2", "value": 148 },
      { "name": "C3", "value": 126 },
      { "name": "C4", "value": 26 }
    ]
  }, {
    "name": "Fourth",
    "children": [
      { "name": "D1", "value": 415 },
      { "name": "D2", "value": 148 },
      { "name": "D3", "value": 89 },
      { "name": "D4", "value": 64 },
      { "name": "D5", "value": 16 }
    ]
  }, {
    "name": "Fifth",
    "children": [
      { "name": "E1", "value": 687 },
      { "name": "E2", "value": 148 }
    ]
  }],
  "dataFields": {
    "value": "value",
    "name": "name",
    "children": "children"
  }
}, "chartdiv");
See the Pen amCharts V4: Treemap (2) by amCharts (@amcharts) on CodePen.
Multi-level drill-down
This example with three-level data sets maxLevels = 1 so that only a single level is shown at the time. Once clicked on a column, it drill-s down to the subsequent level and shows elements in that level.
See the Pen Multi-level TreeMap drill-down by amCharts team (@amcharts) on CodePen.
Configuring
Now that we have basic chart working, let's see how we can use bend it to our specific needs.
Level series templates
TreeMap in it's heart is a serial chart. It creates a series for each level of data.
It differs from other serial-based charts like XY and Pie in that we don't have to create series - they are created automatically by the chart.
However, if we want to configure those series, we'll need to create one for each chart drill-down level we want to configure.
TreeMap holds such level-specific series in its property seriesTemplates.
It is a DictionaryTemplate so we can create level-specific series templates using its create(level) method.
NOTE "Levels" in TreeMap are counted from zero (0). The top-most (0) series contains top items from your data array. Level 1 contains their children. And so on.
So, if we'd like to configure our first level items, we'd need to create a series template for level "0":
var level0 = chart.seriesTemplates.create("0");
var level0 = chart.seriesTemplates.create("0");
{
  // ...
  "seriesTemplates": {
    "0": {
      // ...
    }
  }
}
What we get in level0 is a full-fledged TreeMapSeries object, which we can use to configure appearance and behavior of the items in that series, that is in that particular level.
Moving forward, in this article we'll be using those series templates to configure item appearance and behavior in the chart.
Altering item colors
Automatically-assigned colors
By default the chart will automatically assign a color for each new top-level item from the currently active theme.
Sub-items (children) automatically inherit color from their parent.
Normally this is enough to generate a good looking TreeMap with distinctive items.
However, some of the themes, such as default one, may have colors lists that do not make the contrast between color steps prominent enough.
For such situations you may instruct the chart to skip every X-th color in the list using chart's colors.step property:
chart.colors.step = 2;
chart.colors.step = 2;
{
  // ...
  "colors": {
    "step ": 2
  }
}
Colors via data
We mentioned colors briefly when we were discussing "data fields" earlier in this article.
Basically, if we're not fine with colors being automatically assigned to our TreeMap items, we can hard-code them in data and bind via "color" data field:
chart.dataFields.color = "color";
chart.dataFields.color = "color";
{
  // ...
  "dataFields": {
    // ...
    "color": "color"
  }
}
Here's an example with custom-set colors:
See the Pen amCharts V4: Treemap (4) by amCharts (@amcharts) on CodePen.
Modifying appearance
We already know that to modify appearance of the items in a level, we need to create a series template for that level.
Once we have a series object for specific layer we can configure its various parts.
A series object on a TreeMap chart has a type of TreeMapSeries.
If we explore it closer, we will see that it has a columns property, which is a list template for all squares of in the series.
REQUIRED READING If you haven't done so already, we suggest you take a moment to familiarize yourself with "list template" concept now.
To modify appearance of the squares in the TreeMap series, we're going to be using columns.template object, which acts as a template object, all actual items are created from.
The template itself is an object of type Column with all the configuration options available to us:
let level1 = chart.seriesTemplates.create("0");
let level1_column = level1.columns.template;
level1_column.column.cornerRadius(10, 10, 10, 10);
level1_column.fillOpacity = 0.8;
level1_column.stroke = am4core.color("#fff");
level1_column.strokeWidth = 5;
level1_column.strokeOpacity = 1;
var level1 = chart.seriesTemplates.create("0");
var level1_column = level1.columns.template;
level1_column.column.cornerRadius(10, 10, 10, 10);
level1_column.fillOpacity = 0.8;
level1_column.stroke = am4core.color("#fff");
level1_column.strokeWidth = 5;
level1_column.strokeOpacity = 1;
{
  // ...
  "seriesTemplates": {
    "0": {
      "columns": {
        "column": {
          "cornerRadiusTopLeft": 10,
          "cornerRadiusTopRight": 10,
          "cornerRadiusBottomRight": 10,
          "cornerRadiusBottomLeft": 10
        },
        "fillOpacity": 0.8,
        "stroke": "#fff",
        "strokeWidth": 5,
        "strokeOpacity": 1
      }
    }
  }
}
Let's take a look how it turned out:
See the Pen amCharts V4: Treemap (5) by amCharts (@amcharts) on CodePen.
Nice!
We can modify appearance of each level that way, by creating series templates for them.
IMPORTANT In a multi-level scenario the child items are drawn over parent items. This means, that if you have semi-transparent sub-items, or sub-items with rounded corners, their parent items might show through, if you don't adjust them accordingly. In such scenarios you might consider setting fillOpacity = 0 on level 0 items.
Tooltip content
As with most elements in amCharts 4 that display rollover tooltip, column's tooltip content is controlled by a tooltipText property.
By default it's set to: "{parentName} {name}: {value}". Which is pretty self-explanatory.
Should we want to change it to display, say, only the column name, we could do this:
level1_column.tooltipText = "{name}";
level1_column.tooltipText = "{name}";
{
  // ...
  "seriesTemplates": {
    "0": {
      // ...
      "columns": {
        // ...
        "tooltipText": "{name}"
      }
    }
  }
}
Adding labels
You know what would go nice with our TreeMap chart? Yeah - some labels.
For that, our TreeMapSeries has another property - bullets.
Now, bullets acts a little bit differently than columns. Basically, its a list of objects, that you want your series to use as bullets. You can push anything, that inherits from Bullet class into it, and all those objects will be replicated for each item in the series.
MORE INFO We've just touched the tip of the bullet iceberg here. If you want, you can just go with the flow. Or, if you'd like to become the master to rule them (bullets) all, make sure you read our dedicated "Bullets" article.
Since we want only labels displayed, we're going to use a handy ready-made LabelBullet:
let level1_bullet = level1.bullets.push(new am4charts.LabelBullet());
level1_bullet.locationY = 0.5;
level1_bullet.locationX = 0.5;
level1_bullet.label.text = "{name}";
level1_bullet.label.fill = am4core.color("#fff");
var level1_bullet = level1.bullets.push(new am4charts.LabelBullet());
level1_bullet.locationY = 0.5;
level1_bullet.locationX = 0.5;
level1_bullet.label.text = "{name}";
level1_bullet.label.fill = am4core.color("#fff");
{
  // ...
  "seriesTemplates": {
    "0": {
      // ...
      "bullets": [{
        "type": "LabelBullet",
        "locationY": 0.5,
        "locationX": 0.5,
        "label": {
          "text": "{name}",
          "fill": "#fff"
        }
      }]
    }
  }
}
And, there we go:
See the Pen amCharts V4: Treemap (6) by amCharts (@amcharts) on CodePen.
Additional controls
Breadcrumbs
In a multi-level TreeMap's, especially ones with more than two levels, users may find it disorienting to navigate via drill-downs and back up.
For charts like that we created a helper control - a Navigation bar, which is basically a breadcrumb type navigation indicating your path through levels to where you are now.
To add a Navigation bar we simply assign a new object of type NavigationBar to the chart's navigationBar property:
chart.navigationBar = new am4charts.NavigationBar();
chart.navigationBar = new am4charts.NavigationBar();
{
  // ...
  "navigationBar ": {
    "type": NavigationBar"
  }
}
See the Pen amCharts V4: Treemap (7) by amCharts (@amcharts) on CodePen.
The Navigation bar now acts as both visual indicator of where we are as well as interactive control allowing us to jump to specific level.
And, in case we're not happy with the "Home" wording, we can always change that using chart's homeText property:
chart.homeText = "TOP";
chart.homeText = "TOP";
{
  // ...
  "homeText": "TOP"
}
Legend
A TreeMap chart, like some other chart types can automatically generate a Legend. And, it's just as easy: you just need to assign a new instance of a Legend to chart's legend property:
chart.legend = new am4charts.Legend();
chart.legend = new am4charts.Legend();
{
  // ...
  "legend": {}
}
There are a few caveats and things you should know about a TreeMap legend.
As you already know, TreeMap is a multi-level data chart. The top level (or zero level) is "home". Next level, or level 1, holds first level TreeMap nodes.
This is important because the Legend will automatically use items from level 1 series to feed its items. Therefore the legend won't work if you have maxLevels set to 1.
IMPORTANT This means that at this time legend will only work if there are more drill-down steps than one. At some point we are going to introduce a Legend capable of handling one-level data sets.
Now that we have out of the way, let's try it in real life:
See the Pen amCharts V4: TreeMap with Legend by amCharts (@amcharts) on CodePen.
MORE INFO For more information about Legend and how to configure it, refer to our "Legend" article.
Additional topics
Area division methods
As you can imagine, there's a logic behind how TreeMap divvies up the area between each item, sizes and lays them out.
Just in case you are not happy with how it turned out, you can try different layouting mechanisms.
To set a specific layout mode, use chart's layoutAlgorithm property.
The property expects a reference to a function. There are following ones available as a methods in each TreeMap chart object as methods:
| Function | Appearance |
|---|---|
binaryTree | 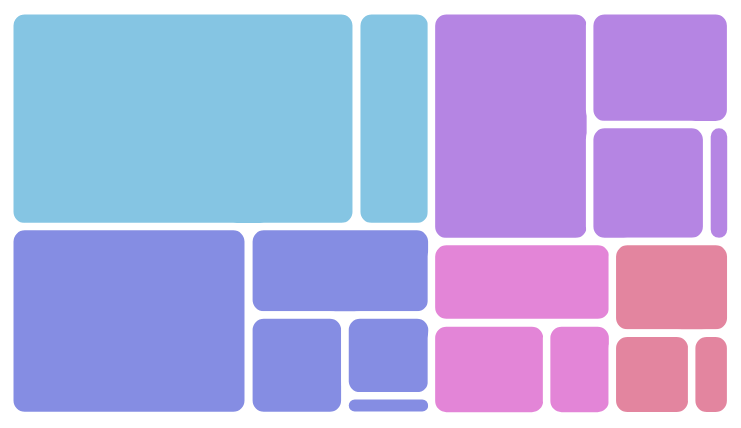 |
dice |  |
slice |  |
slideDice | 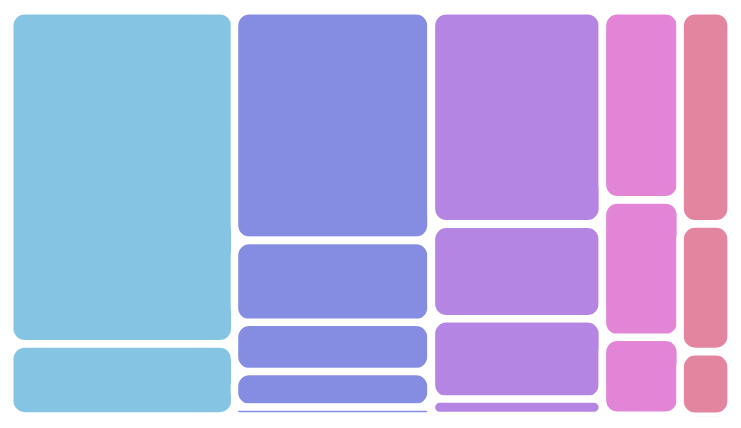 |
squarify (default) | 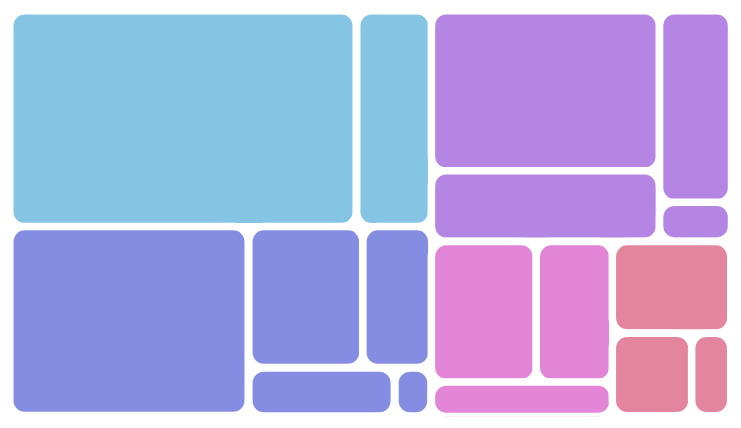 |
Controlling depth
A quick note about depth of the multi-level TreeMap chart.
Sometimes, even though you do have multiple levels in your data, you might not want to allow drilling-down all the way.
You can limit the maximum level user is allowed to drill down, by setting chart's maxLevels property.
E.g. setting it to 2 will limit drill-down to second level only.
Using themes
Like with any chart type, TreeMap might be influenced greatly with the use of themes.
If you haven't done so already, make sure you read our article about "Themes". It has a lot of background information on how to use and apply themes.
Let's just explore two main aspects of themes that influence TreeMap.
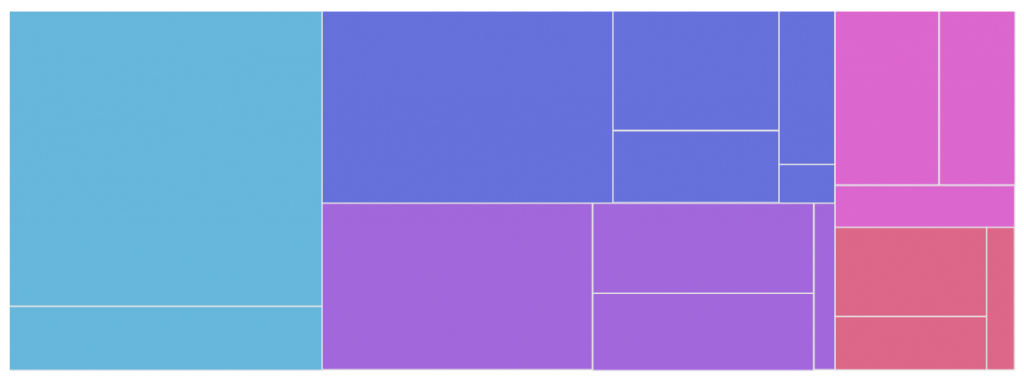
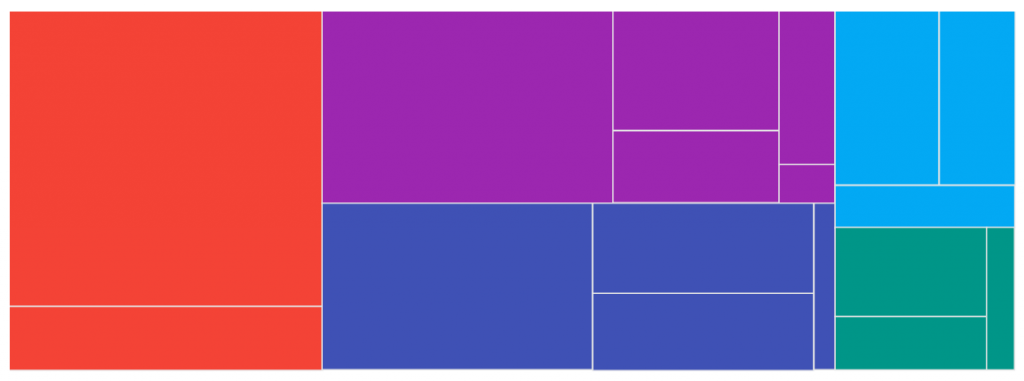
Each theme brings in it's own list of matching colors. Since each TreeMap item is being assigned a new color from that list, switching themes will make your diagram look differently:
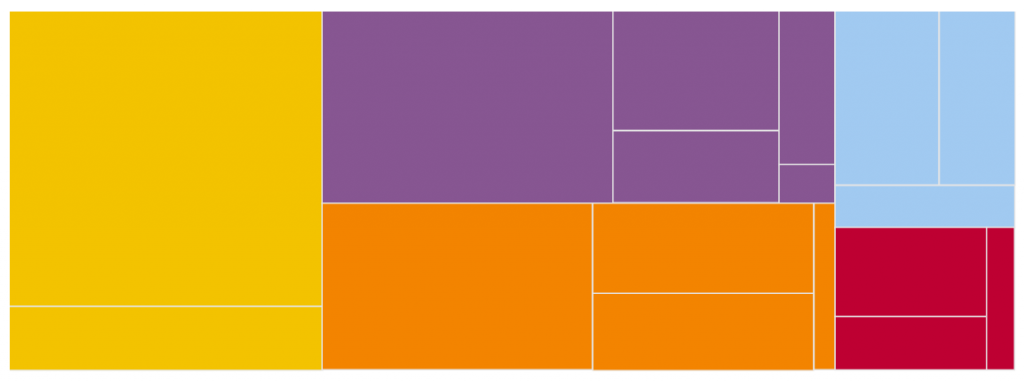
Another aspect is make use of animations.
The quickest way to enable animations in amCharts 4 is to use "animated" theme:
am4core.useTheme(am4themes_animated);
am4core.useTheme(am4themes_animated);
This will make TreeMap drill-down actions much smoother and nicer:
See the Pen amCharts V4: Treemap (themes) by amCharts (@amcharts) on CodePen.


