Gauge chart is used to display all kinds of one-dimensional progressive values. It can use colored bands, hands, and combinations of to display multiple values and their relation to a numeric scale/range.
Creating a Gauge chart
To create a Gauge chart, which is an instance of a GaugeChart class, we'll need at least the following chart elements:
- Chart instance.
- At least one axis.
Let's look at each of those one-by-one.
Importing modules/scripts
Needless to say, before you can use modules/objects, you need to make sure all required modules (in TypeScript), or files (in JavaScript) are imported. Please refer to our Getting started articles for more details:
For a XY chart, we'll need to import core (main module) and charts modules.
import * as am4core from "@amcharts/amcharts4/core";
import * as am4charts from "@amcharts/amcharts4/charts";
<script src="//cdn.amcharts.com/lib/4/core.js"></script>
<script src="//cdn.amcharts.com/lib/4/charts.js"></script>
We'll be importing and referring these as am4core and am4charts in the course of this article, and overally in our demos and tutorials.
Creating chart instance
For that we're going to be using am4core.create() function. (or am4core.createFromConfig() if you are using JSON-based config approach)
let chart = am4core.create("chartdiv", am4charts.GaugeChart);
var chart = am4core.create("chartdiv", am4charts.GaugeChart);
var chart = am4core.createFromConfig({
  // ... chart config
}, "chartdiv", am4charts.GaugeChart);
Data
Gauge chart is unique in such way that it does not require or even have capability to use data.
All of the information on it is expressed via Axes, Axis Ranges (bands), and Hands.
We'll look at all of those shortly.
Axes
We already mentioned Gauge chart requires at least one Axis. It provides a scale and range of values, like a speed dial on car's dashboard.
Technically, Gauge chart can accommodate any axis type. However, as the primary objective of the Gauge chart is to display a value relative to a range of values, we're going to be mainly using ValueAxis.
At the end of this article we have an example that uses CategoryAxis. Check it out if that's what you were looking for.
Creating an axis
On Gauge chart, we create an axis just like we would do it on any other circular chart (e.g. RadarChart): by pushing a new axis object into chart's xAxes list.
Why xAxes? Because technically it starts horizontally and goes in a linear fashion curving to form a circle. yAxes represents radial axes (axes that go from center of the chart outwards), but those are not used on Gauge charts, so let's just ignore them.
let axis = chart.xAxes.push(new am4charts.ValueAxis());
axis.min = 0;
axis.max = 100;
axis.strictMinMax = true;
var axis = chart.xAxes.push(new am4charts.ValueAxis());
axis.min = 0;
axis.max = 100;
axis.strictMinMax = true;
{
  // ...
  "xAxes": [{
    "type": "ValueAxis",
    "min": 0,
    "max": 100,
    "strictMinMax": true
  }]
}
IMPORTANT Pay attention how we are setting the axis scale using min and max properties. Normally, ValueAxis would figure it out by itself. However, our chart does not contain any data whatsoever, we need to specify the scale manually.
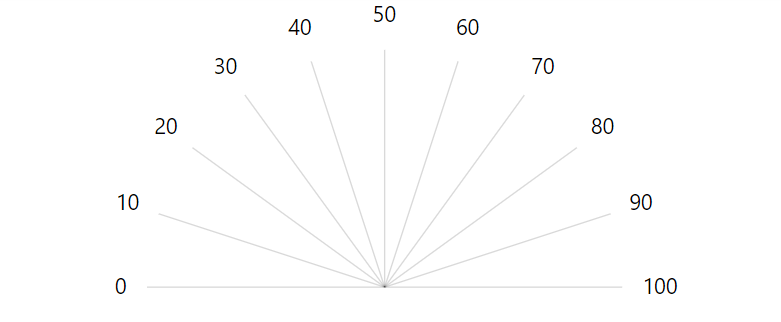
If we'd run the chart as it is now, we'd have something like this:
TYPESCRIPT NOTE If you are using TypeScript, you may need to use generics to specify what type of renderer the axis will use:
let axis = chart.xAxes.push(new am4charts.ValueAxis<am4charts.AxisRendererCircular>());
Modifying chart radius
As you can see in the screenshot above, the axis grid extends all the way to the center of the chart.
If we'd like it to be more "dash-like", we need to set chart's inner radius via innerRadius.
The innerRadius property can accept values in absolute pixel numbers as well as relative Percent. The latter will be relative to the whole available available radius to the chart.
It can also accept negative values, which would mean we are setting distance from the outer edge of the chart, rather from the center.
chart.innerRadius = -20;
chart.innerRadius = -20;
{
  // ...
  "innerRadius": -20
}

innerRadius = 20
innerRadius = -20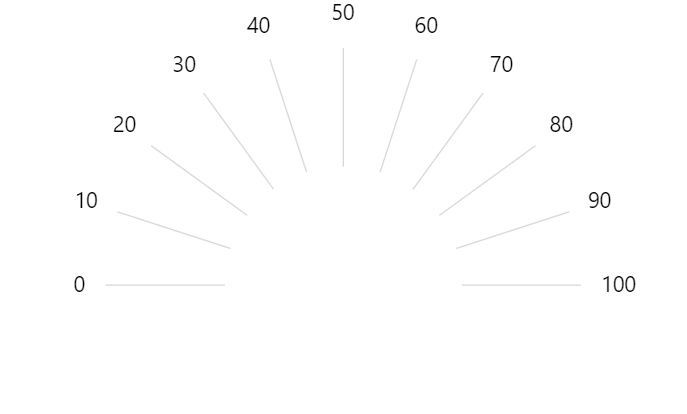
innerRadius = am4core.percent(50)
Start and end angles
So far we've seen gauges that are a perfect half-circle dials. However, we're not limited to that.
We can start and end our dial at any angle using chart's startAngle and endAngle properties. E.g.:
chart.startAngle = -90;
chart.endAngle = 270;
chart.startAngle = -90;
chart.endAngle = 270;
{
  // ...
  "startAngle": -90,
  "endAngle": 270
}
The zero angle is one going horizontally from the center of the chart to the right. Negative values mean angle counter-clockwise, while positive ones means clock-wise angles.

startAngle = -90endAngle = 270;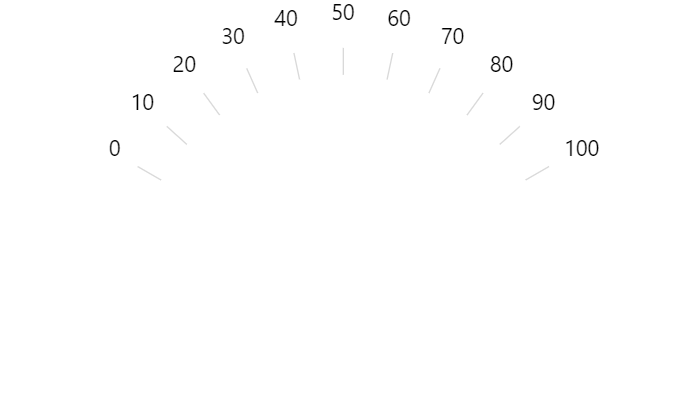
startAngle = -150endAngle = -30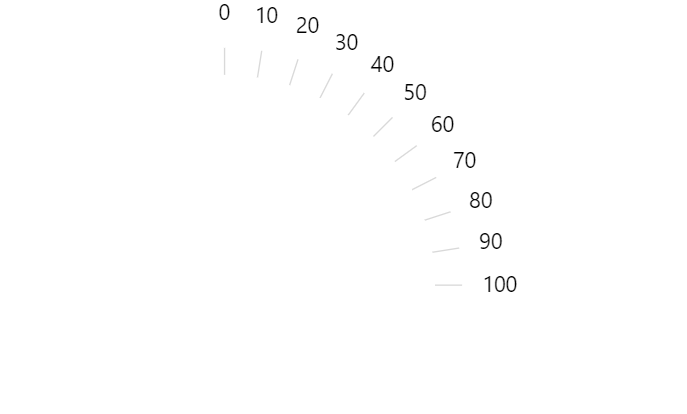
startAngle = -90endAngle = 0
Configuring axis
MORE INFO For more information about Axes, how its components like grid, labels, and ticks are configured, and other info, check out our dedicated articles "Axes" and "Value axis".
Ranges (bands)
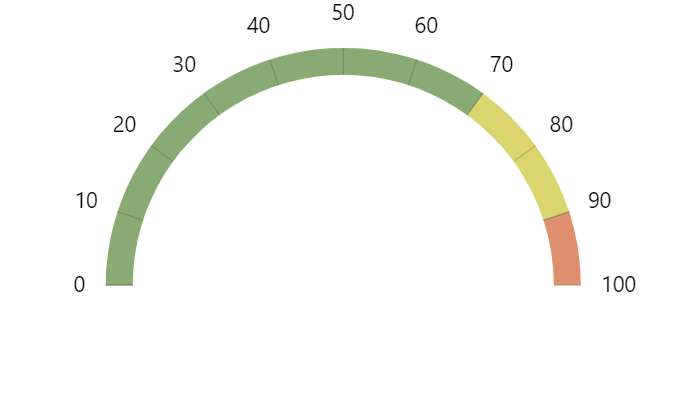
Now that we've tamed the axes, let's put them to good use by coloring their respective ranges with bands.
For that, we will be using what we call "axis ranges".
Axis ranges are much more than colored bands (see dedicated article "Axis Ranges"), but for purpose of Gauge chart, we'll be using them as such.
Basically, what we are trying to achieve is this: "please color the range between value X and Y on this axis".
This is how it works code-wise:
let range = axis.axisRanges.create();
range.value = 0;
range.endValue = 70;
range.axisFill.fillOpacity = 1;
range.axisFill.fill = am4core.color("#88AB75");
range.axisFill.zIndex = -1;
var range = axis.axisRanges.create();
range.value = 0;
range.endValue = 70;
range.axisFill.fillOpacity = 1;
range.axisFill.fill = am4core.color("#88AB75");
range.axisFill.zIndex = -1;
{
  // ...
  "xAxes": [{
    // ...
    "axisRanges": [{
      "value": 0,
      "endValue": 70,
      "axisFill": {
        "fillOpacity": 1,
        "fill": "#88AB75",
        "zIndex": -1
      }
    }]
  }]
}
Let's examine what's going on in the code above.
- We create a new axis range in the
axisRangeslist. - Set the scope of the values using its
valueandendValueproperties. - The fill settings are set on axis range's
axisFillelement. - The
zIndex = -1part ensures that the fill goes behind the grid.
Hands
While axis ranges were good for indicating ranges of values, we still need a way to indicate a single value.
That's where hand elements come in.
Adding hands
A hand is an object of type ClockHand. To add one to the chart, we simply instantiate the object and push it to chart's hands list.
To indicate what value it should point at, we use its value property:
let hand = chart.hands.push(new am4charts.ClockHand());
hand.value = 65;
var hand = chart.hands.push(new am4charts.ClockHand());
hand.value = 65;
{
  // ...
  "hands": [{
    "type": "ClockHand",
    "value": 65
  }]
}
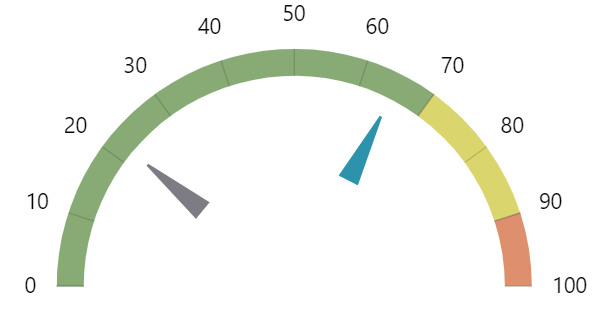
The chart supports any number of hands. To add another hand, we can repeat the same procedure.
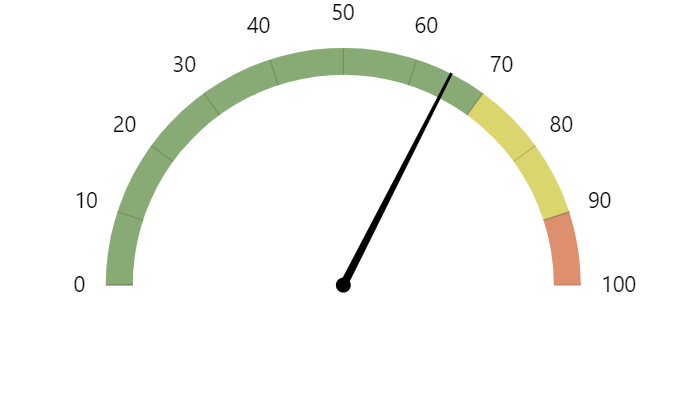
A Gauge chart with one hand. 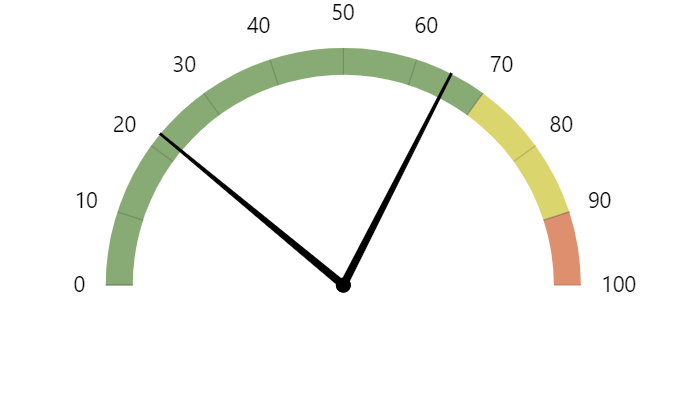
A Gauge chart with two hands.
Configuring hands
As we already mentioned, each hand is an object of type ClockHand. Click on the linked class name for a full list of its properties, methods and events. We'll examine just a few of those.
Hand elements
Each hand consists of two elements:
- Hand itself (pointy long arrow), accessible via
handproperty. - Pin (circle in the middle), accessible via
pinproperty.
If we'd like we can configure each of those individually, or even disable one of them.
For example, if we don't want pins on our hand, we can go ahead and disable them:
hand.pin.disabled = true;
hand.pin.disabled = true;
{
  // ...
  "hands": [{
    // ...
    "pin": {
      "disabled": true
    }
  }]
}
Hand color
Just like with any other elements you can set its fill color using fill property, and outline using stroke.
You can set those directly on hand (so both pin and arrow) inherit it, or on each element individually.
hand.fill = am4core.color("#2D93AD");
hand.stroke = am4core.color("#2D93AD");
hand.fill = am4core.color("#2D93AD");
hand.stroke = am4core.color("#2D93AD");
{
  // ...
  "hands": [{
    // ...
    "fill": "#2D93AD",
    "strole": "#2D93AD"
  }]
}
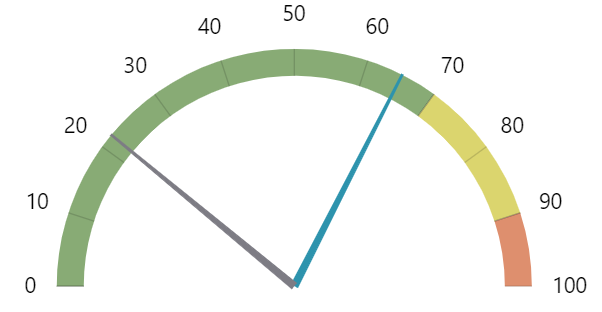
Arrow length and width
We can also control length as well as width of each individual end of the arrow.
The length is controlled using innerRadius and radius properties, that control where arrow starts and ends. The values can either be absolute pixel values, or Percent values relative to chart's radius.
The width of the arrow's ends is set via startWidth and endWidth properties.
Let's make our arrows start in half-way across radius and stop right before the axis itself.
hand.innerRadius = am4core.percent(50);
hand.radius = am4core.percent(80);
hand.startWidth = 15;
hand.innerRadius = am4core.percent(50);
hand.radius = am4core.percent(80);
hand.startWidth = 15;
{
  // ...
  "hands": [{
    // ...
    "innerRadius": "50%",
    "radius": "80%",
    "startWidth": 15
  }]
}
Animating values
We can also update the value a had is pointing to dynamically.
For that, we have its method showValue(value).
hand.showValue(85);
hand.showValue(85);
Complete example
// Import modules
import * as am4core from "../src/core";
import * as am4charts from "../src/charts";

// Set theme
am4core.useTheme(am4themes_animated);

// Create chart
let chart = am4core.create("chartdiv", am4charts.GaugeChart);

// Create axis
let axis = chart.xAxes.push(new am4charts.ValueAxis<am4charts.AxisRendererCircular>());
axis.min = 0;
axis.max = 100;
axis.strictMinMax = true;

// Set inner radius
chart.innerRadius = -20;

// Add ranges
let range = axis.axisRanges.create();
range.value = 0;
range.endValue = 70;
range.axisFill.fillOpacity = 1;
range.axisFill.fill = am4core.color("#88AB75");
range.axisFill.zIndex = - 1;

let range2 = axis.axisRanges.create();
range2.value = 70;
range2.endValue = 90;
range2.axisFill.fillOpacity = 1;
range2.axisFill.fill = am4core.color("#DBD56E");
range2.axisFill.zIndex = - 1;

let range3 = axis.axisRanges.create();
range3.value = 90;
range3.endValue = 100;
range3.axisFill.fillOpacity = 1;
range3.axisFill.fill = am4core.color("#DE8F6E");
range3.axisFill.zIndex = - 1;

// Add hand
let hand = chart.hands.push(new am4charts.ClockHand());
hand.value = 65;
hand.pin.disabled = true;
hand.fill = am4core.color("#2D93AD");
hand.stroke = am4core.color("#2D93AD");
hand.innerRadius = am4core.percent(50);
hand.radius = am4core.percent(80);
hand.startWidth = 15;

let hand2 = chart.hands.push(new am4charts.ClockHand());
hand2.value = 22;
hand2.pin.disabled = true;
hand2.fill = am4core.color("#7D7C84");
hand2.stroke = am4core.color("#7D7C84");
hand2.innerRadius = am4core.percent(50);
hand2.radius = am4core.percent(80);
hand2.startWidth = 15;

// Animate
setInterval(function() {
  hand.showValue(Math.random() * 100, 1000, am4core.ease.cubicOut);
  hand2.showValue(Math.random() * 100, 1000, am4core.ease.cubicOut);
}, 2000);
<script src="//cdn.amcharts.com/lib/4/core.js"></script>
<script src="//cdn.amcharts.com/lib/4/charts.js"></script>

<div id="chartdiv" style="width: 100%; height: 400px;"></div>

<script>
// Set theme
am4core.useTheme(am4themes_animated);

// Create chart
var chart = am4core.create("chartdiv", am4charts.GaugeChart);

// Create axis
var axis = chart.xAxes.push(new am4charts.ValueAxis());
axis.min = 0;
axis.max = 100;
axis.strictMinMax = true;

// Set inner radius
chart.innerRadius = -20;

// Add ranges
var range = axis.axisRanges.create();
range.value = 0;
range.endValue = 70;
range.axisFill.fillOpacity = 1;
range.axisFill.fill = am4core.color("#88AB75");
range.axisFill.zIndex = - 1;

var range2 = axis.axisRanges.create();
range2.value = 70;
range2.endValue = 90;
range2.axisFill.fillOpacity = 1;
range2.axisFill.fill = am4core.color("#DBD56E");
range2.axisFill.zIndex = - 1;

var range3 = axis.axisRanges.create();
range3.value = 90;
range3.endValue = 100;
range3.axisFill.fillOpacity = 1;
range3.axisFill.fill = am4core.color("#DE8F6E");
range3.axisFill.zIndex = - 1;

// Add hand
var hand = chart.hands.push(new am4charts.ClockHand());
hand.value = 65;
hand.pin.disabled = true;
hand.fill = am4core.color("#2D93AD");
hand.stroke = am4core.color("#2D93AD");
hand.innerRadius = am4core.percent(50);
hand.radius = am4core.percent(80);
hand.startWidth = 15;

var hand2 = chart.hands.push(new am4charts.ClockHand());
hand2.value = 22;
hand2.pin.disabled = true;
hand2.fill = am4core.color("#7D7C84");
hand2.stroke = am4core.color("#7D7C84");
hand2.innerRadius = am4core.percent(50);
hand2.radius = am4core.percent(80);
hand2.startWidth = 15;

// Animate
setInterval(function() {
  hand.showValue(Math.random() * 100, 1000, am4core.ease.cubicOut);
  hand2.showValue(Math.random() * 100, 1000, am4core.ease.cubicOut);
}, 2000);
</script>
<script src="//cdn.amcharts.com/lib/4/core.js"></script>
<script src="//cdn.amcharts.com/lib/4/charts.js"></script>

<div id="chartdiv" style="width: 100%; height: 400px;"></div>

<script>
// Set theme
am4core.useTheme(am4themes_animated);

// Create chart
var chart = am4core.createFromConfig({

  // Set inner radius
  "innerRadius": -20,

  // Create axis
  "xAxes": [{
    "type": "ValueAxis",
    "min": 0,
    "max": 100,
    "strictMinMax": true,

    // Add ranges
    "axisRanges": [{
      "value": 0,
      "endValue": 70,
      "axisFill": {
        "fillOpacity": 1,
        "fill": "#88AB75",
        "zIndex": -1
      }
    }, {
      "value": 70,
      "endValue": 90,
      "axisFill": {
        "fillOpacity": 1,
        "fill": "#DBD56E",
        "zIndex": -1
      }
    }, {
      "value": 90,
      "endValue": 100,
      "axisFill": {
        "fillOpacity": 1,
        "fill": "#DE8F6E",
        "zIndex": -1
      }
    }]
  }],

  // Add hands
  "hands": [{
    "type": "ClockHand",
    "value": 65,
    "fill": "#2D93AD",
    "stroke": "#2D93AD",
    "innerRadius": "50%",
    "radius": "80%",
    "startWidth": 15,
    "pin": {
      "disabled": true
    }
  }, {
    "type": "ClockHand",
    "value": 22,
    "fill": "#7D7C84",
    "stroke": "#7D7C84",
    "innerRadius": "50%",
    "radius": "80%",
    "startWidth": 15,
    "pin": {
      "disabled": true
    }
  }]
}, "chartdiv", am4charts.GaugeChart);

setInterval(function() {
  chart.hands.getIndex(0).showValue(Math.random() * 100, 1000, am4core.ease.cubicOut);
  chart.hands.getIndex(1).showValue(Math.random() * 100, 1000, am4core.ease.cubicOut);
}, 2000);
</script>
See the Pen amCharts 4: GaugeChart by amCharts team (@amcharts) on CodePen.
And here's JSON version of the above example.
Miscellaneous usage
Using Category axis
See the Pen amCharts 4: GaugeChart with CategoryAxis by amCharts team (@amcharts) on CodePen.


