amCharts 4 MapChart offers a lot of ways to draw the lines on geographical maps. This article aims to help you choose which one to use as well as explain how.
Prerequisites
This article assumes prior knowledge of how MapChart works and how map lines are created. If you don't possess that information, we strongly advise to start with the "Anatomy of a Map Chart" and specifically section dealing with map lines.
Line types
As all objects on the maps, lines are organized into Series. Each type of the lines is represented by a its special kind of series.
We'll explore each of those one by one.
| Series class | Line class | Example | Comment |
|---|---|---|---|
MapArcSeries |
MapArc |
 |
Displays each segment as a configurable arc. |
MapLineSeries |
MapLine |
 |
Connects each point with a straight or slightly arched line. |
MapSplineSeries |
MapSpline |
 |
Connects multiple points with a smooth line. |
Line object
Each series above contains relative objects. For example MapLineSeries holds objects of type MapLine.
Each individual object has a property line. It holds an actual geometrical shape that corresponds to the type of the objects. MapLine.line for example holds a geometrical shape Polyline.
MapArc uses Polyarc, while mapSpline makes use of Polyspline.
This is important to know, because we will be using line property to not only configure basic appearance of the line (color, width, etc.), but also settings affecting actual curvature of the line.
Line series
A Line series, or MapLineSeries, is the most basic line type, meant for connecting two or more points on the map with a straight or slightly curved line.
Line series example
Here's an example of a simple multi-point line series:
let lineSeries = chart.series.push(new am4maps.MapLineSeries());
lineSeries.data = [{
  "multiGeoLine": [
    [
      { "latitude": 48.856614, "longitude": 2.352222 },
      { "latitude": 40.712775, "longitude": -74.005973 },
      { "latitude": 49.282729, "longitude": -123.120738 }
    ]
  ]
}];
var lineSeries = chart.series.push(new am4maps.MapLineSeries());
lineSeries.data = [{
  "multiGeoLine": [
    [
      { "latitude": 48.856614, "longitude": 2.352222 },
      { "latitude": 40.712775, "longitude": -74.005973 },
      { "latitude": 49.282729, "longitude": -123.120738 }
    ]
  ]
}];
{
  // ... map config
  "series": [{
    "type": "MapPolygonSeries",
    // ...
  }, {
    "type": "MapLineSeries",
    "data": [{
      "multiGeoLine": [
        [
          { "latitude": 48.856614, "longitude": 2.352222 },
          { "latitude": 40.712775, "longitude": -74.005973 },
          { "latitude": 49.282729, "longitude": -123.120738 }
        ]
      ]
    }]
  }]
}
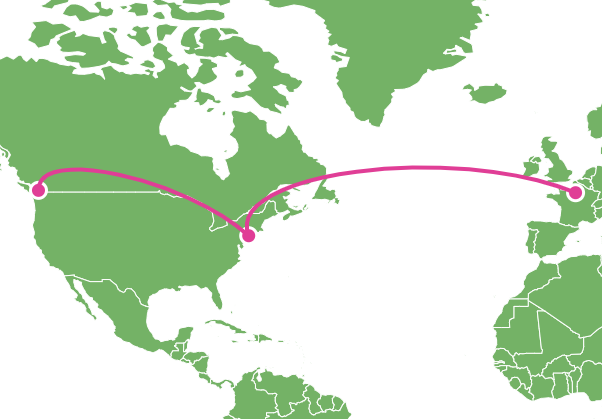
If we run the above we'll see Paris, New York City, and Vancouver connected by a line:
See the Pen amCharts 4: Map Lines (1) by amCharts (@amcharts) on CodePen.
Curved vs. straight line
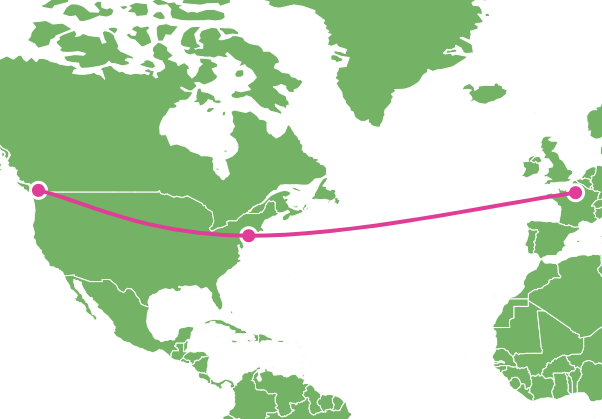
You may notice that lines on the map are drawn slightly curved. That's not a mistake.
While they may appear curved on screen - where map is flattened - they are actually plot the straightest possible route from two points on the globe.
If you'd like the lines to appear straight, use shortestDistance = false setting:
lineSeries.mapLines.template.shortestDistance = false;
lineSeries.mapLines.template.shortestDistance = false;
{
  // ... map config
  "series": [{
    "type": "MapPolygonSeries",
    // ...
  }, {
    "type": "MapLineSeries",
    // ...
    "mapLines": {
      "shortestDistance": false
    }
  }]
}
See the Pen amCharts 4: Map Lines (2) by amCharts (@amcharts) on CodePen.
Line precision
As we already learned, line will curve according to maps projection to depict the shortest route as it would happen on real ground, not on the screen (unless shortestDistance is set to false).
There's a setting that controls it: precision. (default: 0.1)
Basically it means that if degrees between line's start and end points are closer than precision, the line curvature will not be calculated and it will be drawn as a straight line instead.
Using this setting allows two things:
- Simplifying small lines, which might help performance if you have a lot of lines.
- Showing straight lines that break -180/180 latitude.
Consider a line connecting San Franciso and Sydney:
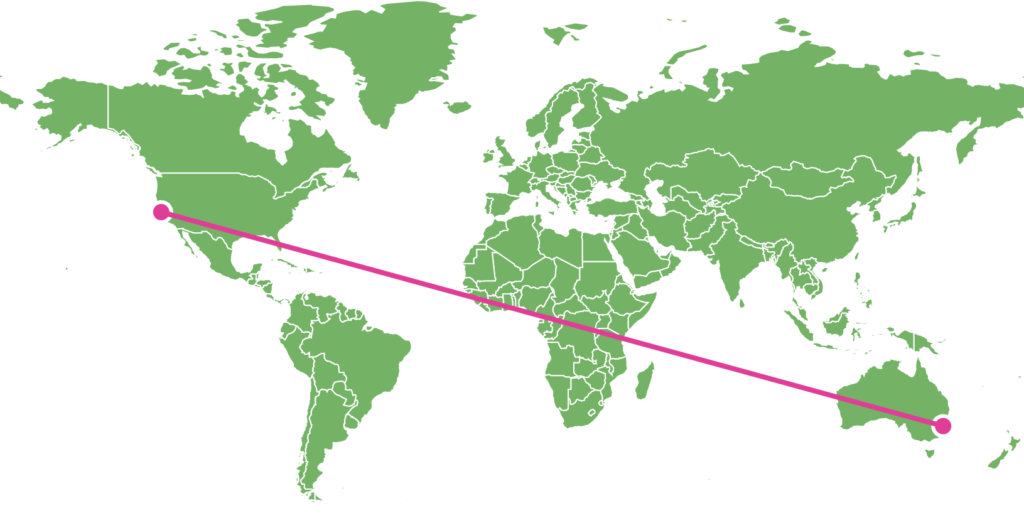
shortestDistance = true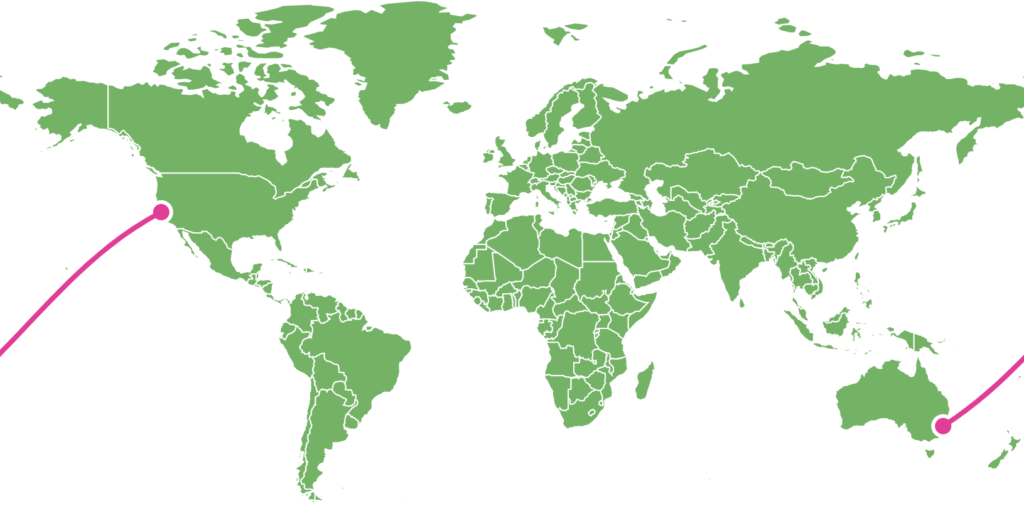
(default) 
precision = 1000
Here's a working example:
See the Pen amCharts 4: Map Lines (precision) by amCharts team (@amcharts) on CodePen.
Arc series
Map arcs are much like lines except we are in complete control of line curve is drawn.
We already mentioned that MapArcSeries uses MapArc objects, that use Polyarc geometrical shapes.
Looking at the reference of Polyarc (linked), we see two distinctive settings that we can use to modify shape curvature of the arc:
| Polyarc setting | Type | Default | Example/comment |
|---|---|---|---|
controlPointDistance | number | 0.5 | Controls how relatively far should the curve go from the base line. |
controlPointPosition | number | 0.5 | Controls the relative position of the curve's tip. |
As you can see from the above examples, the bigger controlPointDistance the farther away from the perfect straight line between two points the curve will go. Note, how you can also use negative numbers to make the curve "jump" to the opposite side.
Similarly, controlPointPosition defines position of the curve's tip. With values from 0 (zero) to 1 (one), it will position the tip closer to originating or target point respectively.
Let's try that in real life:
lineSeries.mapLines.template.line.controlPointDistance = -0.4;
lineSeries.mapLines.template.line.controlPointPosition = 0.8;
lineSeries.mapLines.template.line.controlPointDistance = -0.4;
lineSeries.mapLines.template.line.controlPointPosition = 0.8;
{
  // ... map config
  "series": [{
    "type": "MapPolygonSeries",
    // ...
  }, {
    "type": "MapArcSeries",
    // ...
    "mapLines": {
      "line": {
        "controlPointDistance": -0.4,
        "controlPointPosition": 0.8
      }
    }
  }]
}
See the Pen amCharts 4: Map Lines (3) by amCharts (@amcharts) on CodePen.
Spline series
Using splines
OK, so two down, one to go. Last but not least - MapSplineSeries with MapSpline objects using Polyspline geometry.
The primary purpose of Spline series is to smoothly connect multiple points on the map.
While both Line and Arc series connected each point by a similar independent line segment, Spline series will make all of the segments connect at perfect angles, resulting in one smooth line across multiple points.
Let's see how our original example looks like if we replace Line series with Spline series:
let lineSeries = chart.series.push(new am4maps.MapSplineSeries());
lineSeries.data = [{
  "multiGeoLine": [
    [
      { "latitude": 48.856614, "longitude": 2.352222 },
      { "latitude": 40.712775, "longitude": -74.005973 },
      { "latitude": 49.282729, "longitude": -123.120738 }
    ]
  ]
}];
var lineSeries = chart.series.push(new am4maps.MapSplineSeries());
lineSeries.data = [{
  "multiGeoLine": [
    [
      { "latitude": 48.856614, "longitude": 2.352222 },
      { "latitude": 40.712775, "longitude": -74.005973 },
      { "latitude": 49.282729, "longitude": -123.120738 }
    ]
  ]
}];
{
  // ... map config
  "series": [{
    "type": "MapPolygonSeries",
    // ...
  }, {
    "type": "MapSplineSeries",
    "data": [{
      "multiGeoLine": [
        [
          { "latitude": 48.856614, "longitude": 2.352222 },
          { "latitude": 40.712775, "longitude": -74.005973 },
          { "latitude": 49.282729, "longitude": -123.120738 }
        ]
      ]
    }]
  }]
}
See the Pen amCharts 4: Map Lines (4) by amCharts (@amcharts) on CodePen.
See how line starts at Paris, then comes at a gentle angle to NYC, and continues in the same direction while smoothly curving to Vancouver?
That's Spline, for you!
NOTE Please note, for a Spline to make sense there needs to be at least three connecting points. Otherwise it'll be just a straight line.
Configuring spline
If we're not happy with how the spline curves, we have an option to control it.
For that we have two settings for Polyspline geometric object that Spline series uses : tensionX and tensionY.
A tension is basically a setting that defines how strongly target or source point attracts the line to itself. With values ranging from 0 (zero) to 1 (one), the bigger the number the straighter the line will be.
And vice versa: the smaller the number the more relaxed the line will be, resulting in wider curves.
Think of it as a reel. With zero setting the reel is completely reel out with all of the string loosely hanging as a big loop. With 1 it is completely reeled in with the string forming straight line.
There are two types of tension: vertical (controlled by tensionY) and horizontal (tensionX).
Both of those default at 0.8 which means "slightly loose".
Let's see what happens when we try changing those settings.


lineSeries.mapLines.template.line.tensionX = 0.2;
lineSeries.mapLines.template.line.tensionY = 0.2;
lineSeries.mapLines.template.line.tensionX = 0.2;
lineSeries.mapLines.template.line.tensionY = 0.2;
{
  // ... map config
  "series": [{
    "type": "MapPolygonSeries",
    // ...
  }, {
    "type": "MapSplineSeries",
    // ...
    "mapLines": {
      "line": {
        "tensionX": 0.2,
        "tensionY": 0.2
      }
    }
  }]
}
See the Pen amCharts 4: Map Lines (5) by amCharts (@amcharts) on CodePen.
Objects on lines
It is possible to attach other elements to lines. You can attach anything to a line - a simple shape, an image, a label, even a chart.
Let's examine how that works.
Creating a line object
Attaching an element to a map line follows this workflow:
- Create an object of type
MapLineObject, which is basically a special version ofContainer. - Add elements to the container, such as image, label, or shape.
- Set
positionwithin the line.
To create such special container we are going to use map line's lineObjects template list and its create() method:
let bullet = line.lineObjects.create();
var bullet = line.lineObjects.create();
{
  // ... map config
  "series": [{
    "type": "MapPolygonSeries",
    // ...
  }, {
    "type": "MapLineSeries",
    // ...
    "mapLines": [{
      // ...
      "lineObjects": [{
        // ..
      }]
    }]
  }]
}
We now have an empty Container which we can use to add stuff to.
Adding line elements
To keep stuff simple for now, let's add a Circle as a child to our newly created special container:
let bullet = line.lineObjects.create();
let circle = bullet.createChild(am4core.Circle);
circle.radius = 5;
circle.fill = am4core.color("#fff");
circle.strokeWidth = 3;
circle.stroke = am4core.color("#e03e96");
var bullet = line.lineObjects.create();
var circle = bullet.createChild(am4core.Circle);
circle.radius = 5;
circle.fill = am4core.color("#fff");
circle.strokeWidth = 3;
circle.stroke = am4core.color("#e03e96");
{
  // ... map config
  "series": [{
    "type": "MapPolygonSeries",
    // ...
  }, {
    "type": "MapLineSeries",
    // ...
    "mapLines": [{
      // ...
      "lineObjects": [{
        "children": [{
          "type": "Circle",
          "radius": 5,
          "fill": "#fff",
          "strokeWidth": 3,
          "stroke": "#e03e96"
        }]
      }]
    }]
  }]
}
Let's see how it worked.
See the Pen amCharts 4: Map line objects (1) by amCharts (@amcharts) on CodePen.
Setting position
By default, line object is put at the end of the line.
To specify some other position we can use map line object's position porperty.
It accepts values from 0 (zero) to 1 (one). With 0 meaning line start, 1 - end, and anything in-between some relative position within the line.
So, if we'd like to place our object in the middle of the line, we'd use 0.5.
let bullet = line.lineObjects.create();
bullet.position = 0.5;
var bullet = line.lineObjects.create();
bullet.position = 0.5;
{
  // ... map config
  "series": [{
    "type": "MapPolygonSeries",
    // ...
  }, {
    "type": "MapLineSeries",
    // ...
    "mapLines": [{
      // ...
      "lineObjects": [{
        "position": 0.5,
        // ..
      }]
    }]
  }]
}
See the Pen amCharts 4: Map line objects (2) by amCharts (@amcharts) on CodePen.
Setting center
The object is placed on the line using its virtual center. For a Circle it is its geometrical center, hence it appearing perfectly on the line in our previous examples.
For other shapes it might differ. For example, Rectangle has its center set at upper-left corner, so when it is rotated it looks like it is placed on top of the line.
To modify virtual center of the element, we use its horizontalCenter and verticalCenter properties.
So, to make our rectangle snap on top of the line, we do this:
bullet.width = 15;
bullet.height = 15;
bullet.horizontalCenter = "middle";
bullet.verticalCenter = "middle";
bullet.width = 15;
bullet.height = 15;
bullet.horizontalCenter = "middle";
bullet.verticalCenter = "middle";
{
  // ... map config
  "series": [{
    "type": "MapPolygonSeries",
    // ...
  }, {
    "type": "MapLineSeries",
    // ...
    "mapLines": [{
      // ...
      "lineObjects": [{
        // ..
        "width": 15,
        "height": 15,
        "horizontalCenter": "middle",
        "verticalCenter": "middle"
      }]
    }]
  }]
}
NOTE Please note the map line object needs to have dimensions in order for its center settings to have any affect, hence the width and height in the above code.
See the Pen amCharts 4: Map line objects (3) by amCharts (@amcharts) on CodePen.
Line arrows
All map lines have little secret - they can be turned into arrows instantly by accessing their arrow property.
Doing so will automatically create a map line object with a fully configured Triangle in it, which will work as our arrowhead.
It's a full-fledged map line object, so you can configure and change its position it just like we learned in previous chapters.
let arrow = line.arrow;
arrow.position = 1;
var arrow = line.arrow;
arrow.position = 1;
{
  // ... map config
  "series": [{
    "type": "MapPolygonSeries",
    // ...
  }, {
    "type": "MapLineSeries",
    // ...
    "mapLines": [{
      // ...
      "arrow": {
        "position": 0.5
      }
    }]
  }]
}
See the Pen amCharts 4: Map line objects (4) by amCharts (@amcharts) on CodePen.
Images on lines
Adding an image on a line works just like anything else. Let's try adding an SVG plane.
See the Pen amCharts 4: Map line objects (5) by amCharts (@amcharts) on CodePen.
Animating objects
Almost any quantifiable property in amCharts 4 can be animated. position is not an exception.
Let's make the plane fly across the line by animating position from 0 to 1.
To animate any property, you can use object's animate(options, duration, easing) method.
function goPlane() {
  bullet.animate({
    from: 0,
    to: 1,
    property: "position"
  }, 5000, am4core.ease.sinInOut);
}
function goPlane() {
  bullet.animate({
    from: 0,
    to: 1,
    property: "position"
  }, 5000, am4core.ease.sinInOut);
}
The first parameter indicates which property to animate as well as start and end values.
If we would like to animate several properties at once, we would provide an array of such objects.
Second parameter is duration of animation in milliseconds.
The third (optional) parameter is easing function. We chose "sinInOut" which gives the nice picking up speed in the beginning and slowing down at the end effect.
See the Pen amCharts 4: Map line objects (6) by amCharts (@amcharts) on CodePen.
Now, when we invoke goPlane() function, our plane makes a nice cross-Atlantic trip then stops.
Let's enhance it to use animation events to flip the plane when it reaches the end destination and launch it on it sway back.
function goPlane() {
  let from = bullet.position, to;
  if (from == 0) {
    to = 1;
    plane.rotation = 0;
  }
  else {
    to = 0;
    plane.rotation = 180;
  }

  let animation = bullet.animate({
    from: from,
    to: to,
    property: "position"
  }, 5000, am4core.ease.sinInOut);
  animation.events.on("animationended", goPlane)
}
function goPlane() {
  var from = bullet.position, to;
  if (from == 0) {
    to = 1;
    plane.rotation = 0;
  }
  else {
    to = 0;
    plane.rotation = 180;
  }

  var animation = bullet.animate({
    from: from,
    to: to,
    property: "position"
  }, 5000, am4core.ease.sinInOut);
  animation.events.on("animationended", goPlane)
}
See the Pen amCharts 4: Map line objects (7) by amCharts (@amcharts) on CodePen.