Starting with version 4.4.0 amCharts now have touch-specific UX enhancements, designed to provide better experience of charts for users on mobile devices. This article will walk through all these new options.
The problem
Some charts will have interactive elements, like an XY Chart with cursor, which reserves all of its plot area for chart interactivity. The Map Chart is even less generous taking all of its container for its own operations, like zoom and pan.
This means that whenever you touch such chart or map on a touch screen it "takes over" all gestures. What this also means is that you can't scroll (or pinch-zoom) the web page the chart is located in across all of its "active" area.
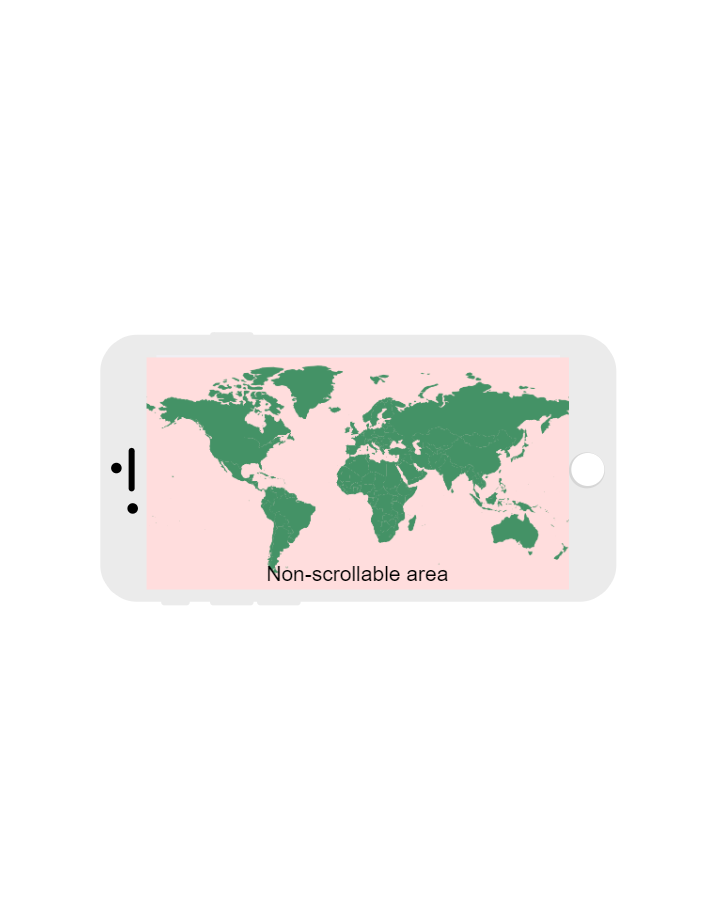
That is OK on large displays such as desktop computers or tablets, since there probably is still a lot of areas around the chart to grab onto for scrolling. Computers have also a lot of other options to scroll a page, such as scrollbars, mouse, or even keyboard.
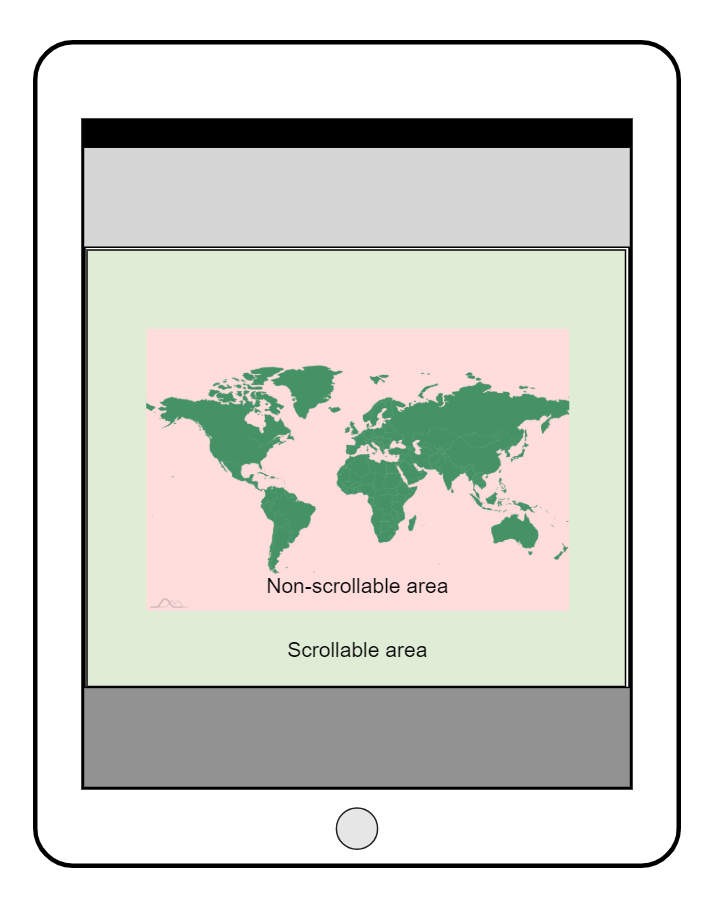
That is not the case with mobile phones, where a single chart or map instance can easily take up the whole of the screen. What happens is that user is essentially "stuck" without any means to scroll out of it.
Below we'll get acquainted with two distinctive solutions that are built-into amCharts, that tackle this specific problem.
Tap to active
The first option to work around this problem is "tap to activate" feature.
Enabling
Easily enabled by setting chart's tapToActivate property to true.
When enabled, this will happen to your chart/map:
- It will no longer react to "dragging" touch gestures, allowing to scroll your page uninterrupted. Even when touching chart surface.
- When you tap the chart, it "activates". When chart is "activated" it regains its original functionality such pan, zoom, etc.
- The chart will remain in "activated" mode as long as you keep interacting with it.
- After 3 seconds (this is configurable) of inactivity, the chart will automatically exit the "activated" mode and will allow page scrolling again.
- The chart will also exit "activated" mode if you touch anything outside the chart.
chart.tapToActivate = true;
chart.tapToActivate = true;
{
  // ...
  "tapToActivate": true
}
NOTE This feature works only when interacting with a touch screen, and is completely oblivious to mouse operations. On hybrid devices, such as computers equipped with touch screens, touch will invoke activation, while mouse operations will retain their conventional functionality.
Configuring exit timeout
To configure how long the chart will stay in "activated" mode, use its tapTimeout property. The value is in milliseconds, and the default is 3000 (3 seconds).
To disable auto-exit, simply set tapTimeout to 0 (zero).
chart.tapTimeout = 5000;
chart.tapTimeout = 5000;
{
  // ...
  "tapToActivate": true,
  "tapTimeout": 5000
}
Tap activation example
See the Pen amCharts 4: tapToActivate by amCharts team (@amcharts) on CodePen.
Drag grip
This brings us to a second solution we have up our sleeves: a special area on the chart that can be used to scroll the page.
We call it a "drag grip".
Enabling the grip
To enable the drag grip all you have to do is to access chart's dragGrip property. For example you can set its disabled to false.
This will activate the grip with default settings.
chart.dragGrip.disabled = false;
chart.dragGrip.disabled = false;
{
  // ...
  "dragGrip": {
    "disabled": false
  }
}
How it works?
When drag grip is enabled, the following things will happen with your chart:
- When chart is touched on a screen (this feature will not react to a mouse cursor) a special non-intrusive grip appears on the chart.
- User can touch and drag the grip to scroll the page.
- After 3 seconds (configurable) of inactivity the grip will hide itself automatically.
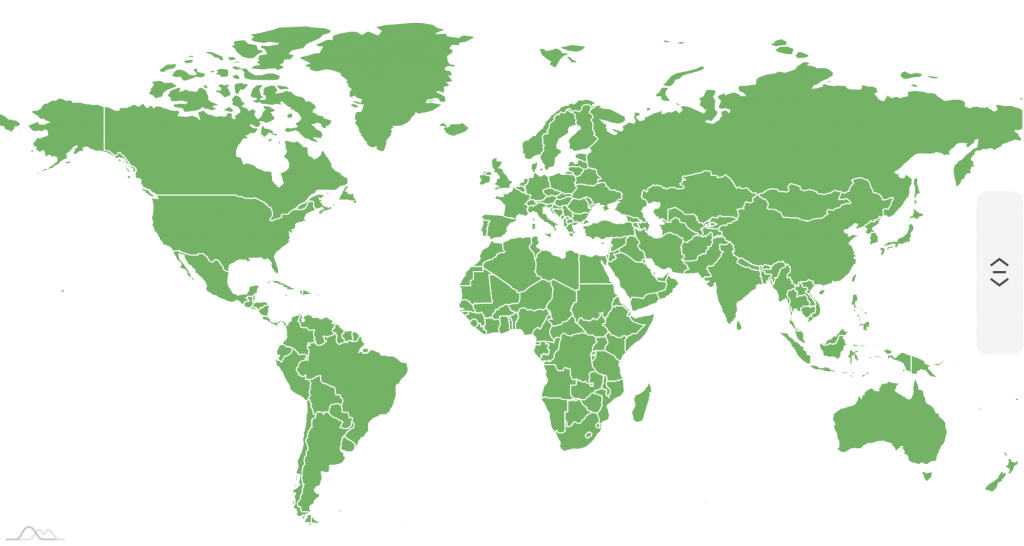
A drag grip visible on a map chart 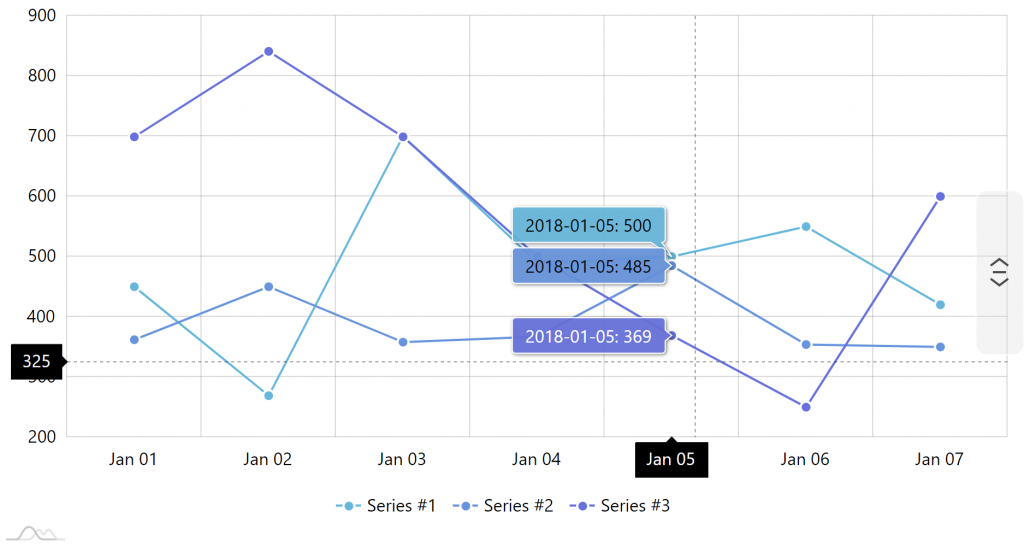
Drag grip on an XY chart
Positioning and sizing
By default, the grip will appear in the middle of the right chart edge and will take 30% of the chart's height (or width if grip is horizontal).
To change the position, we predictably use its position property, with available values being: "left", "right" (default), "top", and "bottom".
To change height when grip is either on the left or right, use its height property. Similarly, when grip is on top or bottom of the chart, use its width property.
Both height and width accept absolute pixel values (i.e. 100) or relative percent (i.e. am4core.percent(30)).
chart.dragGrip.position = "left";
chart.dragGrip.height = am4core.percent(60);
chart.dragGrip.position = "left";
chart.dragGrip.height = am4core.percent(60);
{
  // ...
  "dragGrip": {
    "position": "left",
    "height": "60%"
  }
}
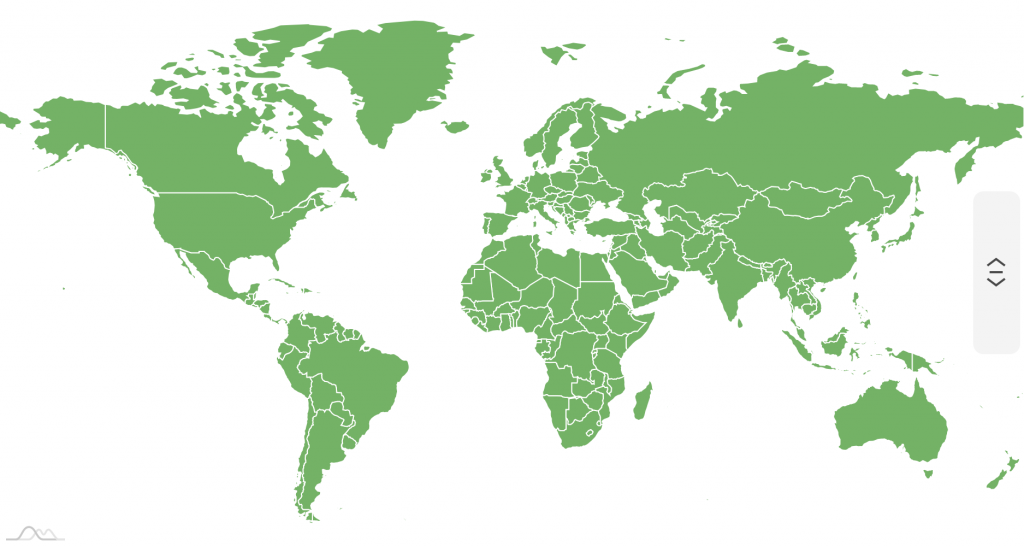
position = "right"height = am4core.percent(30)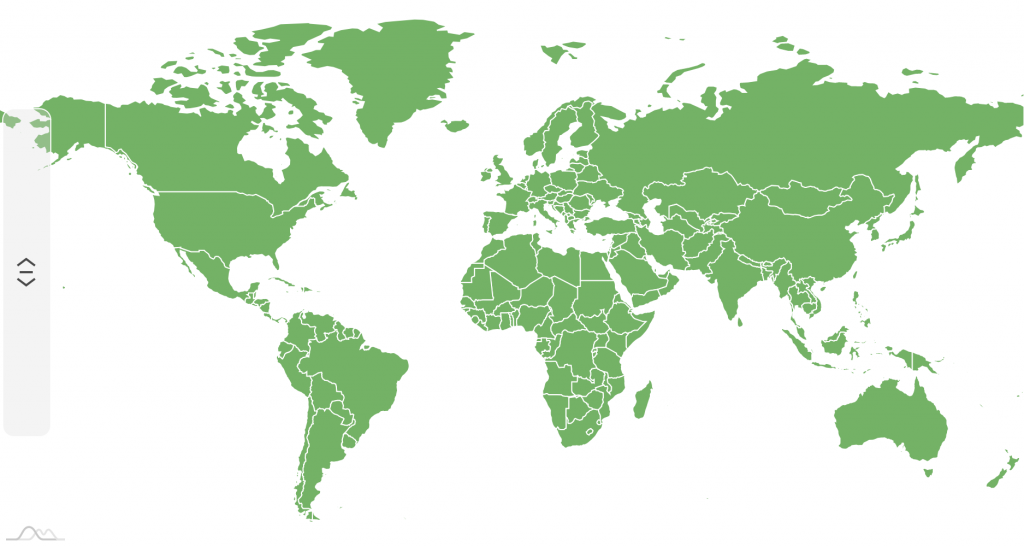
position = "left"height = am4core.percent(60)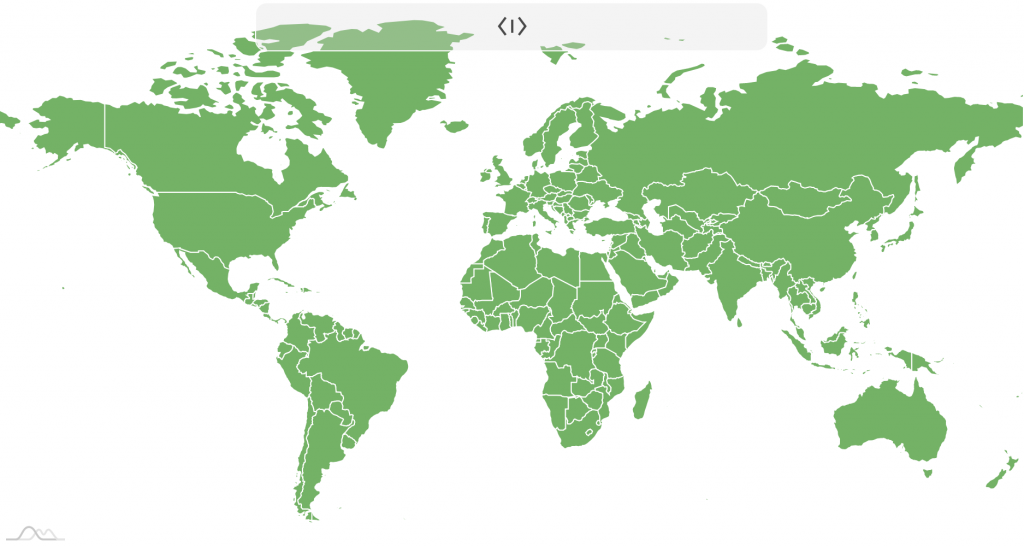
position = "top"width = am4core.percent(50)
Auto-hide timeout
To configure how long the drag grip will stay on screen use its autoHideDelay property. The value is in milliseconds, and the default is 3000 (3 seconds).
To disable auto-hiding of the grip, simply set autoHideDelay to 0 (zero).
chart.dragGrip.autoHideDelay = 5000;
chart.dragGrip.autoHideDelay = 5000;
{
  // ...
  "dragGrip": {
    "autoHideDelay": 5000
  }
}
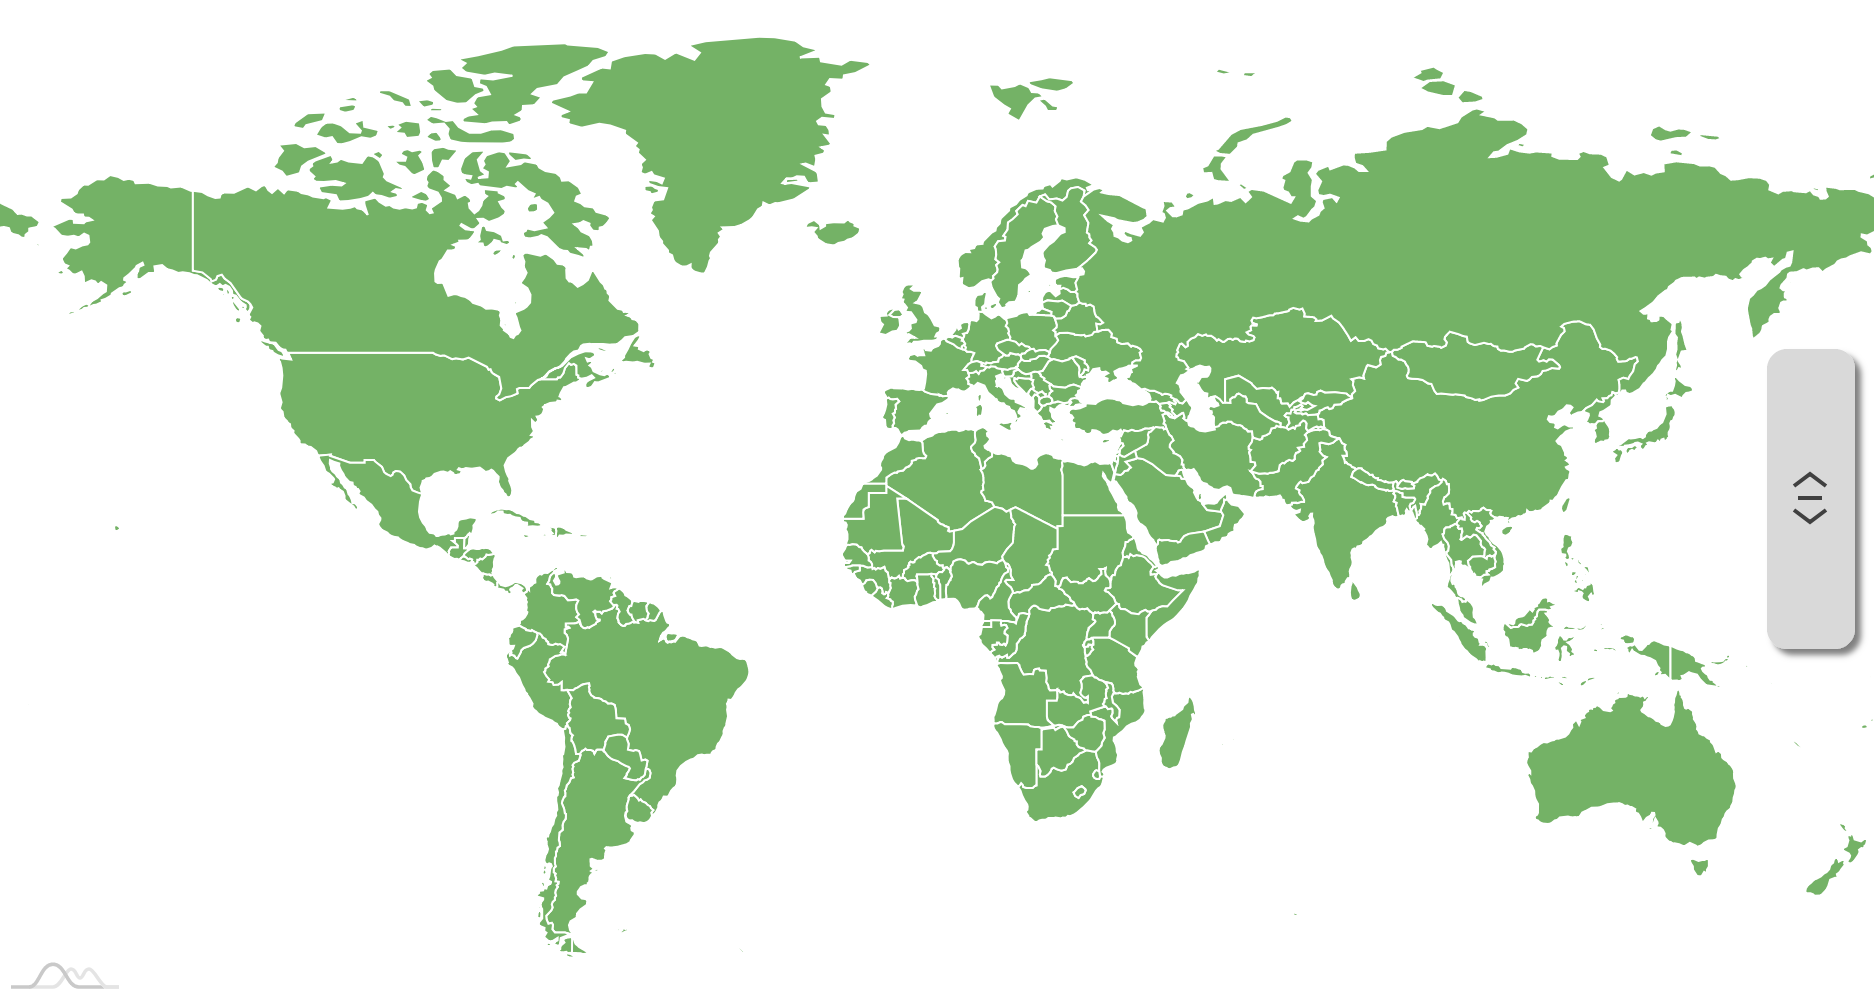
Grip appearance
A grip is essentially a Button. Check out Grip class reference for various options, states, and even events you can set on it.
As an example, if we'd like to modify grip's background, we could access it's background property:
chart.dragGrip.background.fill = am4core.color("#5f9");
chart.dragGrip.background.fillOpacity = 0.8;
chart.dragGrip.background.cornerRadius(0, 0, 0, 0);
chart.dragGrip.background.fill = am4core.color("#5f9");
chart.dragGrip.background.fillOpacity = 0.8;
chart.dragGrip.background.cornerRadius(0, 0, 0, 0);
{
  // ...
  "dragGrip": {
    // ...
    "background": {
      "fill": "#5f9",
      "fillOpacity": 0.8,
      "cornerRadiusTopLeft": 0,
      "cornerRadiusTopRight": 0,
      "cornerRadiusBottomRight": 0,
      "cornerRadiusBottomLeft": 0
    }
  }
}
Need to change icon color? Use it's icon property:
chart.dragGrip.icon.stroke = am4core.color("#fff");
chart.dragGrip.icon.stroke = am4core.color("#fff");
{
  // ...
  "dragGrip": {
    // ...
    "icon": {
      "stroke": "#fff"
    }
  }
}
Fancy a nice shadow? Push it into grip's filters: (you might want to do some other adjustments as well)
chart.dragGrip.background.strokeWidth = 0;
chart.dragGrip.background.fillOpacity = 1;
chart.dragGrip.marginRight = 10;
chart.dragGrip.filters.push(new am4core.DropShadowFilter);
chart.dragGrip.background.strokeWidth = 0;
chart.dragGrip.background.fillOpacity = 1;
chart.dragGrip.marginRight = 10;
chart.dragGrip.filters.push(new am4core.DropShadowFilter);
{
  // ...
  "dragGrip": {
    // ...
    "background": {
      "strokeWdith": 0,
      "fillOpacity": 1
    },
    "marginRight": 10,
    "filters": [{
      "type": "DropShadowFilter"
    }]
  }
}
Grip example
See the Pen amCharts 4: dragGrip by amCharts team (@amcharts) on CodePen.
Hover functionality
By default, when you touch an element that has hover functionality - for example a column with tooltip content - the tap acts as both click and hover.
Mostly, this works intuitively and well. However, in some cases, like for example on MapChart which is both pinch-zoomable, dragable and also may have polygons with hover functionality, both things might produce messy results.
To avoid that, there's a global option disableHoverOnTransform available, which when set to "touch" or "always" will disable all hover functionality when dragging or resizing something (like map).
am4core.options.disableHoverOnTransform = "touch";
am4core.options.disableHoverOnTransform = "touch";