amCharts 4 provides two ways to create and configure charts: object based approach (which we discussed here) and providing config in JSON object. The latter is subject of this article.
What is it?
In a nutshell JSON config is a way to create a chart from a single JavaScript object, which contains all of the config, data, and possibly other stuff.
Here's an example, so that you know what we're talking about:
<script src="//www.amcharts.com/lib/4/core.js"></script>
<script src="//www.amcharts.com/lib/4/charts.js"></script>

<div id="chartdiv" style="width: 900px; height 800px;"></div>

<script>
// Create chart instance in one go
var chart = am4core.createFromConfig({
	// Create pie series
	"series": [{
		"type": "PieSeries",
		"dataFields": {
			"value": "litres",
			"category": "country"
		}
	}],

	// Add data
	"data": [{
		"country": "Lithuania",
		"litres": 501.9
	}, {
		"country": "Czech Republic",
		"litres": 301.9
	}, {
		"country": "Ireland",
		"litres": 201.1
	}, {
		"country": "Germany",
		"litres": 165.8
	}, {
		"country": "Australia",
		"litres": 139.9
	}, {
		"country": "Austria",
		"litres": 128.3
	}, {
		"country": "UK",
		"litres": 99
	}, {
		"country": "Belgium",
		"litres": 60
	}, {
		"country": "The Netherlands",
		"litres": 50
	}],

	// And, for a good measure, let's add a legend
	"legend": {}

}, "chartdiv", am4charts.PieChart);
</script>
Pros and cons
The good
The most obvious benefit of JSON-based approach is that it's serializable. This means that the whole chart can be saved, loaded, transferred without losing anything.
This is not possible with regular objects, that cannot be serialized. Try saving a regular chart object into a database. No? Didn't think so.
This opens up a lot of dynamic charting possibilities. For example, we can have a dynamic dashboard, which based on user's interaction, can load a chart config and data from the server, instantiate it and display to user, without ever needing to reload the page.
Another plus for JSON is that, apparently, it's feels more natural and readable for some people. The hierarchical structure is very prominent, something that is less obvious with standalone objects.
The bad
There are trade-offs, of course.
If used with TypeScript, using JSON means sacrificing the whole type-check and code-completion goodness.
JSON is also much more sensitive to errors. A simple comma, missed somewhere, may invalidate the whole config and prevent the chart from appearing at all.
How it works
As we saw above, JSON config is basically a hierarchical representation of a chart object with all it's properties, as well as properties of its children, and so on.
Structure of JSON config
Chart, or any of its descendant elements, are basically a JavaScript object.
Objects can have methods and properties. Methods (or functions) cannot be represented by JSON, so we are not going to concern us with them.
Instead we're going to focus on properties.
Each object has a set list of properties, that can be of basic types, like number or string, arrays of elements, or other objects. Now, those properties-objects, can have properties of their own, hence the need for hierarchical structure of JSON.
Which properties are available for which object is listed in our Class Reference. For clarity sake, take a minute to take a look at, say, PieChart's properties.
This "real world" hierarchy is replicated when creating chart config representation in JSON.
Example
Let's put this into perspective.
Say we have a working PieChart object. Among other other properties it has these three:
innerRadiuscolorsseries
innerRadius is a simple property, which indicates inner radius of the pie chart. Make it anything more than a zero and you'll turn your "pie" chart into a "donut" chart.
In a JSON world we'd set it as a simple property:
{
  "innerRadius": 50
}
colors is much more interesting. It's an object of type ColorSet, which provides colors for the PieChart's slices. Since it's an object, it probably has properties of its own, that we might want to set.
In JSON we will represent it as another nested object, which is assigned to a property of the parent object. (PieChart in our case)
Upon examining ColorSet properties, we want to set a hard-coded list of colors for our PieChart Slices. That's a property named list which is an array of Color objects. Technically, we'd need to populate it with a Color objects, but amCharts JSON processor has some handy simplifications, which allows specifying a string RGB code in place of a Color object. More on that later in this tutorial.
{
  "colors": {
    "list": ["#ff0000", "#00ff00", "#0000ff" ]
  }
}
OK, so the above means: take what's in the chart's property colors, then try to set its property list to an array ["#ff0000", "#00ff00", "#0000ff" ].
Now, let's check out series. Going back to PieChart's property reference we see that this is an object of type List that holds objects of type PieSeries.
(for the rundown of what PieSeries is and in general what makes PieChart tick, visit our "Anatomy of a Pie Chart" article)
A List object is basically an array on steroids. You can still push() stuff into it, but for internal reasons, we're using List instead of basic array.
A very basic PieSeries, at the very least will have dataFields which is an object indicating Serie's relation to data. It might also have a name and possibly other settings.
So now we have a property which contains a list of objects that have properties of their own, that have properties that are also objects and have properties... you see where this is going.
Let's look at the JSON of it:
{
  "series": [{
    "dataFields": {
      "value": "revenue",
      "category": "department"
    }
  }]
}
That concludes our introductory section of how "real-life" objects map to their JSON representation.
Now that we have it under our belts, let's move to a more advanced topics, which you'll need when building chart configs.
Type of the object
Earlier in this article we were assigning basic objects to properties that are supposed to be instances of objects of certain class.
Consider our previous series example:
{
  "series": [{
    "dataFields": {
      "value": "revenue",
      "category": "department"
    }
  }]
}
From the JSON processor's perspective this means the following:
- Get
seriesvalue from the currently being processed object; (it's an empty List on a new chart) - Create an instance of class that is suitable for this particular List; (in this case it's PieSeries)
- On object we just created, assign property
valueto "revenue" andcategoryto "department"; - Push the new object into List that is in the
series.
We have building you up to a particular point. The key was the point (2) in our list of actions.
The processor has to know what type of object to create. In some cases JSON processor can "predict" what type of object we require. E.g. a PieChart can only have only PieSeries, so it's pretty safe to assume we are trying to create a PieSeries, and be forgiving about not having specified the type explicitly.
Another "forgiving" example is a legend property, which every chart type has. However, there's only one and only Legend. There are no other Legend types, so we can get away without specifying the object type when we set properties to a Legend object.
That said, there are situations, where it's impossible to reliably determine object type, so we need to explicitly specify it in JSON.
Going back to series example, let's take an XYChart. Now, it can have Series of may different types: LineSeries, ColumnSeries, CandlestickSeries, and some others.
Now, if we tried to insert a config object into XYChart's series without specifying its type, we'd get an error, because JSON processor would not be able to determine what type of Series we want to create.
That's where type property comes into play.
{
  "series": [{
    "type": "LineSeries",
    "dataFields": {
      "value": "revenue",
      "category": "department"
    }
  }, {
    "type": "ColumnSeries",
    "dataFields": {
      "value": "profit",
      "category": "department"
    }
  }]
}
JSON processor is now happy, because we have explicitly specified the type for both of the series we are trying to add to our XYChart.
NOTE It's a good habit to specify a type of the object. Certainly much easier to remember to do it, than to consider whether JSON processor will be able to "deduce" it for you.
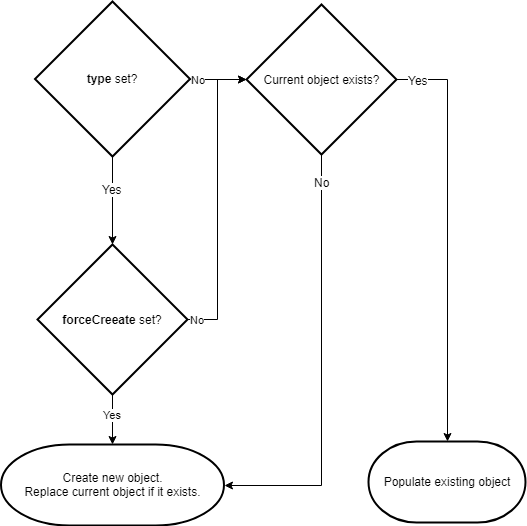
Creating or reusing?
There are some situations where some properties already contain a pre-made instance of some object, but we want to override it with a new instance.
In this case, specifying type keyword serves as a direct instruction to do so.
Formatters is a good example: say a Value axis and the Chart has properties numberFormatter. Both point to the same instance of NumberFormatatter.
This means that setting properties to numberFormatter of the value axis, will set same properties for the whole chart:
{
  // ...
  "numberFormatter": {
    "numberFormat": "#"
  },
  "yAxes": [{
    // ...
    "numberFormatter": {
      "numberFormat": "#.00"
    }
  }]
}
The above example might assume that number format "#" will be used throughout the chart, and "#.00" just for the value axis.
In reality, all of the chart will use "#.00" since numberFormatter holds the same object, so the last setting of numberFormat will be used.
To fix that we need to instruct chart to create a separate instance of NumberFormatter just for the value axis. And we do that by specifying a type as well as forceCreate keywords:
{
  // ...
  "numberFormatter": {
    "numberFormat": "#"
  },
  "yAxes": [{
    // ...
    "numberFormatter": {
      "type": "NumberFormatter",
      "forceCreate": true,
      "numberFormat": "#.00"
    }
  }]
}
Before you go: the above situation warrants some explanation how re-using existing objects works versus overwriting them with a completely new instance.
Referring objects by their IDs
Sometimes objects need to refer to some other objects on the chart. For example, an XYSeries might need to reference an Axis it has attached to. Similarly, XYChartScrollbar needs to know which Series to use for its background.
That's where referring objects by their id's come in.
It's a two part process:
- You set and
idof the target object; - You use that id to refer to specific object in a property of some other object.
To put it into perspective, let's examine our Series/Axis relation:
{
  "yAxes": [{
    "type": "ValueAxis",
    "id": "v1"
  }, {
    "type": "ValueAxis",
    "id": "v2"
  }],
  "series": [{
    "yAxis": "v1",
    "type": "LineSeries",
    "dataFields": {
      "value": "revenue",
      "category": "department"
    }
  }, {
    "yAxis": "v2",
    "type": "ColumnSeries",
    "dataFields": {
      "value": "profit",
      "category": "department"
    }
  }]
}
The above will create two Value Axes (id'ed "v1" and "v2" respectively), and two Series. First one will bind to a Value Axis "v1", the second one to "v2".
Similarly, it can be used in List/Array properties as well:
{
  "series": [{
    "id": "s1",
    "type": "LineSeries",
    "dataFields": {
      "value": "revenue",
      "category": "department"
    }
  }, {
    "id": "s2",
    "type": "ColumnSeries",
    "dataFields": {
      "value": "profit",
      "category": "department"
    }
  }],
  "scrollbarX": {
    "type": "XYChartScrollbar",
    "series": ["s1", "s2"]
  }
}
Creating a chart
To create a chart using JSON config, use the am4core.createFromConfig(config, container, chart_type_class) function.
Function's parameters:
| Parameter | Type | Description |
|---|---|---|
| config | Object |
A JavaScript object representing hierarchical structure of object properties and their respective values. |
| container | HTMLElementor string |
A target HTML element to create the chart in. |
| chart_type_class | Class reference or class name |
A reference to a chart type class, e.g. am4charts.PieChart, am4charts.XYChart, am4maps.MapChart, etc. or it's name as string (without namespace): "PieChart", "XYChart", "MapChart". |
NOTE am4core.createFromConfig() function will return a fully valid chart object, which you can then manipulate and change as with the object-based approach. You can update its or its children's properties, even add new elements.
Data in JSON
From the chart's perspective, data is just like any other property. You can set it directly to chart object, or add it to JSON config, it will work exactly as you would expect. For an example, check out one at the beginning of this article.
List templates
List templates are basically beefed up arrays. Represented by ListTemplate class, they have a property template which defines a sample object which is used as a "cookie cutter" when creating new elements in the list.
As an example Column series' columns property is a list template. Normally, to configure all elements in the list you would set properties on a template property of the list.
Not so in JSON configs!
In JSON you skip the keyword template and go straight to properties:
It is also possible to supply events as an array of objects. Each object has to have type and callback properties:
{
  // ...
  "series": [{
    "type": "ColumnSeries",
    // ...
    "columns": {
      "strokeWidth": 2,
      "fillOpacity": 0.5
    }
  }]
}
If we used object-based config we would be setting those same properties via template tag:
series.columns.template.strokeWidth = 2;
series.columns.template.fillOpacity = 0.5;
series.columns.template.strokeWidth = 2;
series.columns.template.fillOpacity = 0.5;
MORE INFO For more information about list templates, read our dedicated "List templates" article.
Lists
Lists are much like List templates minus the template part. Those are basically arrays with some additional functions.
What it means for JSON config is that it accepts only array as its source value.
When populating a List property, parser will iterate through items of the source array, and:
- Create objects out of them if necessary
push()new item into target List or... - Set properties of the existing list item.
Whether new object is pushed or existing one is updated depends on how many items there already are in the target List and in source array.
Suppose, we're setting heatRules of the series. Normally, this property is empty. If our JSON config contains two entries, both of them will be created.
{
  "series": [{
    // ...
    "heatRules": [{
      // ...
    }, {
      // ...
    }]
  }]
}
Now, let's say some plugin pre-fills all series' heatRules with a single entry. At the moment of JSON config, heatRules now is not empty.
What will happen is that the first heat rule from our JSON config will not be created, but rather its properties will override properties of the existing item.
There is no second heat rule in target list, so the second rule will be created.
There is a way to force creation of items. To do so, set forceCreate: true:
{
  "series": [{
    // ...
    "heatRules": [{
      "forceCreate": true,
      // ...
    }, {
      "forceCreate": true,
      // ...
    }]
  }]
}
The above will ensure that both rules will be added to the heatRules regardless of what is currently going on in the target List.
Event listeners
Most of the functional objects in amCharts 4 from time to time invoke some events. For example PieSeries we've already got acquainted with, has an event "hide", which is invoked when the whole Series is hidden.
We can add a custom function - listener - which will be invoked when this event occurs.
Adding such event listeners is done via events property. We set it to an object. Object's key is event id ("hide") in out case, while value is reference to a custom handler function.
{
  "series": [{
    "dataFields": {
      "value": "revenue",
      "category": "department"
    },
    "events": {
      "hide": function(ev) {
        console.log("Oh noes! A PieSeries was hidden.");
      },
      "show": function(ev) {
        console.log("Ah, there it is. Phew...");
      }
    }
  }]
}
It is also possible to supply events as an array of objects. Each object has to have type and callback properties:
{
  "series": [{
    "dataFields": {
      "value": "revenue",
      "category": "department"
    },
    "events": [{
      "type": "hide",
      "callback": function(ev) {
        console.log("Oh noes! A PieSeries was hidden.");
      }
    }, {
      "type": "show",
      "callback": function(ev) {
        console.log("Ah, there it is. Phew...");
      }
    }]
  }]
}
Adapters
Adapters (more about them here) work in much the same way as events. You set object's adapter property to an object that has adapter ids as its keys and function references to call when applying adapters.
{
  "series": [{
    "dataFields": {
      "value": "revenue",
      "category": "department"
    },
    "adapter": {
      "tooltipText": function(val) {
        return "This is a PieSeries: " + val
      }
    }
  }]
}
Just like events, Adapters can be also listed in an array. Each object in the array must at least contain key and callback properties. The third property - priority - is optional.
{
  "series": [{
    "dataFields": {
      "value": "revenue",
      "category": "department"
    },
    "adapter": [{
      "key": "tooltipText",
      "callback": function(val) {
        return "This is a PieSeries: " + val
      }
    }]
  }]
}
Callbacks
JSON processor provides means to have custom function called on each processed object in the chart.
For that simply set callback property with a reference to function, e.g.:
{
  // ...
  "chartContainer": {
    "children": [{
      "type": "Container",
      "layout": "absolute",
      "paddingBottom": 15,
      "callback": function() {
        this.toBack();
      },
      "children": [{
        "type": "Label",
        "text": "Value",
        "fontWeight": 600,
        "align": "left",
        "paddingLeft": 10
      }, {
        "type": "Label",
        "text": "January 1st, 2018 -- March 31st, 2018",
        "fontWeight": 600,
        "align": "right"
      }]
    }]
  }
}
With the above code, when JSON processor creates a new Container it will call the custom function we have set in callback. That function's scope will be the Container object itself, hence this referring to it correctly.
Reusing same config for multiple charts
IMPORTANT NOTE A JSON config object, passed into createFromConfig() cannot be reused for multiple charts!
A config that we use to create a chart might, and probably will get mutated by the JSON processor, replacing and filling properties with references with real chart objects.
This makes a config that was already used for one chart, not usable for creating another chart.
If you need to use same config object to cookie-cut charts, make sure you use "copies" of the config rather than same object.
There are many methods to copy JS objects. Probably the most wide-spread and simple one is using JSON object in JavaScript:
function cloneJSON(source) {
  return JSON.parse(JSON.stringify(source));
}

let chart1 = am4core.createFromConfig(cloneJSON(config), ....);
let chart2 = am4core.createFromConfig(cloneJSON(config), ....);
function cloneJSON(source) {
  return JSON.parse(JSON.stringify(source));
}

var chart1 = am4core.createFromConfig(cloneJSON(config), ....);
var chart2 = am4core.createFromConfig(cloneJSON(config), ....);
Mixed configuration
While JSON config is primarily meant to serialize the whole chart setups, it can be used to apply config to its individual elements.
To apply a JSON config to an amCharts element, simply assign a config object to target's config property.
Consider the following example:
var pieSeries = new am4charts.PieSeries();
chart.series.push(pieSeries);

pieSeries.dataFields = {
  "value": "revenue",
  "category": "department"
};

pieSeries.events.on("hide", function(ev) {
  console.log("Oh noes! A PieSeries was hidden.");
});

pieSeries.events.on("show", function(ev) {
  console.log("Ah, there it is. Phew...");
});
The above is a way to create a Series and set it up in a purely object-based approach.
We can use JSON to provide config for just the series:
var pieSeries = new am4core.pie.PieSeries();
chart.series.push(pieSeries);

pieSeries.config = {
  "dataFields": {
    "value": "revenue",
    "category": "department"
  },
  "events": {
    "hide": function(ev) {
      console.log("Oh noes! A PieSeries was hidden.");
    },
    "show": function(ev) {
      console.log("Ah, there it is. Phew...");
    }
  }
};
While looking a bit awkward, this type of mixed setup introduces a whole new level of flexibility, which you might find yourself exploiting. Or not. Your choice.
JSON in TypeScript
Up until now, you might have had an impression, that JSON config is only for JavaScript setups. It's not. It will work just as well in TypeScript.
Just wanted you to know that. ;)
