ForceDirectedTree is an exciting cool way to display relations between a number of entities. This tutorial will show how you can give those relations a quantitative value by applying custom width to each individual link.
The task
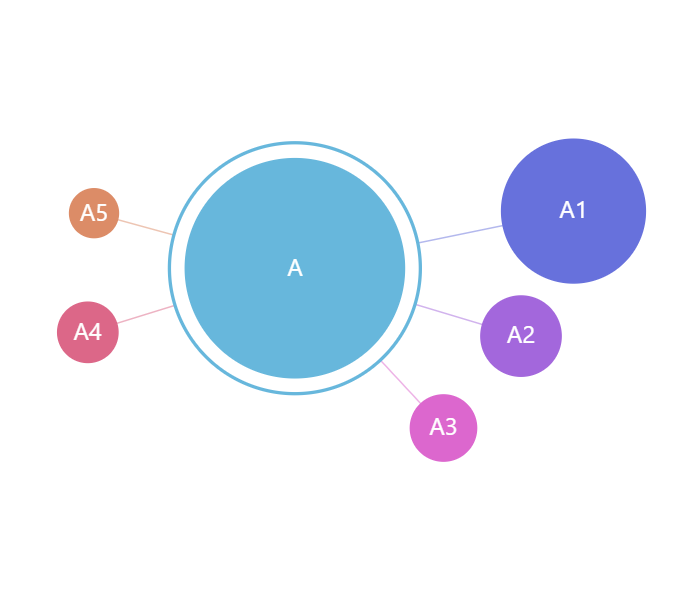
As mentioned in the preamble of this tutorial, all nodes on ForceDirectedTree are connected by links that are simple, equal width lines.
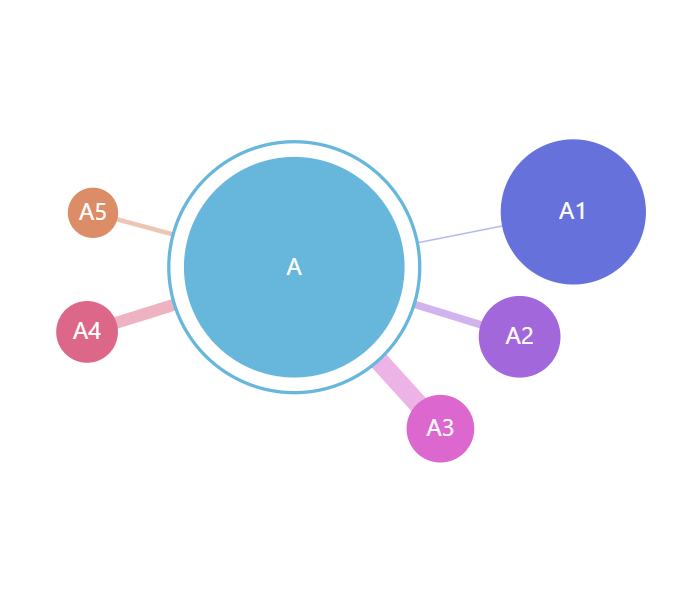
However, as data goes, some links might carry more weight than the others, and we want to convey that by making more important links thicker.

Default behavior 
Target behavior
To set the width of the links, we would use strokeWidth property of the series' link template:
series.links.template.strokeWidth = 5;
series.links.template.strokeWidth = 5;
{
  // ...
  "series": [{
    // ...
    "links": {
      "strokeWidth": 5
    }
  }]
}
While it would make links thicker, it does not solve our task, since it would affect all of the links.
Let's see how we can solve this in the next chapter.
Setting individual link width
There are a few ways to achieve this. Let's start with the simplest.
Using property fields
"Property fields" is a functionality that allows binding any property of any element to any key in data.
MORE INFO For more info about property fields and how they work read here.
Basically, what we are going to do, is to include additional fields in our data that would carry value of strokeWidth for each individual node, or more like link to it.
[{
  "name": "A",
  "children": [{
    "name": "A1", "value": 415
  }, {
    "name": "A2", "value": 148, "linkWidth": 5
  }, {
    "name": "A3", "value": 89, "linkWidth": 13
  }, {
    "name": "A4", "value": 64, "linkWidth": 8
  }, {
    "name": "A5", "value": 16, "linkWidth": 3
  }]
}]
Now, all we need to do is to use link template's propertyFields to connect its strokeWidth property to a "linkWidth" field in data:
series.links.template.propertyFields.strokeWidth = "linkWidth";
series.links.template.propertyFields.strokeWidth = "linkWidth";
{
  // ...
  "series": [{
    // ...
    "links": {
      "propertyFields": {
        "strokeWidth": "linkWidth"
      }
    }
  }]
}
And here's a live example:
See the Pen amCharts 4: Selective link widths on ForceDirectedTree by amCharts team (@amcharts) on CodePen.
Using adapters
Property fields is a good and quick way to bind link width to an absolute pixel values in data fields. However, they do not allow for any conditional or calculative logic.
What if we wanted assign an arbitrary link importance value, rather than pixel width?
[{
    "name": "A1", "value": 415
  }, {
    "name": "A2", "value": 148, "traffic": "low"
  }, {
    "name": "A3", "value": 89, "traffic": "high"
  }, {
    "name": "A4", "value": 64, "traffic": "medium"
  }, {
    "name": "A5", "value": 16, "traffic": "medium"
  }]
}]
Naturally, we can't bind strokeWidth which expects a numeric value to data fields that hold words like "low" or "high".
That's where "adapters" come in.
An adapter is a function which we can attach to element's property that will run before property's value is used, so that it can modify the value itself according to some logic.
MORE INFO For more info about what adapters are and how they work, read here.
OK, so we will need an adapter that will translate arbitrary values like "low", "medium", and "high" into actual pixel values.
series.links.template.adapter.add("strokeWidth", function(width, target) {
  switch(target.dataItem.dataContext.traffic) {
    case "high":
      return 20;
    case "medium":
      return 10;
    case "low":
      return 5;
  }
  return width;
});
series.links.template.adapter.add("strokeWidth", function(width, target) {
  switch(target.dataItem.dataContext.traffic) {
    case "high":
      return 20;
    case "medium":
      return 10;
    case "low":
      return 5;
  }
  return width;
});
{
  // ...
  "series": [{
    // ...
    "links": {
      "adapter": {
        "strokeWidth": function(width, target) {
          switch(target.dataItem.dataContext.traffic) {
            case "high":
              return 20;
            case "medium":
              return 10;
            case "low":
              return 5;
          }
          return width;
        }
      }
    }
  }]
}
In the above code, our adapter function receives target parameter with is a ForceDirectedLink object representing particular link.
It contains its own data item, which in turn has dataContext which is a reference to particular data item in our data.
We are using it to determine arbitrary "importance" of the link and therefore translate it into actual pixel of the link.
Again, here's a working example:
See the Pen amCharts 4: Selective link widths on ForceDirectedTree (using adapter) by amCharts team (@amcharts) on CodePen.
In the following chapter we'll see how adapter approach can be useful in a more complex network diagrams as well. Read on.
Cross-linked nodes scenario
ForceDirectedTree is not limited to links between parent and child nodes. Any two nodes, including ones on separate branches and event levels can be linked together, using linkWith data field.
MORE INFO Read more about cross-linking nodes.
Data-wise, it looks like this:
[{
  "name": "A",
  "children": [{
    "name": "A1", "value": 415, "link": ["A5", "A3"]
  }, {
    "name": "A2", "value": 148, "link": ["A4"]
  }, {
    "name": "A3", "value": 89
  }, {
    "name": "A4", "value": 64
  }, {
    "name": "A5", "value": 16
  }]
}]
This creates a problem for us: in previous examples each link had a separate data item attached to it, where we could attach link weight information in one way or another. In this setup, cross-links between notes are represented by a simple array identifying cross-link nodes just by their names/ids, so there's no "place" to attach weight information.
Thankfully, adapters are functions so we can make them as complicated as possible, including digging and interpreting data as deeply as we need it.
Let's add individual link weight information in some arbitrary fashion:
[{
  "name": "A", "linkWidths": {
    "A1": 20,
    "A2": 10,
    "A5": 15
  },
  "children": [{
    "name": "A1", "value": 415, "link": ["A5", "A3"], "linkWidths": {
      "A5": 10,
      "A3": 5
    }
  }, {
    "name": "A2", "value": 148, "link": ["A4"], "linkWidths": {
      "A4": 10
    }
  }, {
    "name": "A3", "value": 89
  }, {
    "name": "A4", "value": 64
  }, {
    "name": "A5", "value": 16
  }]
}]
As you can see we're introducing an arbitrary value "linkWidths" which is an object attaching a value to a link to specific other node, be it node's child, or a sibling.
Now, all we need to do is to modify our adapter to "understand" this structure:
series.links.template.adapter.add("strokeWidth", function(width, target) {
  let from = target.source;
  let to = target.target;
  let widths = from.dataItem.dataContext.linkWidths;
  if (widths && widths[to.dataItem.id]) {
    return widths[to.dataItem.id];
  }
  return width;
});
series.links.template.adapter.add("strokeWidth", function(width, target) {
  var from = target.source;
  var to = target.target;
  var widths = from.dataItem.dataContext.linkWidths;
  if (widths && widths[to.dataItem.id]) {
    return widths[to.dataItem.id];
  }
  return width;
});
{
  // ...
  "series": [{
    // ...
    "links": {
      "adapter": {
        "strokeWidth": function(width, target) {
          var from = target.source;
          var to = target.target;
          var widths = from.dataItem.dataContext.linkWidths;
          if (widths && widths[to.dataItem.id]) {
            return widths[to.dataItem.id];
          }
          return width;
        }
      }
    }
  }]
}
The adapter function receives ForceDirectedLink object as a target parameter.
The object conveniently has source and target properties, that hold references to ForceDirectedNode objects link originates in and ends at.
We use those to find out source and target node ids, so that we can compare against our custom "linkWidths" array in source node data context.
And here's working chart:
See the Pen amCharts 4: Selective link widths on ForceDirectedTree (using adapter + crosslinked) by amCharts team (@amcharts) on CodePen.