During the course of this article we're going to learn how to automatically place labels over map polygons, as well as make them positioned just the right way.
Base map
As a polygon of our development, let's use a map of the United States in an Albers USA projection.
See the Pen amCharts 4: Labels over map tutorial by amCharts team (@amcharts) on CodePen.
Series for polygons
Setting up Polygon series is covered in great detail in "Polygon (area) series", so we're not going to repeat the whole stuff here.
There's one tiny but important thing we need to mention, though. It's a property - calculateVisualCenter - which enables calculations of the "visual center" for each map polygon in the series. The importance of it is explained in the final chapter of this tutorial.
let polygonSeries = chart.series.push(new am4maps.MapPolygonSeries());
polygonSeries.useGeodata = true;
polygonSeries.calculateVisualCenter = true;
var polygonSeries = chart.series.push(new am4maps.MapPolygonSeries());
polygonSeries.useGeodata = true;
polygonSeries.calculateVisualCenter = true;
{
  // …
  "series": [{
    "type": "MapPolygonSeries",
    "useGeodata": true,
    "calculateVisualCenter": true
  }]
}
Series for labels
Setting up series
To place stuff on the map, we need a series. We're going to use MapImageSeries which basically allows putting any marker, including Label at any coordinate.
Let's create and set up that series now, making sure we do this:
- Create
MapImageSeries. - Add
Labelto its template. - Configure label template for font size, alignment, etc.
- Make labels stay the same size when map is zoomed.
- Disable all interactivity for the label so it does not interfere with interactions with respective polygons.
We're not going to populate this label series with data just yet. That will be done automatically, as we will see later.
let labelSeries = chart.series.push(new am4maps.MapImageSeries());
let labelTemplate = labelSeries.mapImages.template.createChild(am4core.Label);
labelTemplate.horizontalCenter = "middle";
labelTemplate.verticalCenter = "middle";
labelTemplate.fontSize = 10;
labelTemplate.nonScaling = true;
labelTemplate.interactionsEnabled = false;
var labelSeries = chart.series.push(new am4maps.MapImageSeries());
var labelTemplate = labelSeries.mapImages.template.createChild(am4core.Label);
labelTemplate.horizontalCenter = "middle";
labelTemplate.verticalCenter = "middle";
labelTemplate.fontSize = 10;
labelTemplate.nonScaling = true;
labelTemplate.interactionsEnabled = false;
{
  // …
  "series": [{
    "type": "MapPolygonSeries",
    // …
  }, {
    "type": "MapImageSeries",
    "children": [{
      "type": "Label",
      "horizontalCenter": "middle",
      "verticalCenter": "middle",
      "fontSize": 10,
      "nonScaling": true,
      "interactionsEnabled": false
    }]
  }]
}
Populating with data
Our series is done. All it needs is data.
Since we're aiming to display a label for each state, we will use actual elements from our MapPolygonSeries to populate MapImageSeries.
Since we also need to know where to place our labels, we need polygon series ready before we start placing our label markers, so that we can derive center coordinates for each state.
For this, "inited" event seems to be perfect. It will kick in when our Polygon series is ready - perfect time to start creating labels.
polygonSeries.events.on("inited", function () {
  polygonSeries.mapPolygons.each(function (polygon) {
    let label = labelSeries.mapImages.create();
    let state = polygon.dataItem.dataContext.id.split("-").pop();
    label.latitude = polygon.visualLatitude;
    label.longitude = polygon.visualLongitude;
    label.children.getIndex(0).text = state;
  });
});
polygonSeries.events.on("inited", function () {
  polygonSeries.mapPolygons.each(function (polygon) {
    var label = labelSeries.mapImages.create();
    var state = polygon.dataItem.dataContext.id.split("-").pop();
    label.latitude = polygon.visualLatitude;
    label.longitude = polygon.visualLongitude;
    label.children.getIndex(0).text = state;
  });
});
{
  // …
  "series": [{
    "type": "MapPolygonSeries",
    // …
    "events": {
      "inited": function(ev) {
        var polygonSeries = ev.target;
        var chart = ev.target.baseSprite;
        var labelSeries = chart.series.getIndex(1);
          polygonSeries.mapPolygons.each(function (polygon) {
          var label = labelSeries.mapImages.create();
          var state = polygon.dataItem.dataContext.id.split("-").pop();
          label.latitude = polygon.visualLatitude;
          label.longitude = polygon.visualLongitude;
          label.children.getIndex(0).text = state;
        });
      }
    }
  }, {
    "type": "MapImageSeries",
    // …
  }]
}
And, we're done:
See the Pen amCharts 4: Labels over map tutorial by amCharts team (@amcharts) on CodePen.
Longitude vs. visual longitude
In the above code we have used polygon's visualLongitude and visualLatitude properties to determine where we should put our labels.
Polygons also have similar longitude and latitude properties. What is the difference between the two sets?
The latter (longitude/latitude) return polygons's geometrical center: an equal distance from all its edges. If all polygons were perfect symmetrical shapes, like squares and circles, that would a perfect center, indeed.
However, geographical reality is that countries, states, and other subdivisions are far from symmetrical, not even close. If we relied on geometrical centers of polygons, we'd end up with labels placed in odds nooks, and even outside the actual borders of the target polygon.
That's where the other two properties - visualLongitude and visualLatitude - come in. These use complex algorithms to compute a "visual center" for each polygon. That's usually the center of the biggest solid part of the polygon, like for instance largest island of Hawaii:
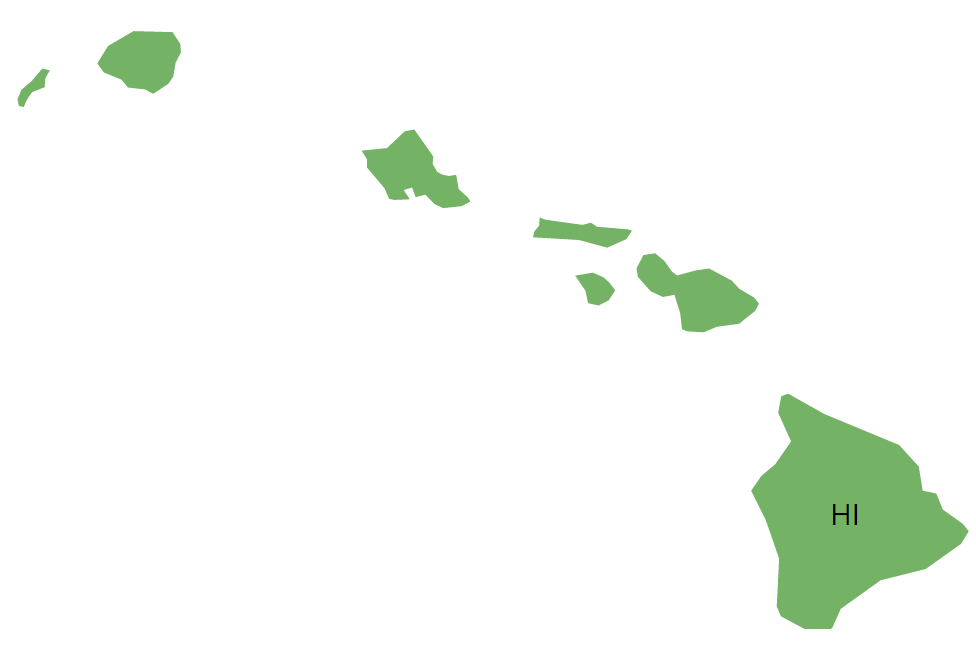
Visual center 
Geometrical center
Of course, calculating visual center is a much more complex operation, which requires some CPU overhead. This is why it is not enabled by default, and this is precisely why we had to enable it for or MapPolygonSeries as we've shown in previous sections.