The aim of this tutorial is to get you on the right track for creating your own maps in GeoJSON format, suitable for use with amCharts 4.
GeoJSON, being an open standard has a lot of traction and support in mapping software community. Moving forward, we may incorporate more instructions here, so make sure you check back in if you don't find what you're seeking for.
Unless you are creating a map from scratch (something that's out of scope of this tutorial), you have found a source map data in some format. Let's look at possible formats here.
GeoJSON
Congratulations! You're all set. amCharts 4 maps supports GeoJSON format out of the box. You can skip most of the subsequent steps and jump straight to "Final touches" section of this article.
Shapefile
Shapefile format (developed by Esri) is a de facto map data format in professional mapping community.
A map in shapefile format consists of a bunch of separate files, which we won't get into. We'll just need all those files in order to create fully-functional GeoJSON files.
Shapefile data source
There are many commercial and free sources for maps in shapefile format. Probably the best place to start off your search is Natural Earth website, which offers public domain (free) maps.
Using mapshaper
mapshaper is a powerful, yet free, command-line and online tool, that can be used to convert map data between different formats.
NOTE We're going to be using online version of mapshaper.
Source map
For the purpose of this tutorial, we're going to be creating a map of Washington State Unified School Districts. The shapefiles for this map is available as a free download via data.gov website.
Previewing the map
Mapshaper besides command line interface, also offers its online version, which can be used to load shape files and immediately view the map on your screen.
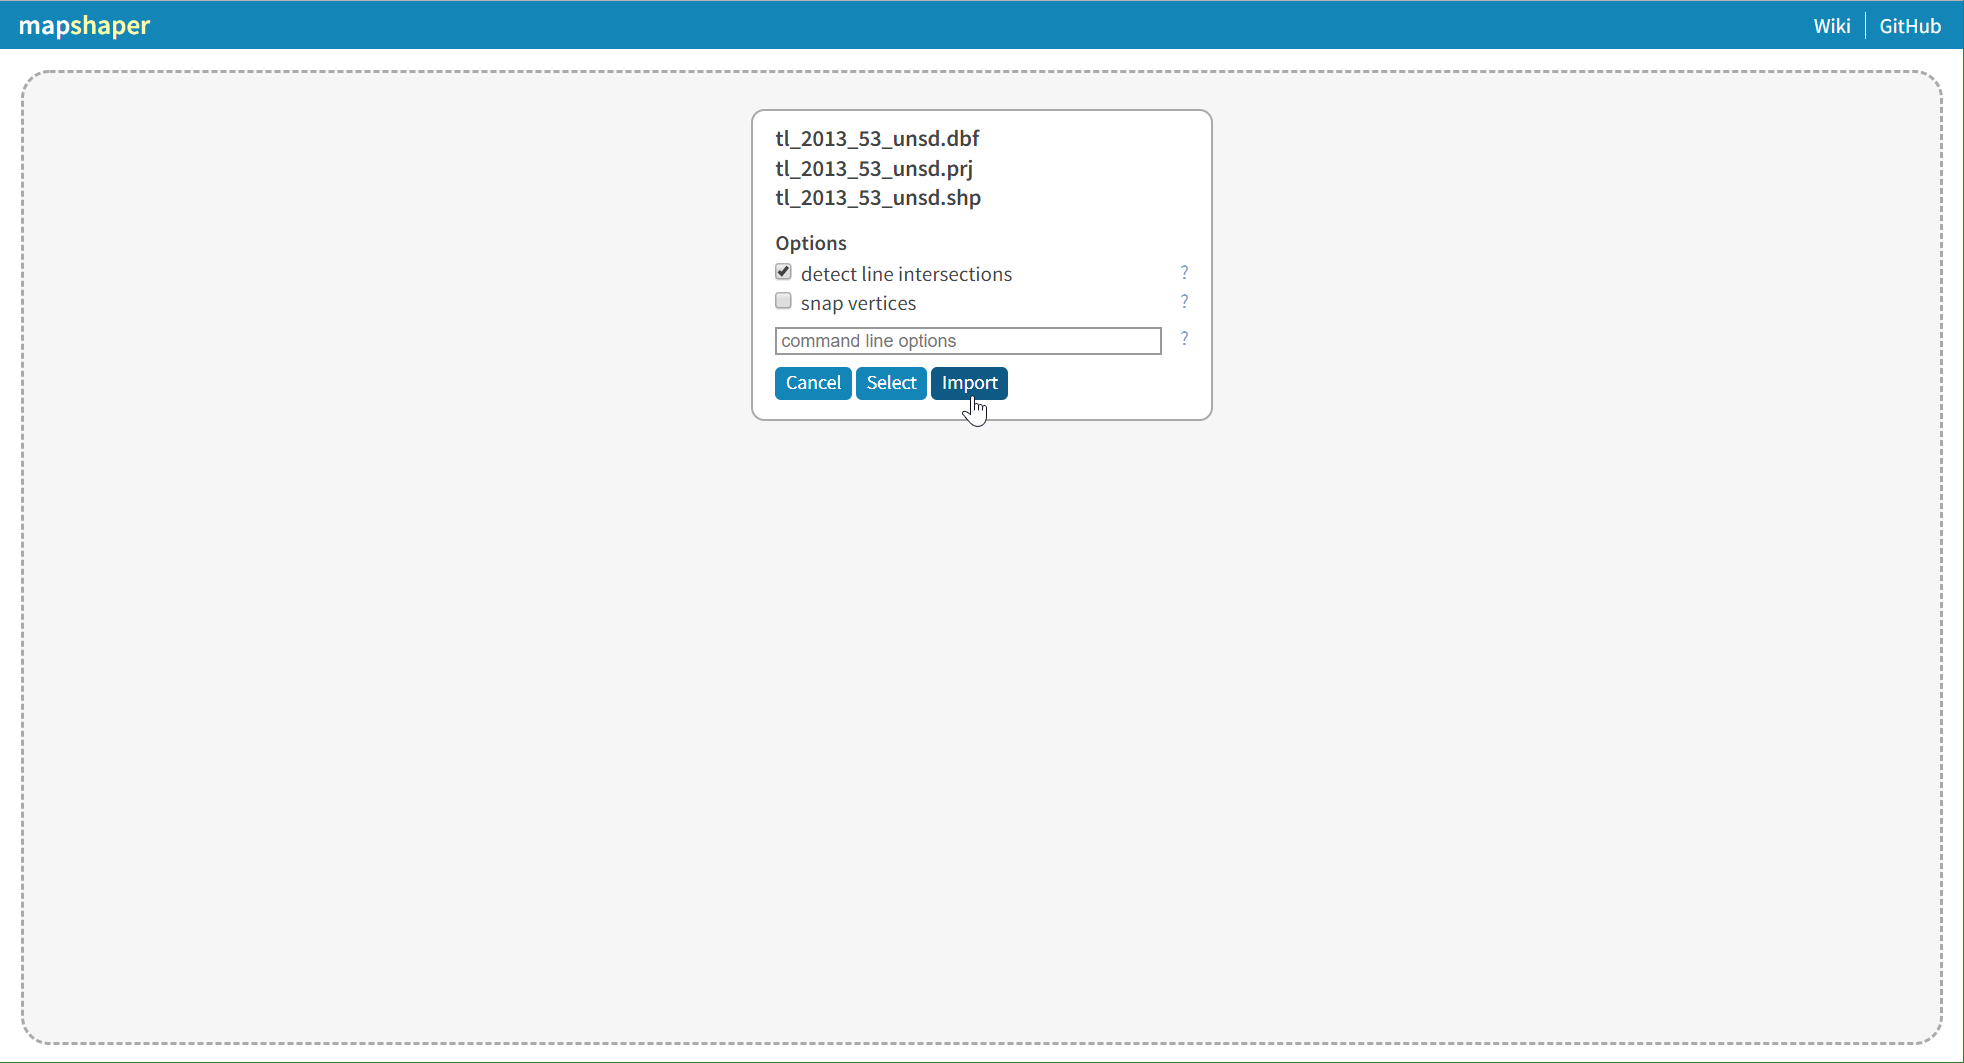
To do that, head over to mapshaper.org. Once there the website will offer you to upload the files to convert with. Simply drag the ZIP file containing all the shapefile mumbojumbo onto it, then click "Import" button. You should be able to see the map there.

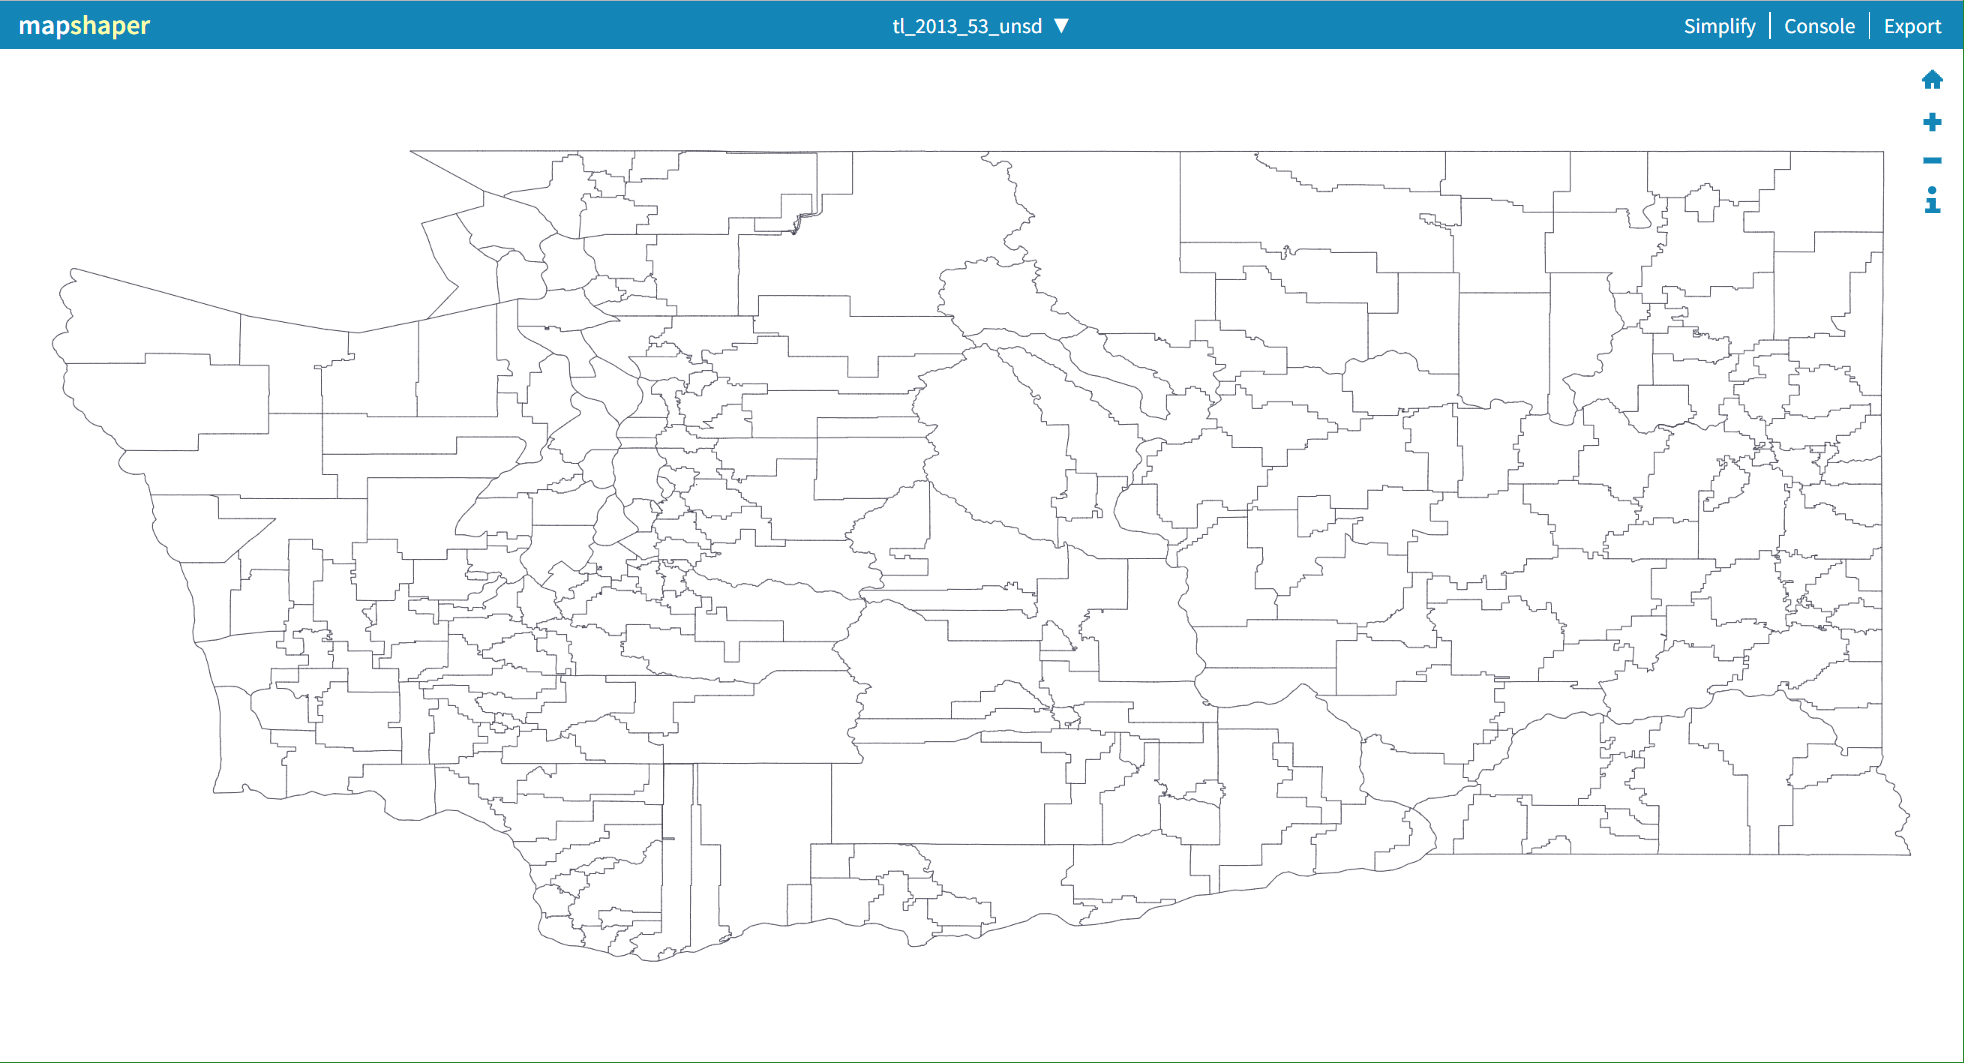
Looks good!
Identifying properties
Shapefile format contains not just graphical representation of area boundaries, but also additional data, called "properties".
The trouble with properties is that they do not seem to follow any specific format or convention when choosing their names. We'll need to manually identify which properties contain information that we need.
The single most important property is the area id. Without it, we won't be able to identify and attach functionality when creating our maps. Name is another property that would make sense to make use of.
To identify which properties contain what information, click on the little i icon on the right. Then click some area. You'll see a box pop up with all the properties for that area.
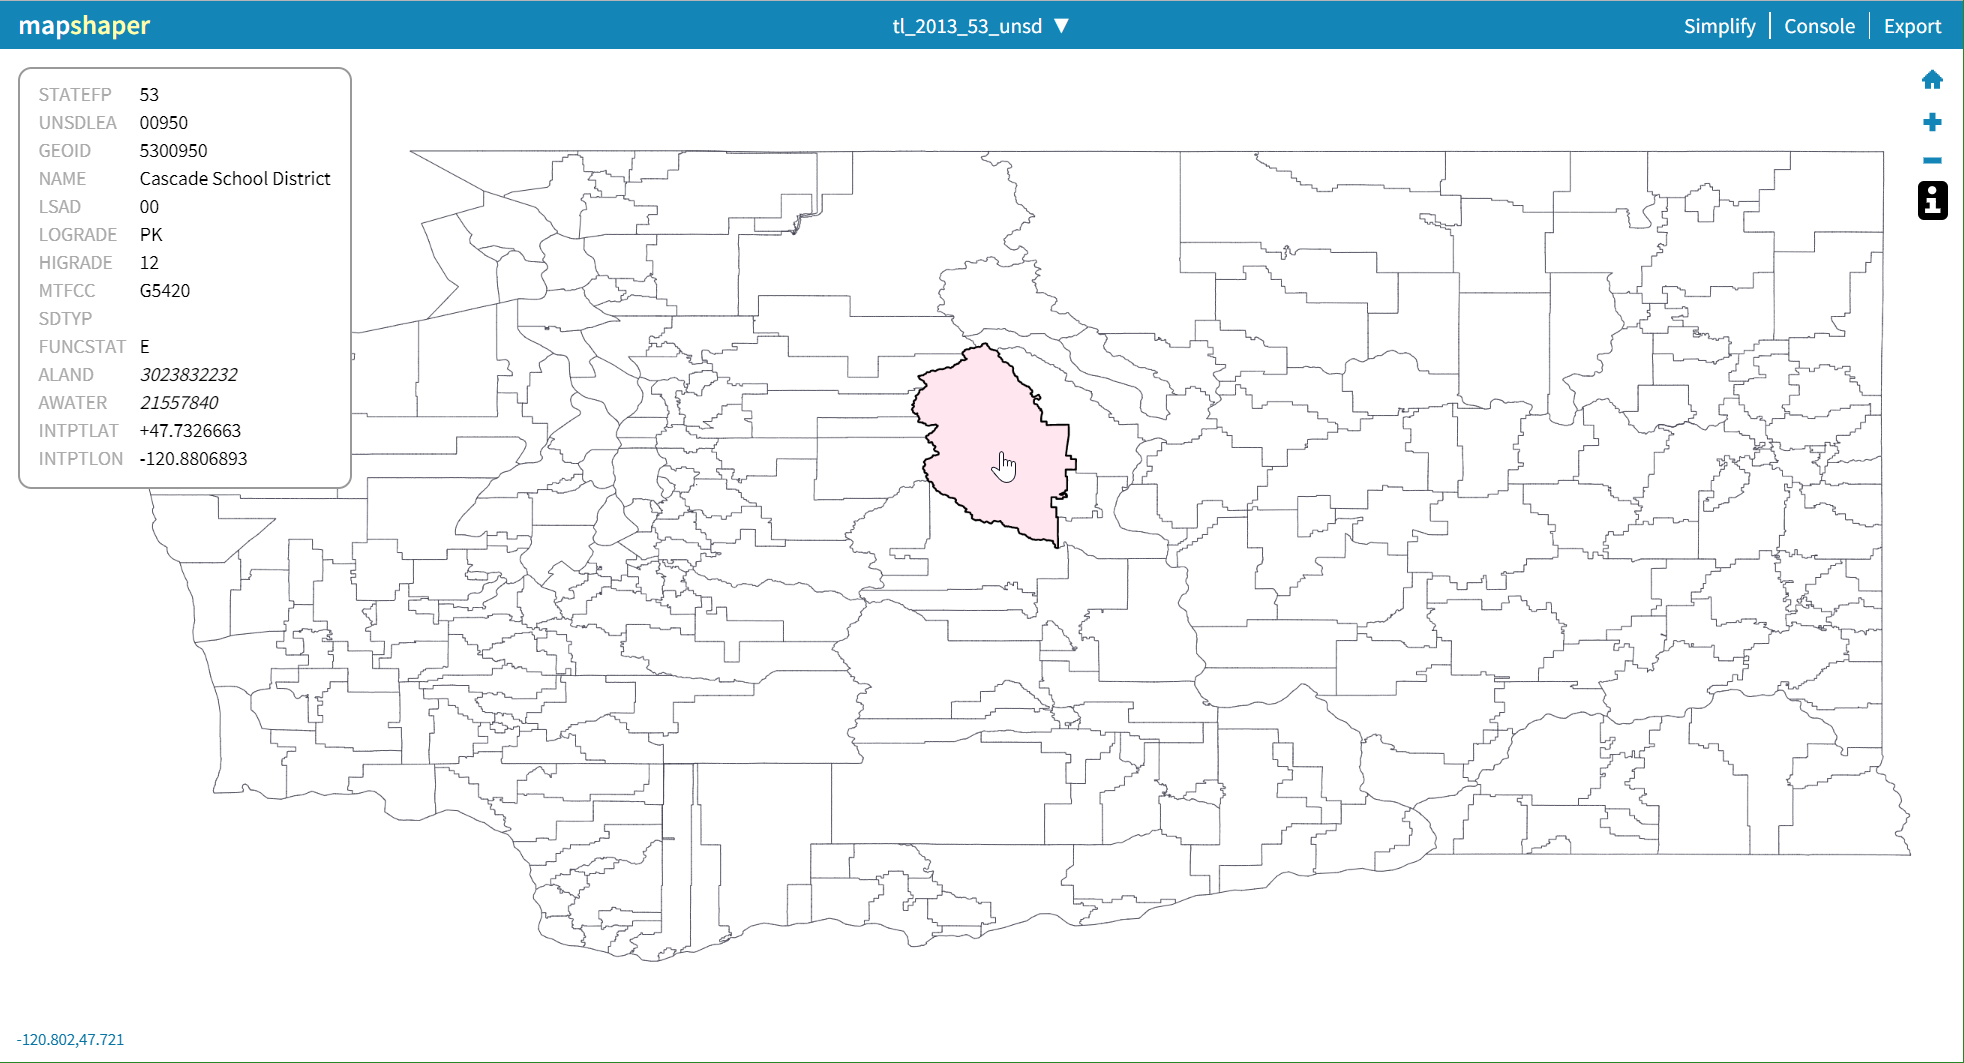
Since not all property names make sense straight away, you may need to click around the map to get a better feel of what's what. Ultimately, it's up to you to determine relative properties.
In our respective example a property named "GEOID" holds the official id of the area, and "NAME" predictably holds the name of the area.
This is important, since we will explicitly need reference those properties by name when exporting the map, as described in the following section of this tutorial.
NOTE Actually, mapshaper will attach an arbitrary id to each area when creating GeoJSON. However, lacking any meaning, it won't be very useful.
Exporting the map
Now that we have all set up and ready, let do the export.
Click the Export link in the top nav bar, then select "GeoJSON" under "File format".
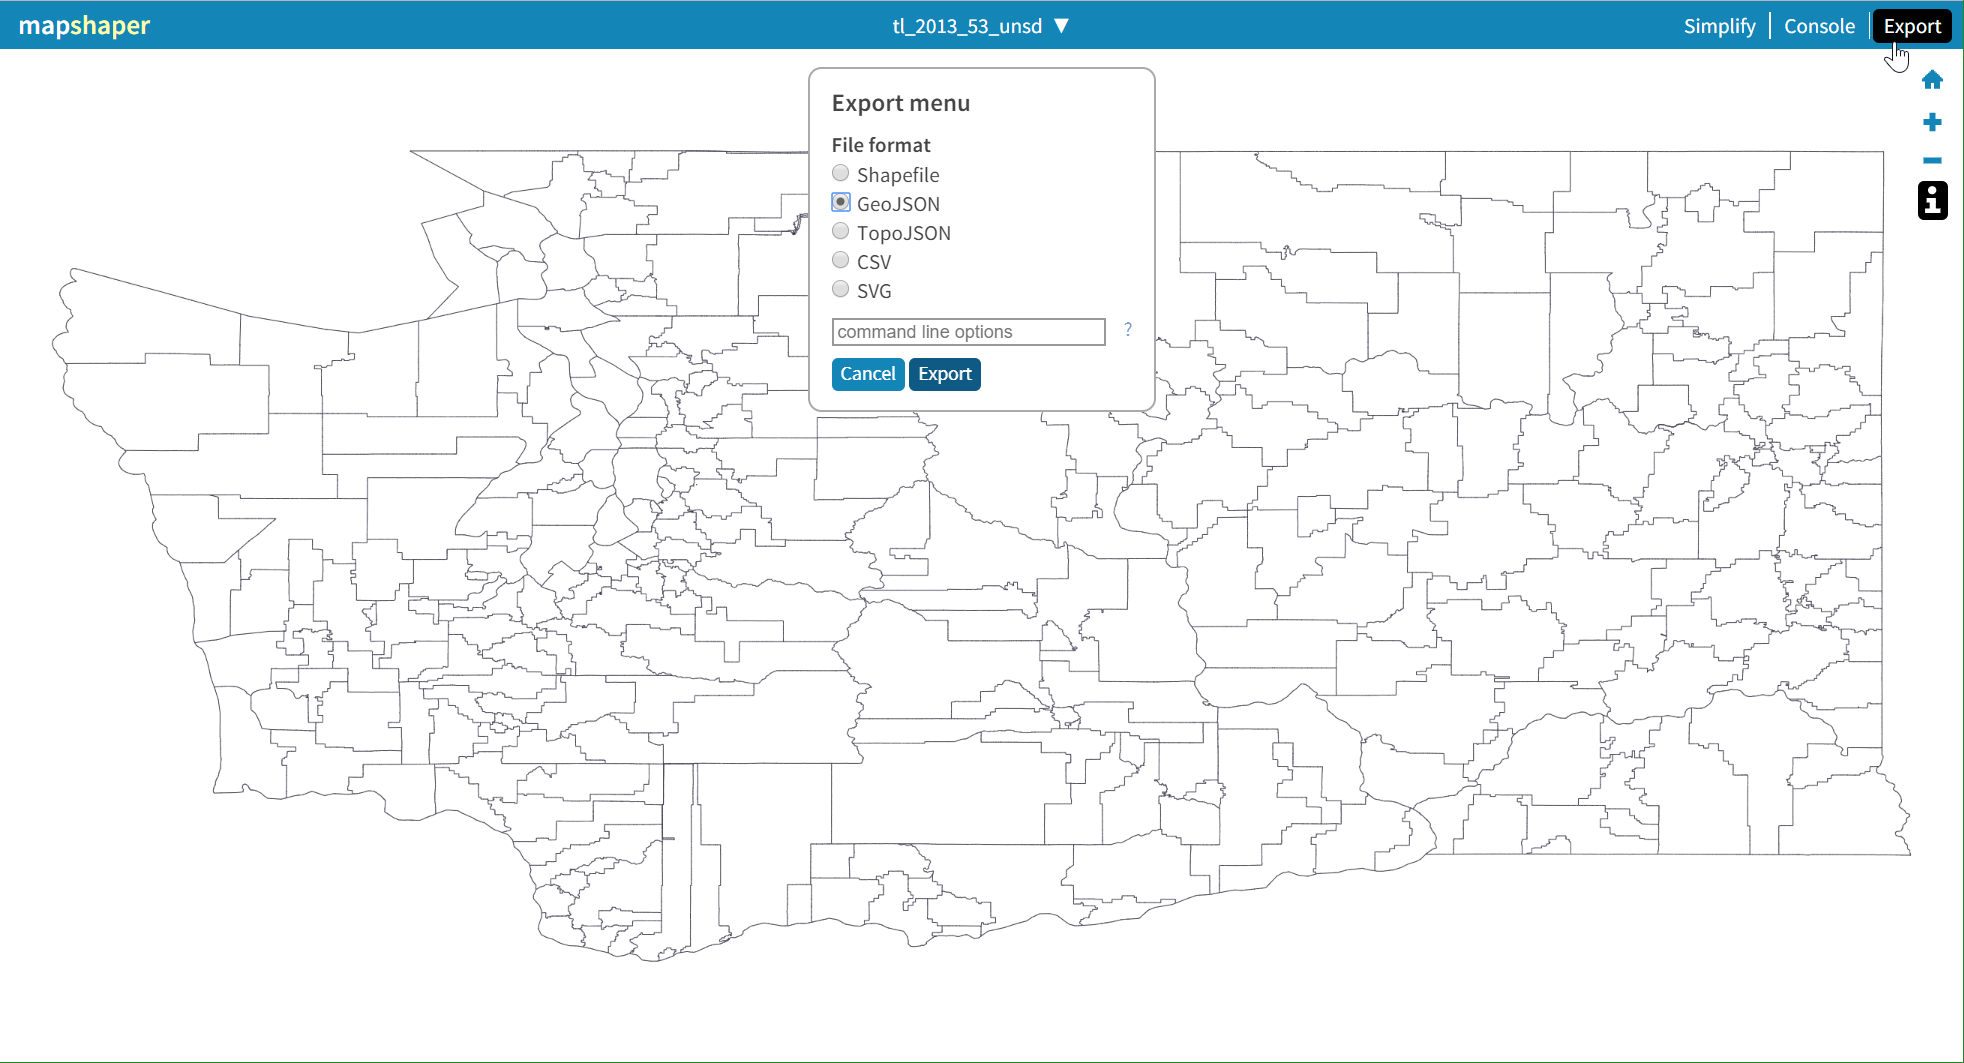
Now, hold your horses, don't click "Export" button just yet.
See a little input field for "command line options"? We'll use it to specify which particular property holds the id of the area, so that it can be hardwired into resulting GeoJSON.
Looking at mapshaper's output options, we can see that this can be done using "id-field" field parameter. Since we already know that in our case the field that contains area id is "GEOID", we'll need to use id-field=GEOID.
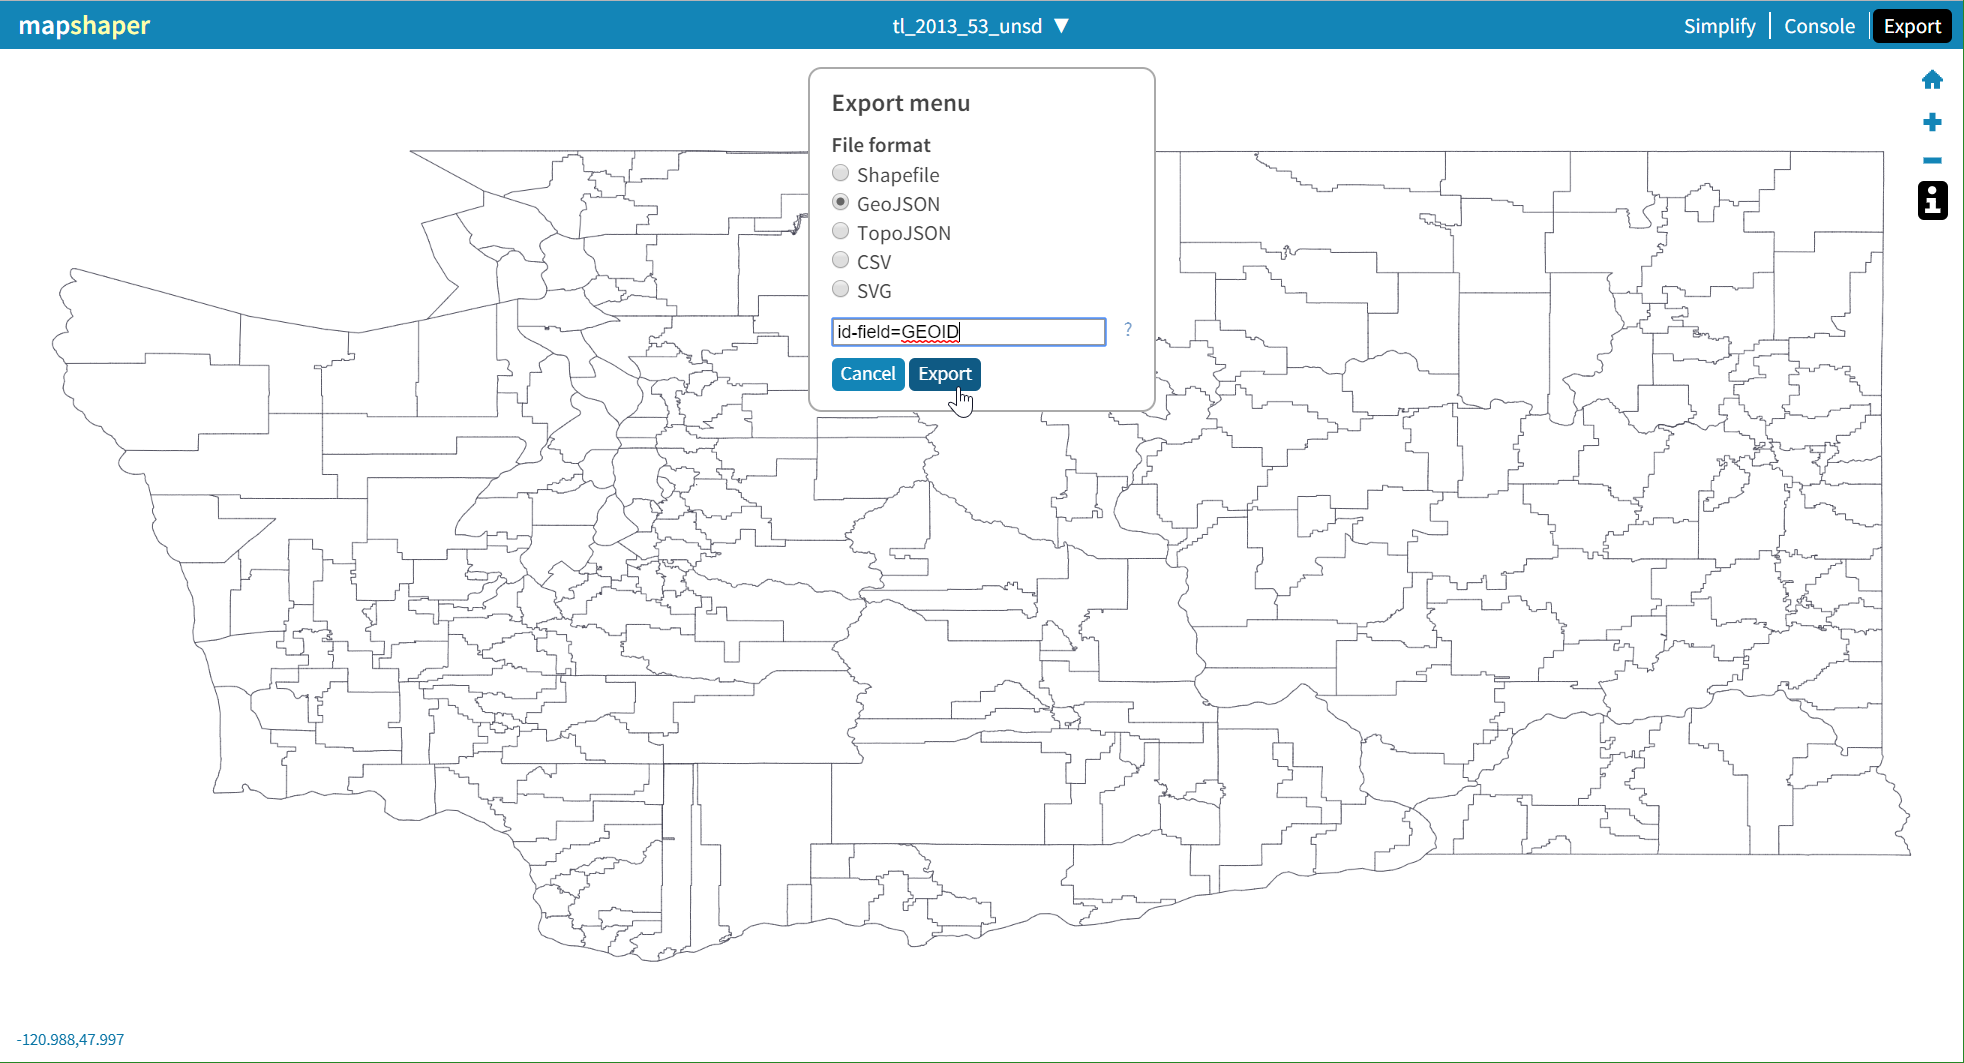
Yes, now you can click "Export".
When you do, you should be offered to download your newly created map file in GeoJSON format.
Examining exported file
Let's take a moment to check the resulting file.
If you open it in some text editor, you'll see each area represented by a JSON object, which looks something like this:
{
  "type": "FeatureCollection",
  "features": [ {
    "type": "Feature",
    "geometry": {
      "type": "Polygon",
      "coordinates": [
        // ...
      ]
    },
    "properties": {
      "STATEFP": "53",
      "UNSDLEA": "00001",
      "GEOID": "5300001",
      "NAME": "Enumclaw School District",
      "LSAD": "00",
      "LOGRADE": "PK",
      "HIGRADE": "12",
      "MTFCC": "G5420",
      "SDTYP": "",
      "FUNCSTAT": "E",
      "ALAND": 1164216256,
      "AWATER": 9744503,
      "INTPTLAT": "+47.2384366",
      "INTPTLON": "-121.6732882"
    },
    "id": "5300001"
  }, ]
}
As you can see, we were successful in hard-wiring our customly-named id field with the proper id of the object.
You'll also notice that all other properties we saw in preview have also carried over to GeoJSON format in form of properties block. This is good, since we will be able to make use of them when configuring our final map.
What you may have missed about exported map, is how large it was. More than 6MB for a web-based map is way way too much! Let's do something about it.
Optimizing the map
There are two ways to reduce the result file size:
- Reducing detail of the map;
- Reducing precision of the coordinates.
The first means reducing fine detail of the area outlines. Since the maps are meant for schematic representation of the areas, we probably do not need the surgical precision of every nook.
Online mapshaper provides a dedicated button for that. It's called "Simplify". Click it.
You'll get a bunch of options which we can ignore for now. Just make sure, "prevent shape removal" is checked. (we don't want anything to be removed, do we?)
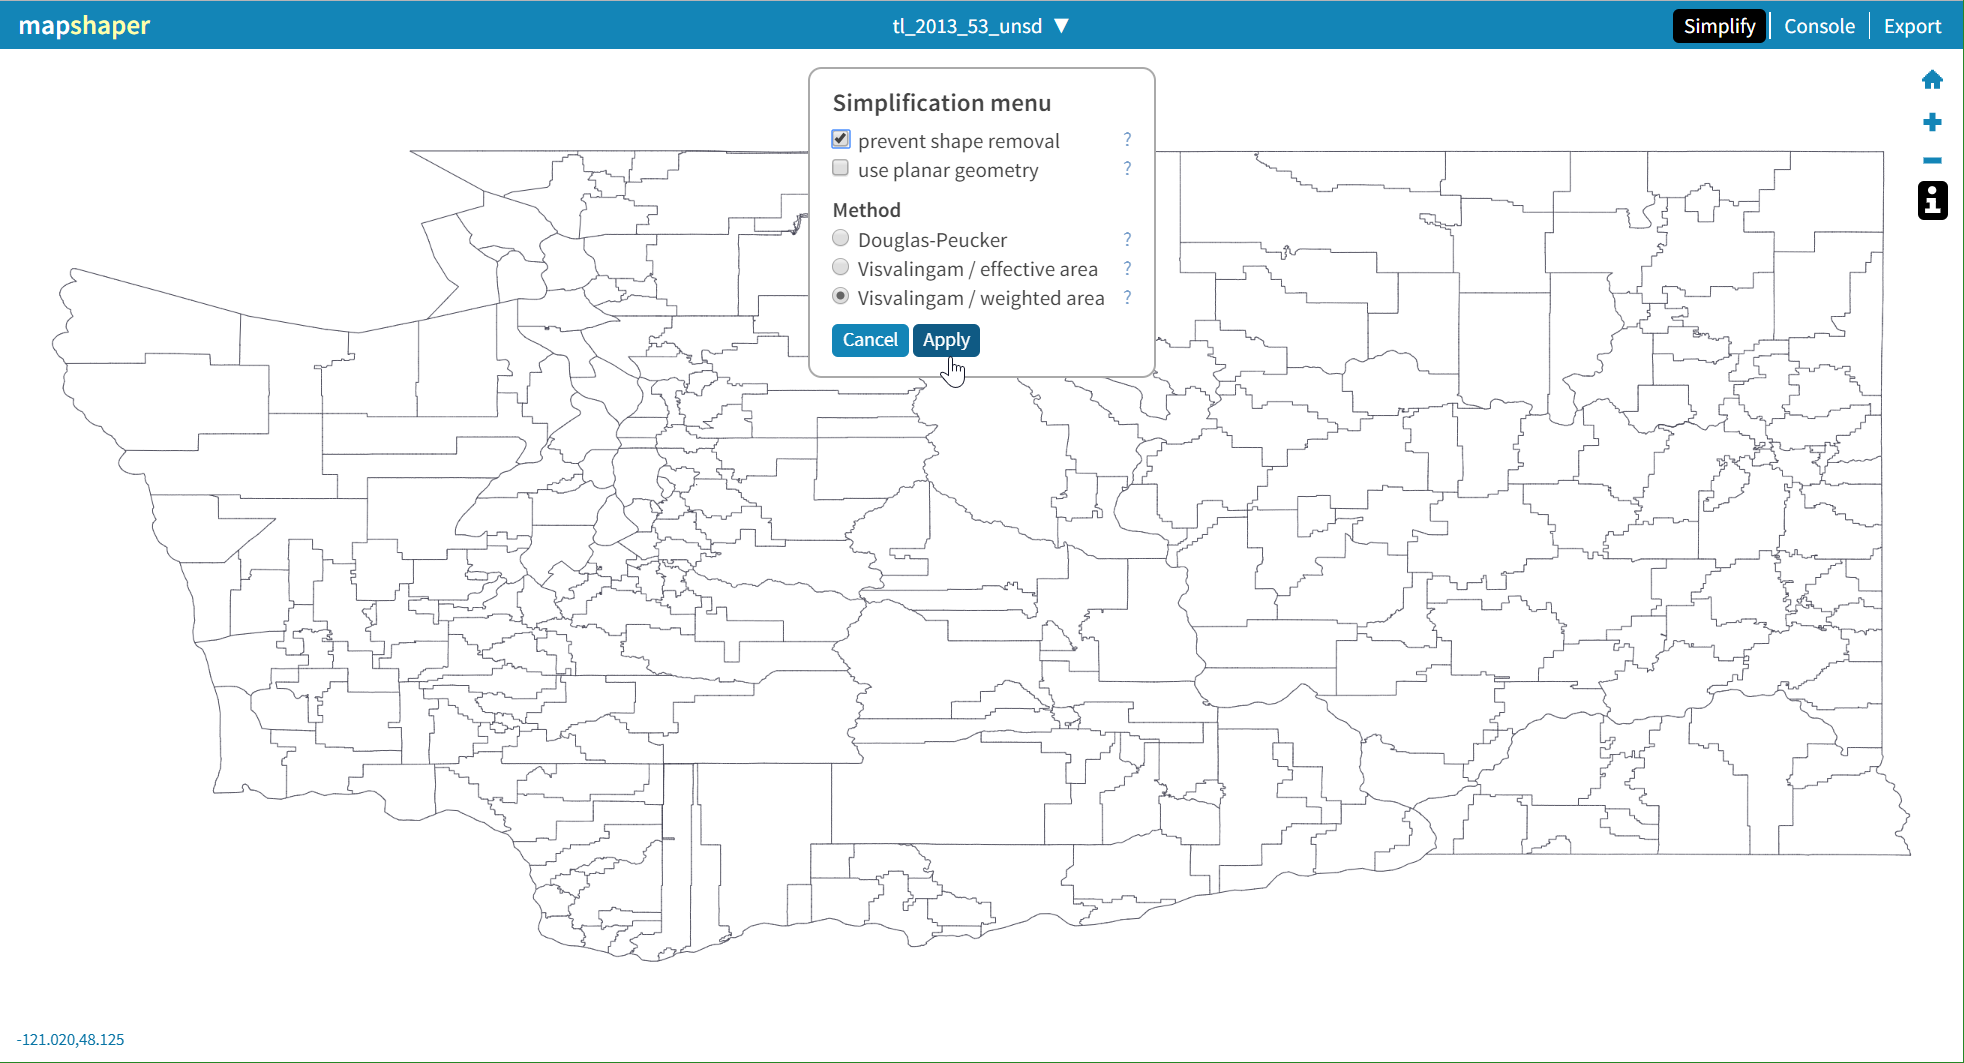
Click "Apply". Nothing will happen, except now we have a nice slider on the top of the window.
The slider is currently at 100%, which means that the map currently has all of its detail, or in other words, it's not simplified.
Once you start dragging the slider, you'll immediately see how reducing the detail affects the actual map.
Choose a setting that is as close to 0% but still offers enough detail that you're comfortable with. For this particular map, 4% looks pretty decent.
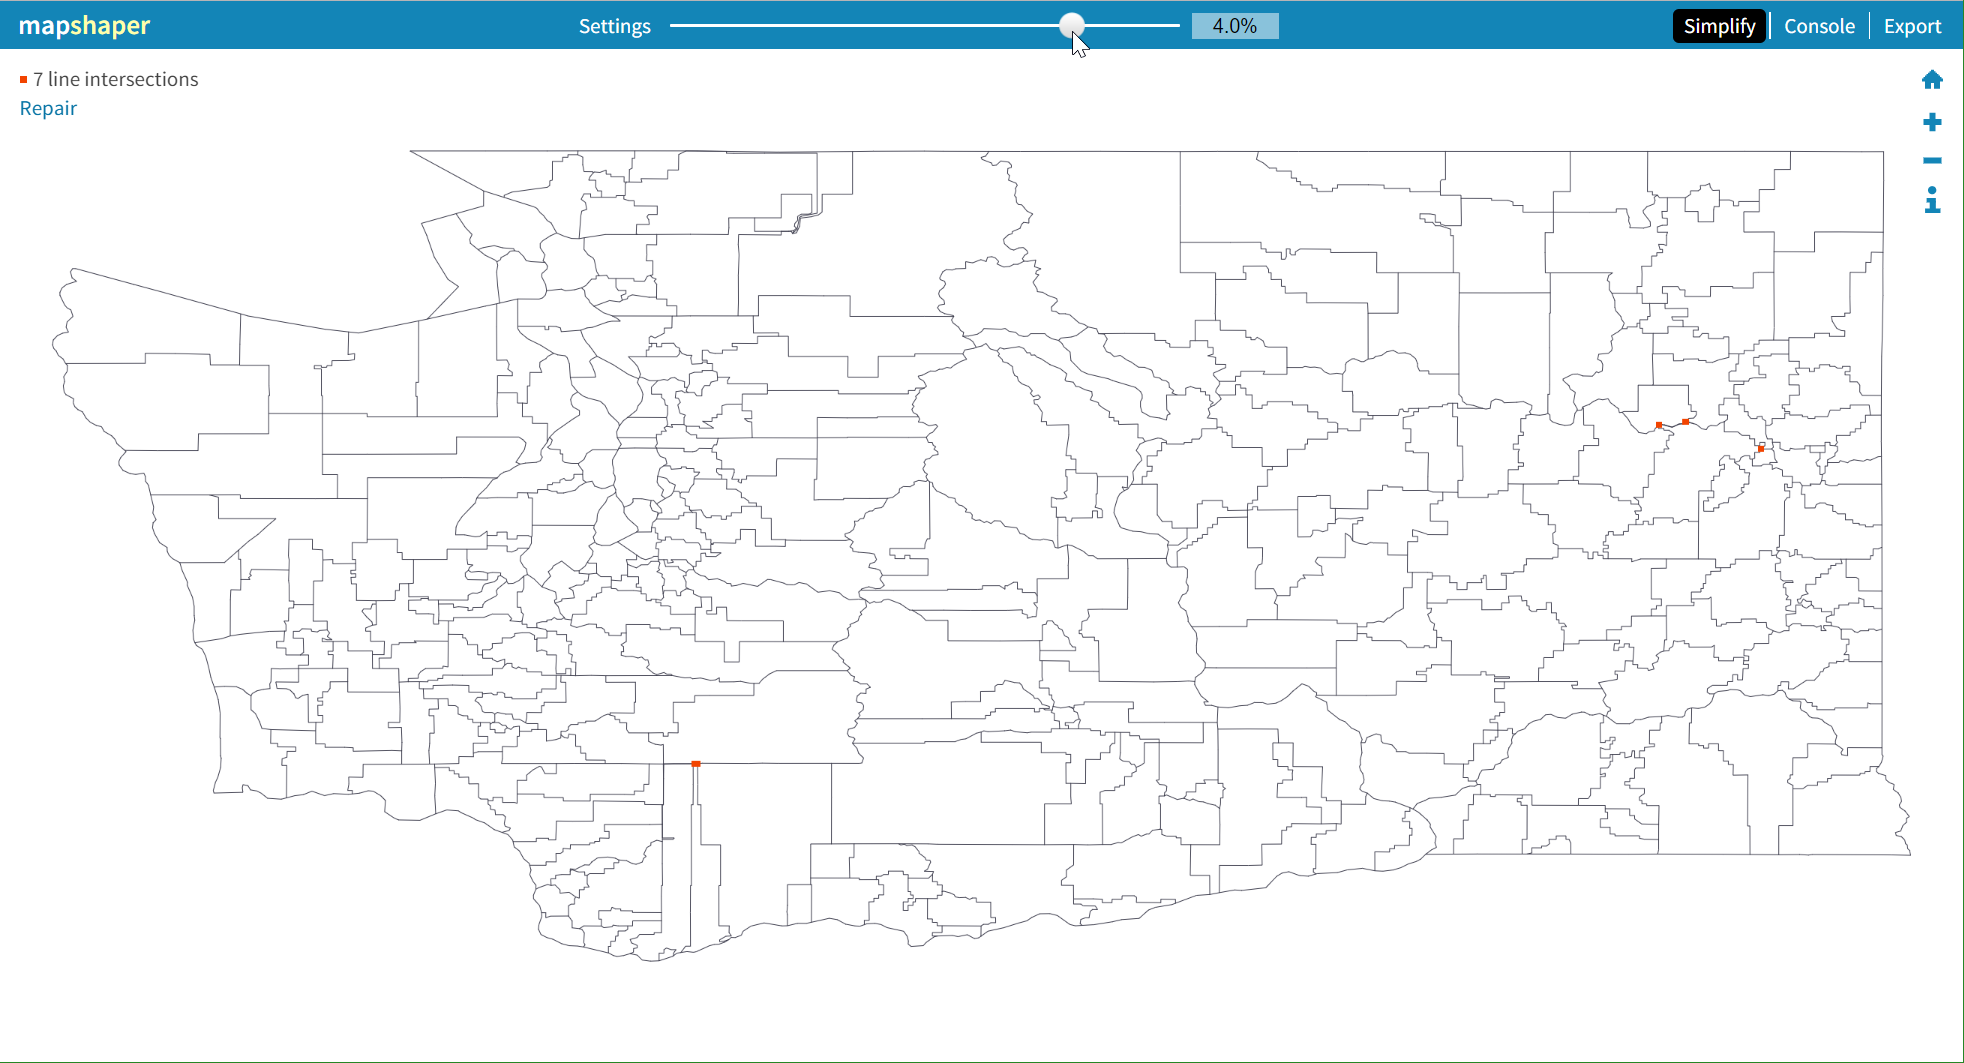
As you may have noticed, mapshaper is now displaying a notice about intersecting lines. When the shape contours are being simplified, some of them may overlap or intersect. It's very nice of mapshaper to also provide means to repair it. Just click the "Repair" link.
Now, if we tried to export our map, we'd see that the resulting file went down to just ~400KB from the previous ~6MB.
Not bad at all!
But not let's stop there, let's apply one more optimization - reducing precision of point coordinates.
GeoJSON format identifies each and every point in the shape using it's latitude and longitude coordinates. Normally, those are very precise down to 15 decimal points!
We don't need such exact precision. A 4 decimal point precision will do.
Since there are lots and lots of points in the map replacing this "[ -122.10171700000001, 47.235561999999994 ]" to this "[ -122.1017, 47.2356]" will save us another bunch of bytes, without having any noticeable impact on appearance.
Turning to mapshaper's output documentation again, we find that we can use parameter precision to specify precision of the resulting coordinates.
Let's update our output parameters line with precision that will round all coordinates to 4 decimal points: precision=0.0001 id-field=GEOID, and run export again.
~300KB. Now this is something I can live with ;)
Using command line
If web user interfaces is not exactly your cup of tea, you can achieve same results with command line version of mapshaper. After all the UI we've been using is just a wrapper.
You'll just need to install mapshaper via npm, then run the following shell command:
mapshaper -i /path/to/waSchools.shp snap -proj wgs84 match=/path/to/waSchools.prj -simplify percentage=0.1 keep-shapes -o waSchools.json precision=0.0001 id-field=GEOID format=geojson
NOTE The actual input files for our test map is different. Please adjust the above accordingly.
Final touches
Map chart in amCharts 4 has a dual way of loading the maps: loading external GeoJSON file or importing it as a module or <script>.
Loading pure geoJSON
If you are using the former, your map is ready. You can instruct your map to load it like this:
chart.geodataSource.url = "/path/to/waSchools.json";
chart.geodataSource.url = "/path/to/waSchools.json";
{
  // ...
  "geodataSource": {
    "url": "/path/to/waSchools.json"
  }
}
Preparing for usage as module or script
If you'd rather go with modules or <script> tag imports, you'll still need to apply some touches to the map file to be able to use it with amCharts 4 Maps more conveniently.
The steps differ depending on which technology you use it with.
TypeScript
If you are using TypeScript, rename the map so it has a .ts extension, then open it up in an editor and apply export default prefix before anything else:
export default {
  // ...
}
Then just import the map like you would normally do.
ES6
For ES6 applications, rename the map so it has a .js extension, then open it up in an editor and apply export default prefix before anything else:
export default {
  // ...
}
Then just import the map like you would normally do.
JavaScript
For plain JavaScript and ES6 applications, rename the JSON file so it has .js extension, then open it up in editor.
Prefix the contents with a code that initializes assigns our resulting GeoJSON into am4geodata_[mapname]. E.g.:
am4geodata_waSchools = {
  // ...
}
Now, you can import your file using <script> tag.
ASSETS Download ready-made files here: waSchools.zip (340K)
Testing the map
Now, that we have our newly-baked map, let's take it for a spin.
If you haven't done so already, we suggest reading our "Anatomy of a Map Chart" article, so you know how to get around amCharts 4 maps. We're not going to get into each configuration detail here.
Let's just come back to the area properties one more time.
Remember how we looked into area properties? We're going to show you how you can use them in our interactive map.
The name property was called "NAME" (all uppercase) in the properties of the map. It carried over just like that into our GeoJSON map.
So, if we'd like to show a school district name as a tooltip on rollover, we'd set series tooltipText to reference to that particular property, e.g "{NAME}".
Same goes for any other property.
Here's how it all turned out:
See the Pen amCharts V4: Map (creating custom map) by amCharts (@amcharts) on CodePen.
Troubleshooting
Map appears garbled
amCharts 4 supports GeoJSON with coordinates of the outer edges of polygons in clock-wise order.
However, some data comes in reverse order. It can make the map appear garbled.
If that is the case with your newly created map, you can try reversing those using reverseGeodata setting:
chart.reverseGeodata = true;
chart.reverseGeodata = true;
{
  // ...
  "reverseGeodata": true
}
NOTE If you are setting your geodata directly on MapPolygonSeries, you need to set reverseGeodata on series, too.