This tutorial will show how we can combine two MapPolygonSeries using different geodata granularity to create outlines for groups of smaller areas.
The task
Let's say we have a county map of Canada.
We would use geodata/regions/canada/canadaCountiesLow map for that.
Easy enough, but we would get a map with all the counties, with no distinction between states whatsoever:
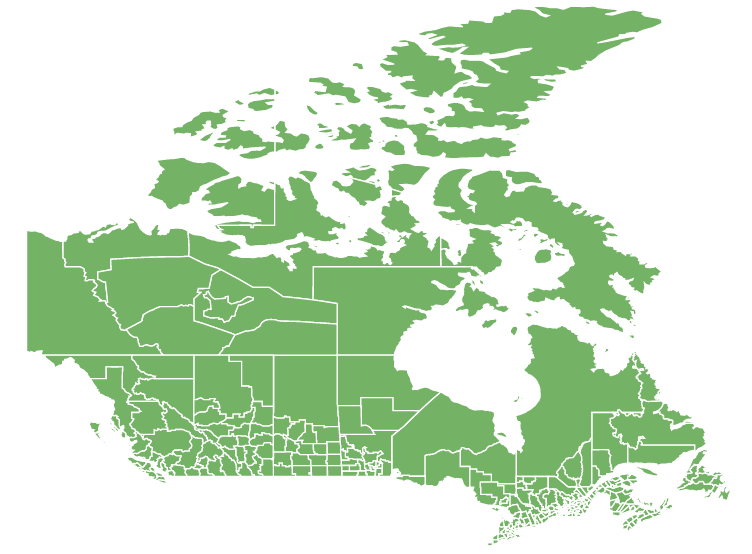
What we have 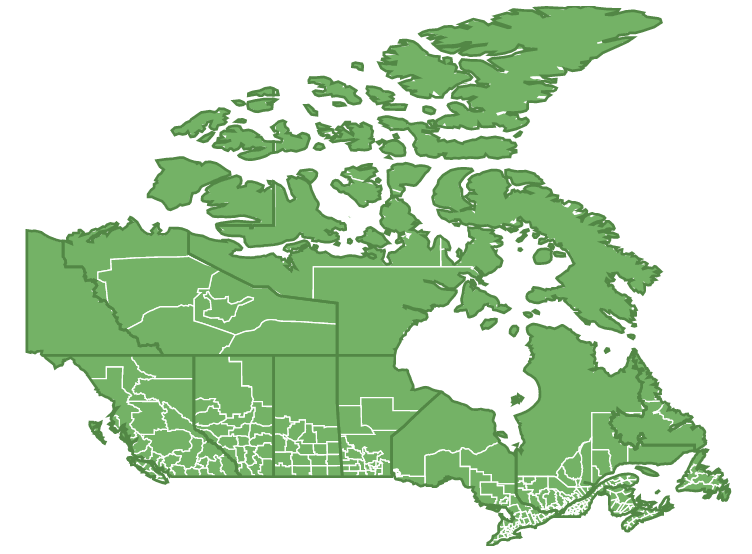
What we want
The solution
Luckily for us, MapChart supports any number of series, so we can mix and match them.
We are going to add another MapPolygonSeries and use a state map of Canada (canadaLow) for it:
// Create county series
let countySeries = chart.series.push(new am4maps.MapPolygonSeries());
countySeries.geodata = am4geodata_region_canada_canadaCountiesLow;

// Create state boundary series
let stateSeries = chart.series.push(new am4maps.MapPolygonSeries());
stateSeries.geodata = am4geodata_canadaLow;
// Create county series
var countySeries = chart.series.push(new am4maps.MapPolygonSeries());
countySeries.geodata = am4geodata_region_canada_canadaCountiesLow;

// Create state boundary series
var stateSeries = chart.series.push(new am4maps.MapPolygonSeries());
stateSeries.geodata = am4geodata_canadaLow;
{
  // ...
  "series": [{
    "type": "MapPolygonSeries",
    "geodata": "region_canada_canadaCountiesLow"
  }, {
    "type": "MapPolygonSeries",
    "geodata": "canadaLow"
  }]
}
What we have so far What we want
We now have a state map of Canada overlaid over county map of Canada.
Still not quite what we wanted, because state polygons are obstructing counties, and their state outlines are not prominent enough.
Let's fix this by:
- Making states fully transparent, but for their outlines.
- Disabling all interactivity on state polygons so that underlying county polygons are fully interactable.
let stateSeries = chart.series.push(new am4maps.MapPolygonSeries());
stateSeries.geodata = am4geodata_canadaLow;
stateSeries.mapPolygons.template.fillOpacity = 0;
stateSeries.mapPolygons.template.strokeWidth = 2;
stateSeries.mapPolygons.template.stroke = am4core.color("#528745");
stateSeries.mapPolygons.template.interactionsEnabled = false;
var stateSeries = chart.series.push(new am4maps.MapPolygonSeries());
stateSeries.geodata = am4geodata_canadaLow;
stateSeries.mapPolygons.template.fillOpacity = 0;
stateSeries.mapPolygons.template.strokeWidth = 2;
stateSeries.mapPolygons.template.stroke = am4core.color("#528745");
stateSeries.mapPolygons.template.interactionsEnabled = false;
{
  // ...
  "series": [{
    "type": "MapPolygonSeries",
    "geodata": "region_canada_canadaCountiesLow"
  }, {
    "type": "MapPolygonSeries",
    "geodata": "canadaLow",
    "mapPolygons": {
      "fillOpacity": 0,
      "strokeWidth" : 2,
      "stroke": "#528745",
      "interactionsEnabled" false
    }
  }]
}
That's it!
Example
See the Pen Combining maps of Canada and Canada counties to create state outlines by amCharts team (@amcharts) on CodePen.