This tutorial is for amCharts 4. If you're looking for amCharts 5 info, use this link.
Axis ranges is a good way to highlight specific places or stretches along an axis. This tutorial will show how we can create code to automatically create axis ranges to highlight weekends on a DateAxis.
The task
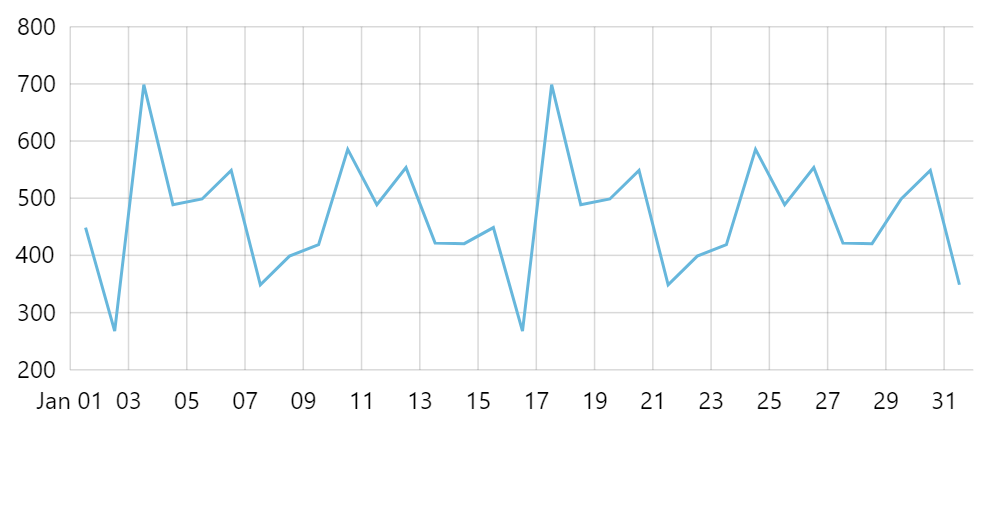
Say, we have a chart that shows line series along a date-based axis.
To make our user understand data better, we want to highlight weekends in it.
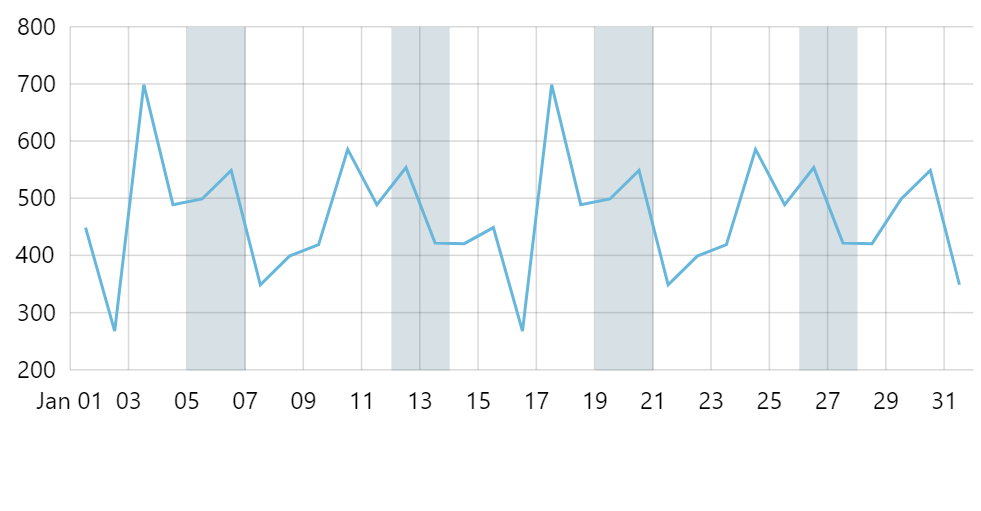
Adding weekend ranges
We could go ahead and create a separate axis range for each weekend directly in code, e.g.:
let range = axis.axisRanges.create();
range.date = new Date(2019, 0, 5);
range.endDate = new Date(2019, 0, 7);
range.axisFill.fill = am4core.color("#396478");
range.axisFill.fillOpacity = 0.2;
range.grid.strokeOpacity = 0;
var range = axis.axisRanges.create();
range.date = new Date(2019, 0, 5);
range.endDate = new Date(2019, 0, 7);
range.axisFill.fill = am4core.color("#396478");
range.axisFill.fillOpacity = 0.2;
range.grid.strokeOpacity = 0;
{
  // ...
  "xAxes": [{
    // ...
    "axisRanges": [{
      "date": new Date(2019, 0, 5),
      "endDate": new Date(2019, 0, 7),
      "axisFull": {
        "fill": "396478",
        "fillOpacity": 0.2
      },
      "grid": {
        "strokeOpacity": 0
      }
    }]
  }]
}
However, that raises obvious problems: we would need to repeat the code for each weekend, as well as remember to update it every time our data range changes, etc.
Let's create a code that checks the actual range of the axis dates, then creates axis ranges for each weekend in that range.
dateAxis.events.on("datavalidated", function(ev) {
  let axis = ev.target;
  let  start = axis.positionToDate(0);
  let end = axis.positionToDate(1);

  // Get weekends
  var current = new Date(start);
  while (current < end) {
    // Get weekend start and end dates
    let weekendStart = getWeekend(current);
    let weekendEnd = new Date(weekendStart);
    weekendEnd.setDate(weekendEnd.getDate() + 2);

    // Create a range
    let range = axis.axisRanges.create();
    range.date = weekendStart;
    range.endDate = weekendEnd;
    range.axisFill.fill = am4core.color("#396478");
    range.axisFill.fillOpacity = 0.2;
    range.grid.strokeOpacity = 0;

    // Iterate
    current.setDate(current.getDate() + 7);
  }

  function getWeekend(date) {
    let lastday = date.getDate() - (date.getDay() || 7) + 6;
    let lastdate = new Date(date);
    lastdate.setDate(lastday);
    return lastdate;
  }
});
dateAxis.events.on("datavalidated", function(ev) {
  var axis = ev.target;
  var start = axis.positionToDate(0);
  var end = axis.positionToDate(1);

  // Get weekends
  var current = new Date(start);
  while (current < end) {
    // Get weekend start and end dates
    var weekendStart = getWeekend(current);
    var weekendEnd = new Date(weekendStart);
    weekendEnd.setDate(weekendEnd.getDate() + 2);

    // Create a range
    var range = axis.axisRanges.create();
    range.date = weekendStart;
    range.endDate = weekendEnd;
    range.axisFill.fill = am4core.color("#396478");
    range.axisFill.fillOpacity = 0.2;
    range.grid.strokeOpacity = 0;

    // Iterate
    current.setDate(current.getDate() + 7);
  }

  function getWeekend(date) {
    var lastday = date.getDate() - (date.getDay() || 7) + 6;
    var lastdate = new Date(date);
    lastdate.setDate(lastday);
    return lastdate;
  }
});
{
  // ...
  "xAxes": [{
    // ...
    "events": {
      "datavalidated":  function(ev) {
        var axis = ev.target;
        var start = axis.positionToDate(0);
        var end = axis.positionToDate(1);

        // Get weekends
        var current = new Date(start);
        while (current < end) {
          // Get weekend start and end dates
          var weekendStart = getWeekend(current);
          var weekendEnd = new Date(weekendStart);
          weekendEnd.setDate(weekendEnd.getDate() + 2);

          // Create a range
          var range = axis.axisRanges.create();
          range.date = weekendStart;
          range.endDate = weekendEnd;
          range.axisFill.fill = am4core.color("#396478");
          range.axisFill.fillOpacity = 0.2;
          range.grid.strokeOpacity = 0;

          // Iterate
          current.setDate(current.getDate() + 7);
        }

        function getWeekend(date) {
          var lastday = date.getDate() - (date.getDay() || 7) + 6;
          var lastdate = new Date(date);
          lastdate.setDate(lastday);
          return lastdate;
        }
      })
    }
  }]
}
A couple of things to note:
- We are using axis'
datavalidatedevent to start populating with axis ranges because we need to know actual date range, so we need all data to be processed before proceeding. - The ranges on
DateAxistake time into account, this is why we are adding 2 days to the calculated timestamp of the Saturday, so that range ends on zero hours Monday.
Example
See the Pen amCharts 4: Using axis ranges to highlight weekends by amCharts team (@amcharts) on CodePen.