Axes of various types follow their own logic when they choose where to place its grid and labels. However, sometimes you need to place those labels at precisely value X, or on date Y. That's where axis ranges might come in handy, which is the focus of this tutorial.
Prerequisites
Just to refresh your memory - axis ranges is a way to highlight specific point or a range on an axis, together with custom label, fill, and grid line.
MORE INFO For more information make sure you check out our dedicated "Axis ranges" article.
Base chart
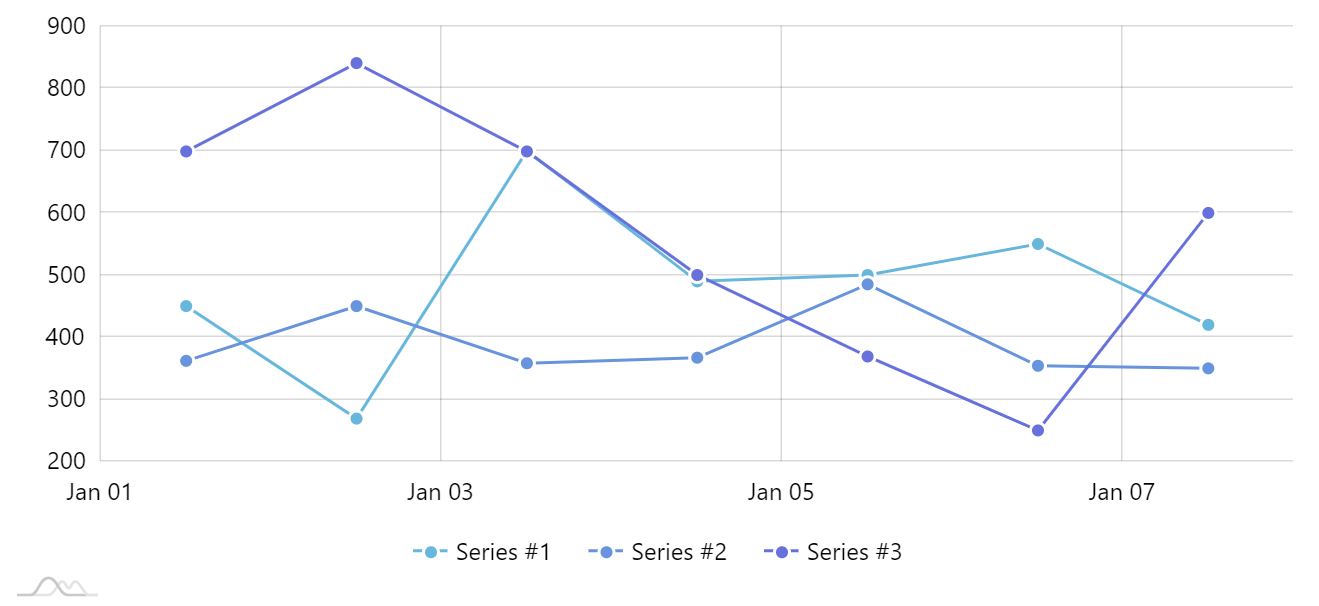
Let's start with a very regular XYChart with ValueAxis as its Y-axis, DateAxis on its X-axis.
Disabling default labels and grid
If we're going to be placing labels using our own logic, we probably don't need build-in labels getting in the way.
Let's disable them:
axis.renderer.grid.template.disabled = true;
axis.renderer.labels.template.disabled = true;
axis.renderer.grid.template.disabled = true;
axis.renderer.labels.template.disabled = true;
{
  // ...
  "xAxes": [{
    // ...
    "renderer": {
      // ...
      "grid": {
        "disabled": true
      },
      "labels": {
        "disabled": true
      }
    }
  }],
  "yAxes": [{
    // ...
    "renderer": {
      // ...
      "grid": {
        "disabled": true
      },
      "labels": {
        "disabled": true
      }
    }
  }]
}
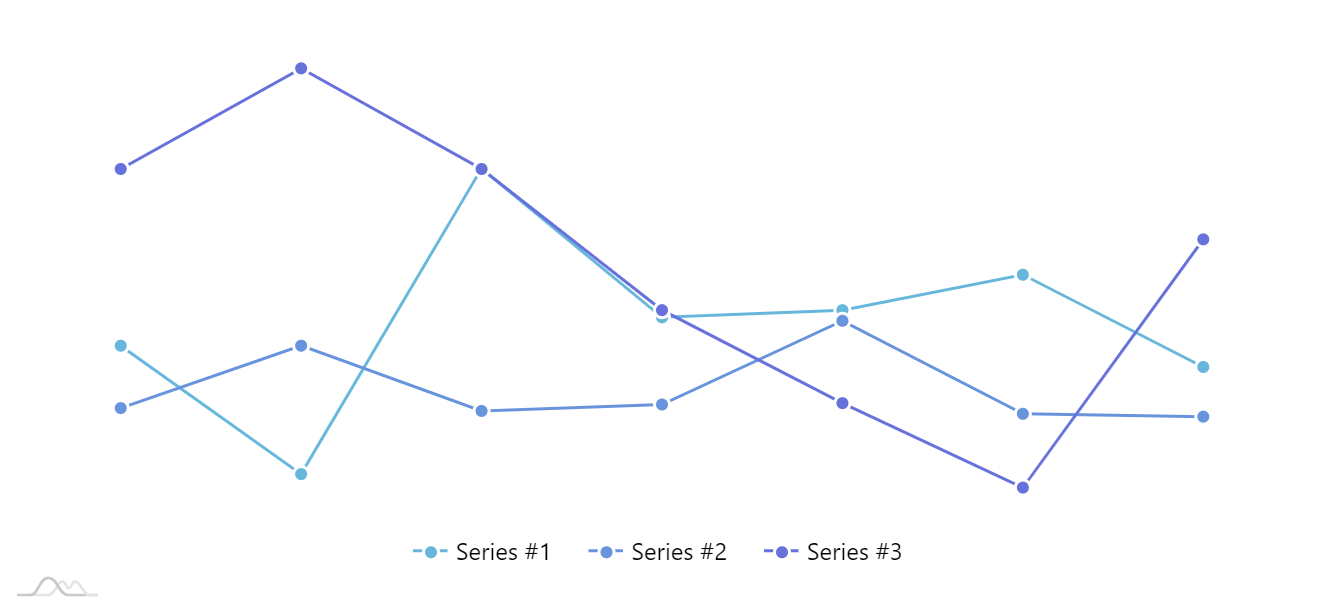
If we do these for both axes, we end up with a perfectly "naked" chart.
Adding custom grid and labels
Now that we've demolished all grid and labels, we can start rebuilding it the way we see fit.
ValueAxis
Let's start with the ValueAxis.
Say we want to have a fixed grid with labels at precisely 0, 500, and 1000.
First of all we'll need to ensure that our axis scale starts at 0 and ends and 1000.
For that we'll use ValueAxis' min and max properties.
valueAxis.min = 0;
valueAxis.max = 1000;
valueAxis.min = 0;
valueAxis.max = 1000;
{
  // ...
  "yAxes": [{
    // ...
    "min": 0,
    "max": 1000
  }]
}
Next up, we'll add grid and labels at 0, 500, and 1000 values.
let range0 = valueAxis.axisRanges.create();
range0.value = 0;
range0.label.text = "0";

let range500 = valueAxis.axisRanges.create();
range500.value = 500;
range500.label.text = "500";

let range1000 = valueAxis.axisRanges.create();
range1000.value = 1000;
range1000.label.text = "1000";
var range0 = valueAxis.axisRanges.create();
range0.value = 0;
range0.label.text = "0";

var range500 = valueAxis.axisRanges.create();
range500.value = 500;
range500.label.text = "500";

var range1000 = valueAxis.axisRanges.create();
range1000.value = 1000;
range1000.label.text = "1000";
{
  // ...
  "yAxes": [{
    // ...
    "axisRanges": [{
      "value": 0,
      "label": {
        "text": "0"
      }
    }, {
      "value": 500,
      "label": {
        "text": "500"
      }
    }, {
      "value": 1000,
      "label": {
        "text": "1000"
      }
    }]
  }]
}
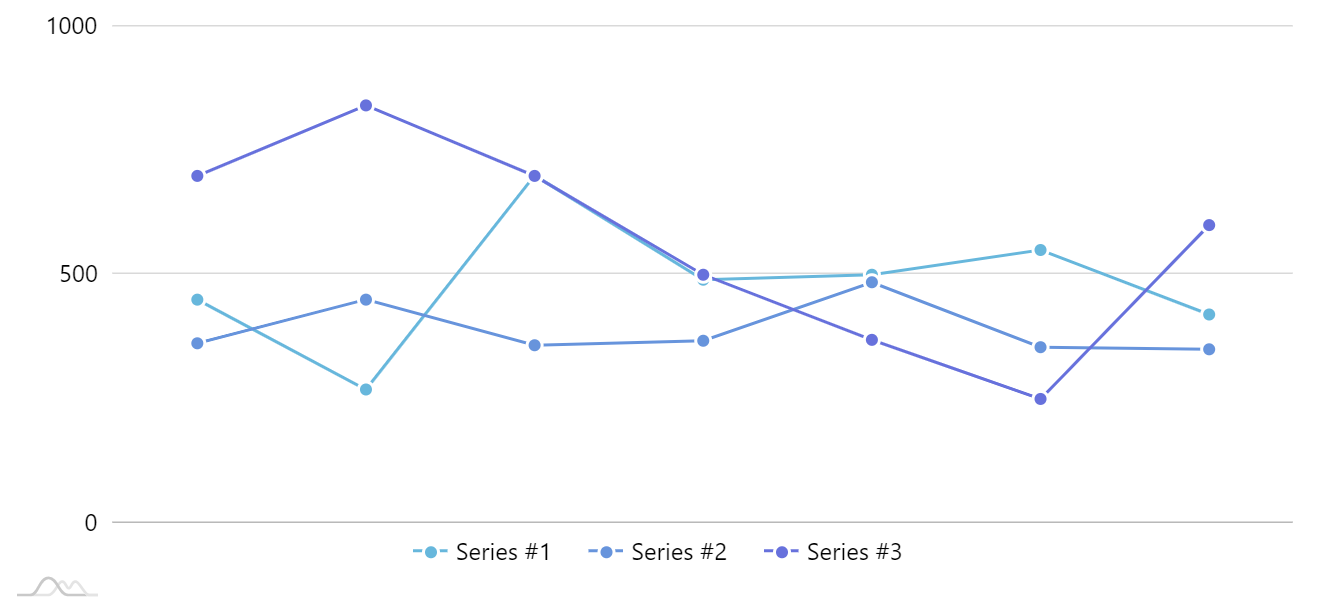
Our chart starts regaining its shape:
DateAxis
Now, let's add some grid and labels to our DateAxis as well.
As, we're not happy with the choices axis made in placement of those labels, we want grid items for just Jan 1 and Jan 8.
This works similarly as for ValueAxis, except instead of value, we'll be setting date properties of the axis ranges.
let range0101 = dateAxis.axisRanges.create();
range0101.date = new Date(2018, 0, 1);
range0101.label.text = "Jan 1st";

let range0108 = dateAxis.axisRanges.create();
range0108.date = new Date(2018, 0, 8);
range0108.label.text = "Jan 8th";
var range0101 = dateAxis.axisRanges.create();
range0101.date = new Date(2018, 0, 1);
range0101.label.text = "Jan 1st";

var range0108 = dateAxis.axisRanges.create();
range0108.date = new Date(2018, 0, 8);
range0108.label.text = "Jan 8th";
{
  // ...
  "xAxes": [{
    // ...
    "axisRanges": [{
      "date": "2018-01-01",
      "label": {
        "text": "Jan 1st"
      }
    }, {
      "date": "2018-01-08",
      "label": {
        "text": "Jan 8th"
      }
    }]
  }]
}
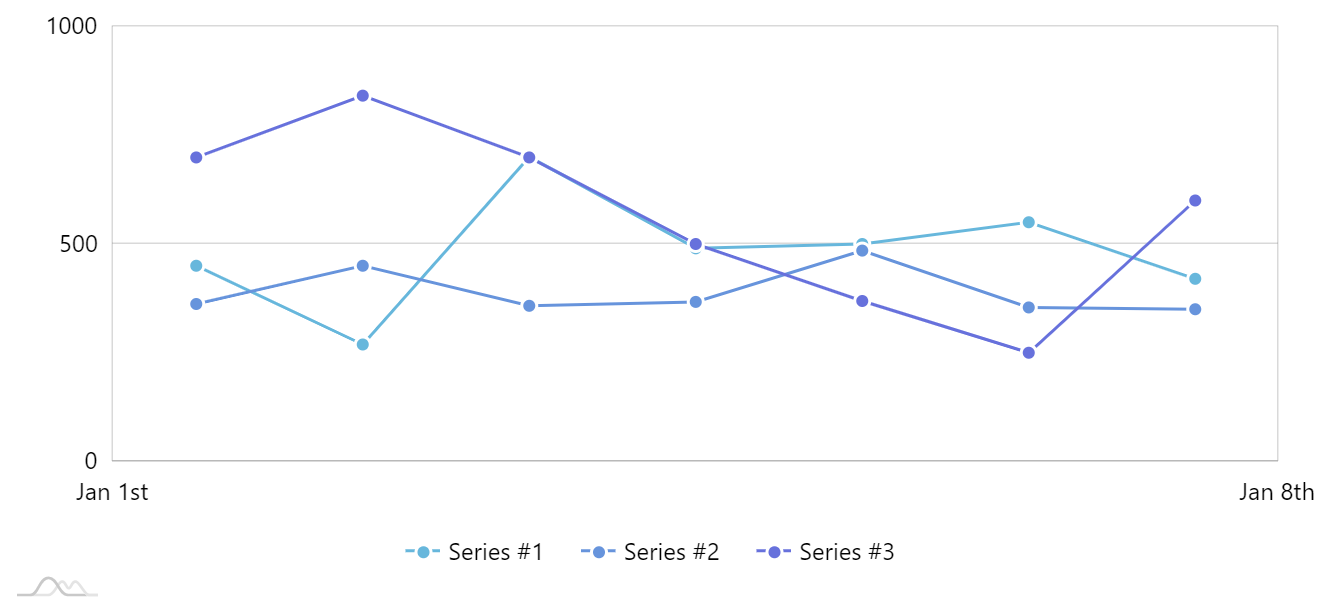
Our job is finished:
Example
See the Pen amCharts 4: Using axis ranges to place labels at arbitrary values or dates by amCharts team (@amcharts) on CodePen.