Line graph
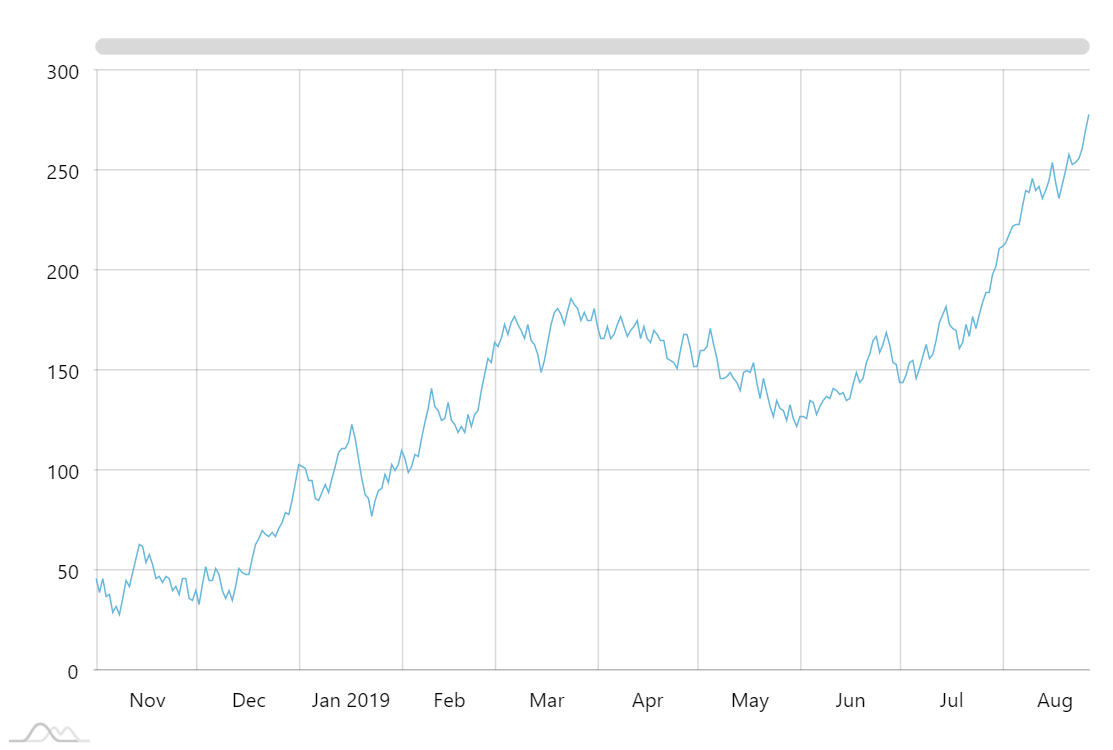
Line graph (also known as Line chart) displays series of data points connected by straight line segments. Line graphs are often used to display time series chronologically with category axis (usually horizontal x-axis) serving as an evenly spaced date-time scale.
Demo source