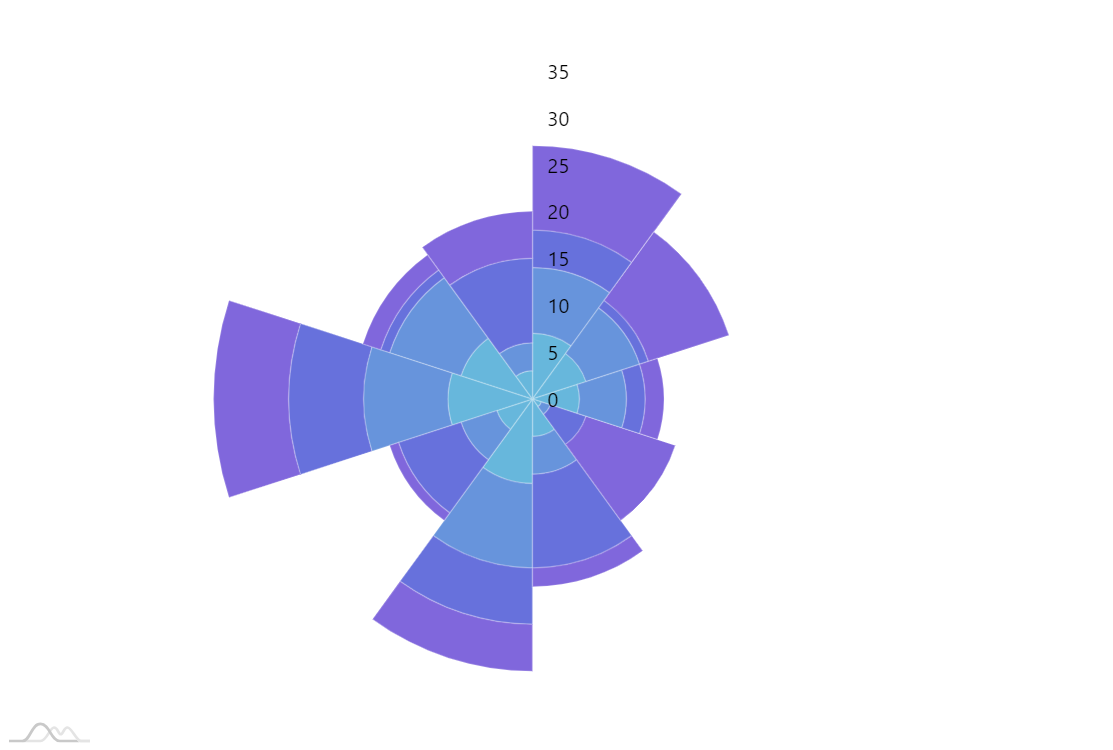
Polar area chart
Polar area chart (also known as Polar area diagram, Coxcomb chart, Rose chart) is often used to plot cyclical data like average monthly temperature, hourly traffic to a website, etc.
One of the most famous early uses of polar area chart is “Diagram of the causes of mortality in the army in the East” by Florence Nightingale.
Demo source