Vertical Line Chart
Any axis in any direction
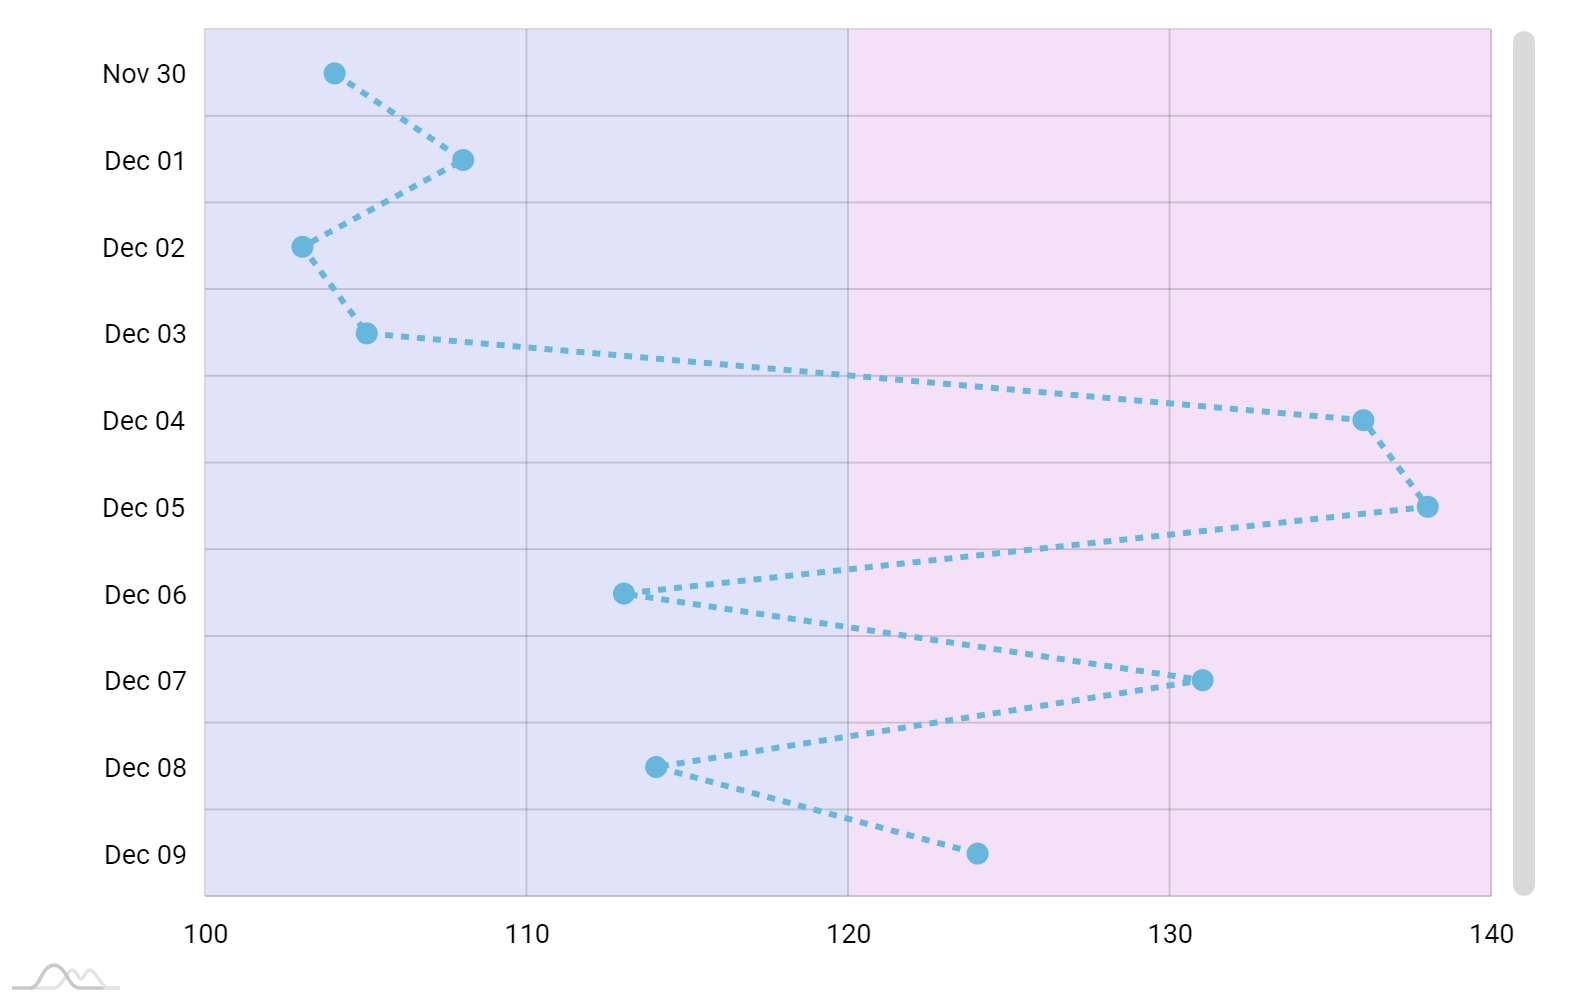
Any axis can go in any direction. So, to have a vertical date-based line chart, we just need to set chart’s xAxis to value axis, and yAxis to date axis.
More about axes on an XY chart
Axis ranges
Any axis can contain vertical bands or guide lines added, with an optional label, to indicate certain ranges or points in the chart.
More about axis ranges and guides
Dashed lines
Making a dashed line is easy: just use its strokeDasharray property.
Vertical zoom
The chart can be made to zoom vertically – both by the scrollbar and cursor.
To make the cursor zoom vertically (instead of horizontally), simply set its behavior to "zoomY".
Demo source