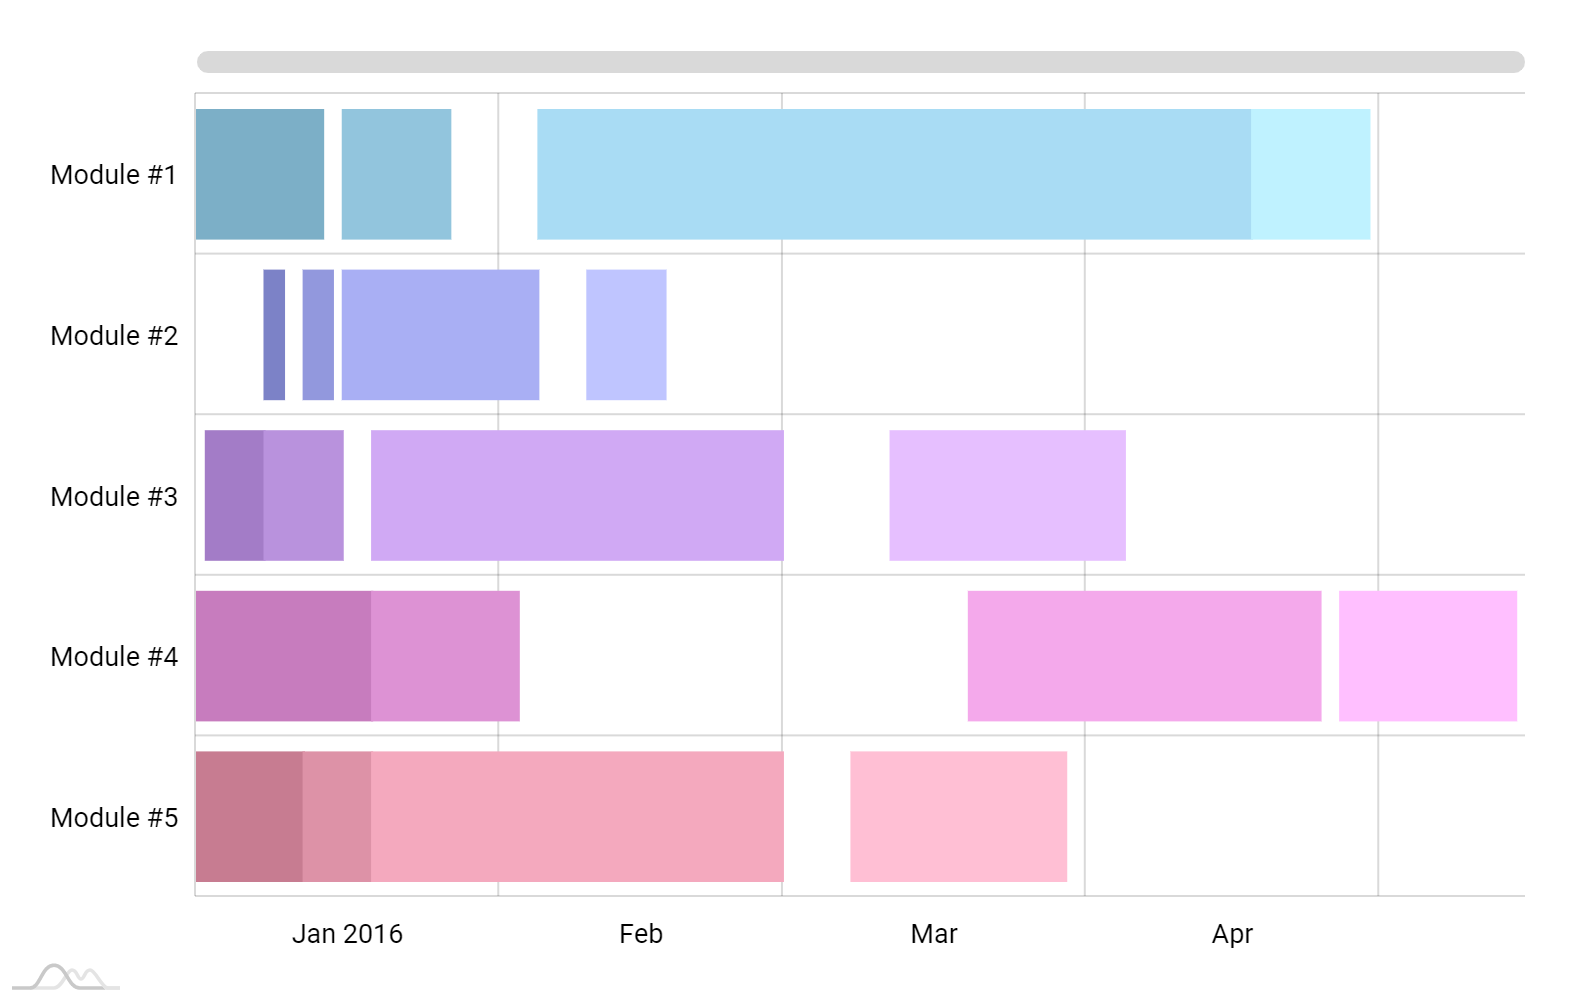
Gantt Chart with dates
Gannt chart is a variation on Bar chart commonly used to visualize project schedule. Each bar represents a task in the schedule with its start and end locations corresponding to the date/time of the item’s beginning and end.
Demo source