Pictorial column chart
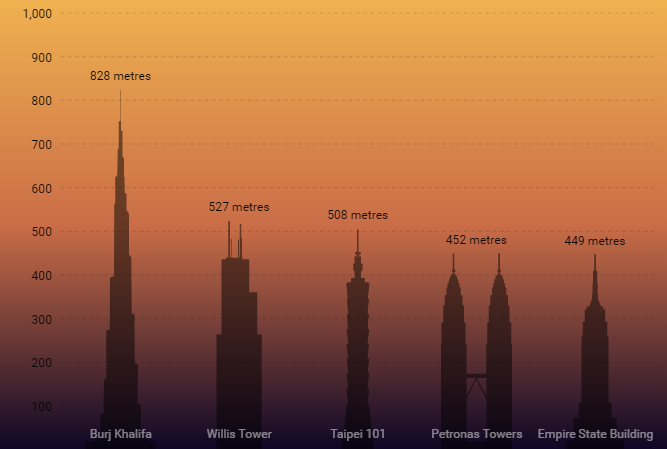
Pictorial Column Chart (also known as Pictorial Bar Chart) is a visually spiced up version of a regular bar chart using images to display bars. It is harder to compare values in a pictorial chart but it could be much easier to identify objects portrayed when their shape has a distinct recognizable meaning (like in this demo).
Demo source