Logarithmic Scale
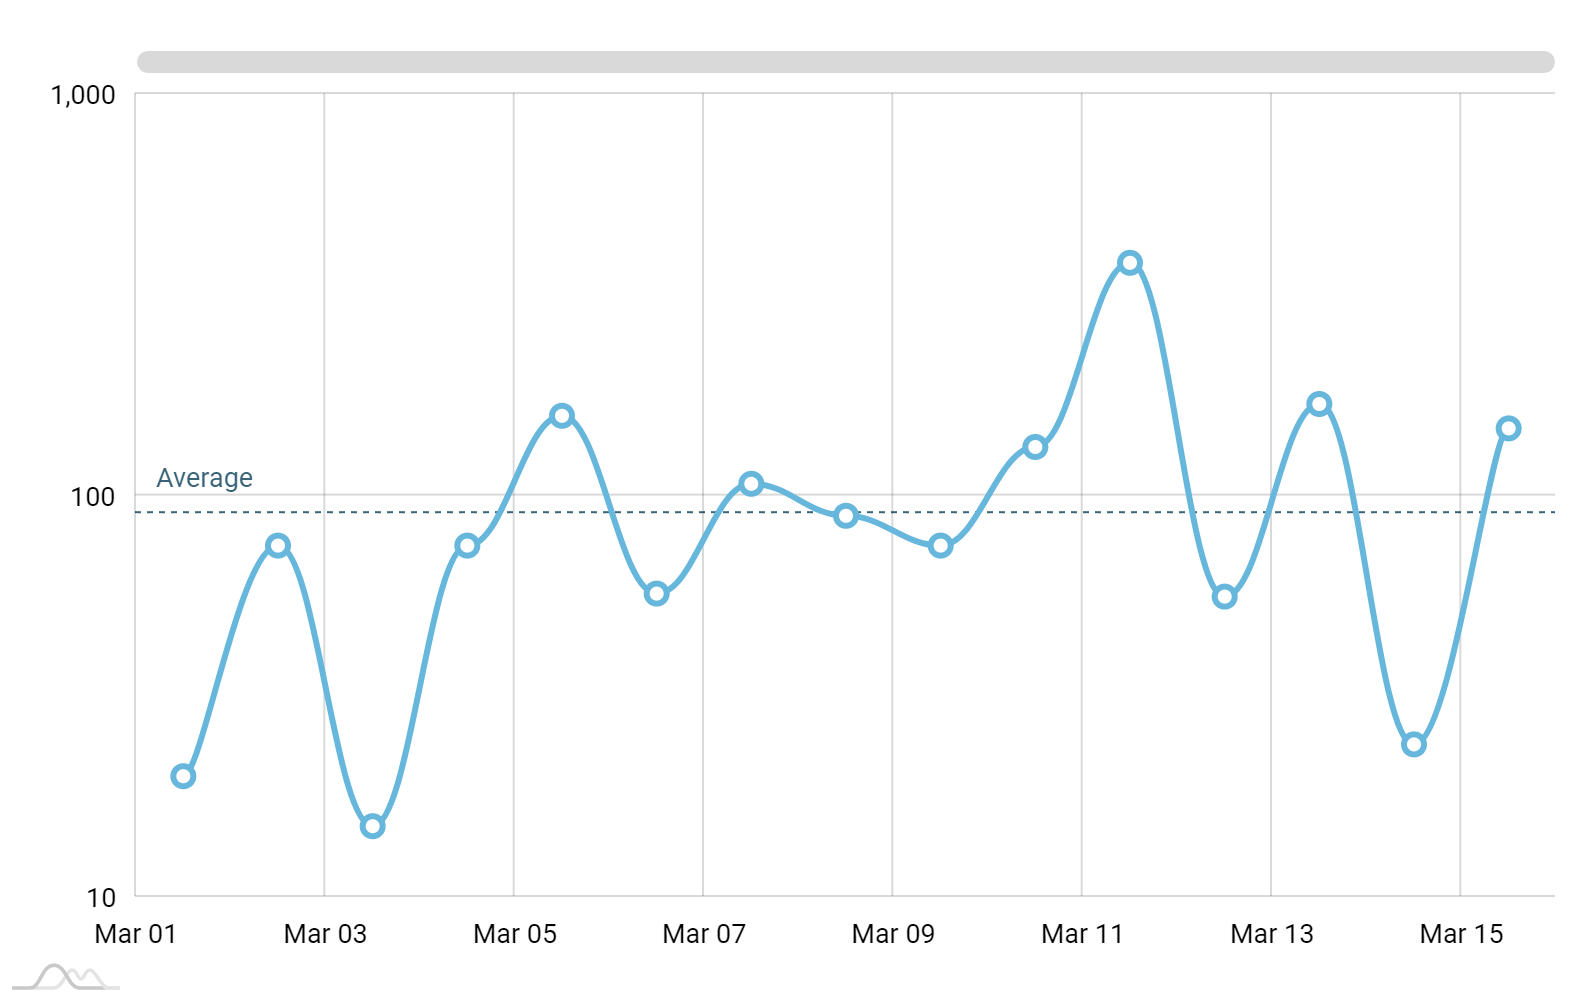
Logarithmic scale
Each value axis can be turned into logarithmic: just set its logarithmic property to true.
Having logarithmic scale allows depicting value dynamics even if the values differ dramatically in scale.
Axis ranges as guides
Axis ranges can display bands or lines with labels, indicating certain value or position across the scale.
More about using ranges as guides
Demo source