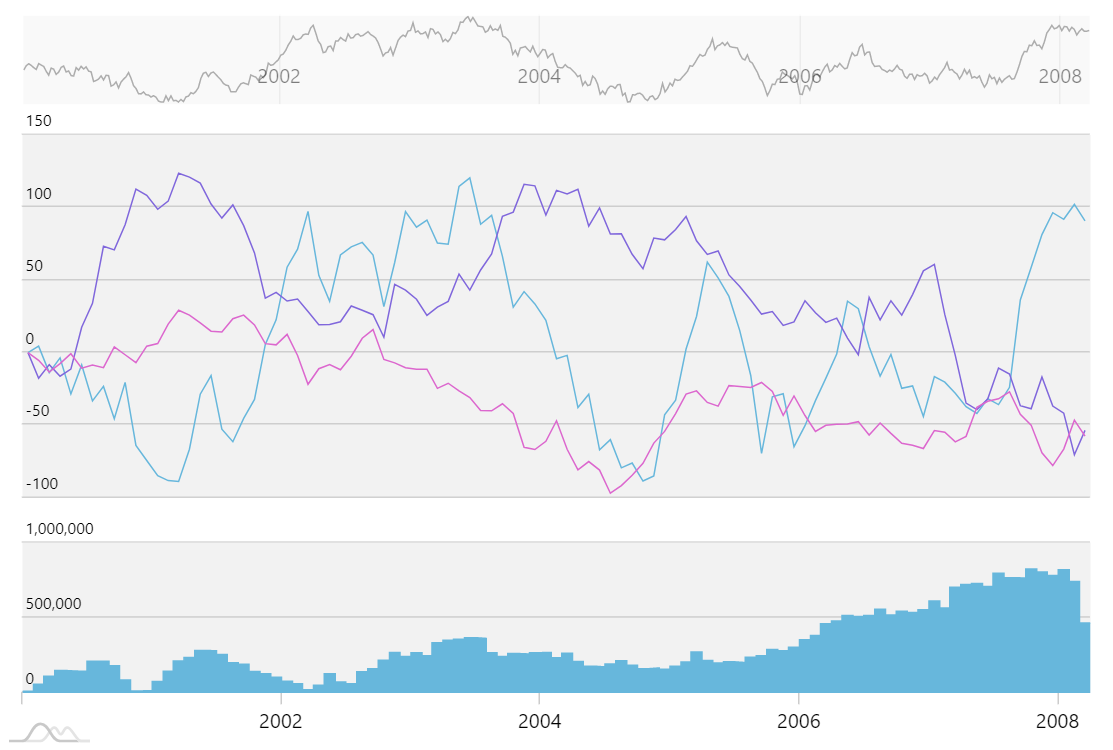
Stock chart comparing prices
This demo shows how you can turn regular XYChart and a few external controls into a full-fledged stock chart, comparing prices of several stock indexes.
It uses amCharts 4 capability to plot data not from absolute values but also from its auto-calculated derivative values, such as in this case change, which is standard way of comparing price change dynamics and performance.
The demo also showcases other essential cool features, like dynamic data item grouping (where granularity of data is adjusted dynamically based on zoom) and stacked axes (which allows creating multi-paneled chart interfaces).
More about plotting from calculated values More about data item grouping More about stacked axes
Demo source