In XYChart we are used to plot series from the values that appear in data. This tutorial will show how we can plot from other auto-calculated values such as percent or change.
Intro
For an XYSeries to work - be it LineSeries, ColumnSeries, or some other type - we need to bind it to data. We do that via "data fields".
For example, if we want to plot a horizontal LineSeries from data which has "value" and "date" keys in its data points, we'll bind series' valueY and dateX data fields:
series.dataFields.dateX = "date";
series.dataFields.valueY = "value";
series.dataFields.dateX = "date";
series.dataFields.valueY = "value";
{
  // ...
  "series": [{
    "type": "LineSeries",
    "dataFields": {
      "valueX": "date",
      "valueY": "value"
    }
  }]
}
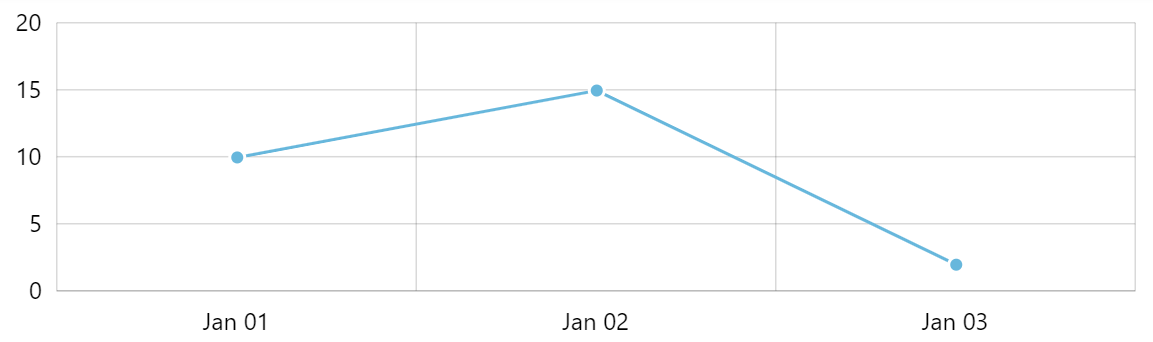
Suppose our data contains three data points with values 10, 15, and 2.
If we run such chart, we'll get a line that is plotted at exactly those values in the scale:
Let's see how we can change that to plot from other values.
Auto-calculated values
Using auto-calculated values
While informative of absolute values, the above chart does not convey the dynamic of changes as strongly as it might.
In some charts, especially ones that show stock data, a derivative "change" values are used to plot the data.
By default, series uses its dataFields like valueY to plot data.
However, each series supports also additional data fields, like valueYShow, which as the name suggest, is a reference to some derivative value to be used instead of the absolute value when plotting the series.
In other words the valueYShow data field means: "use this auto-calculated value instead of absolute values, when plotting chart".
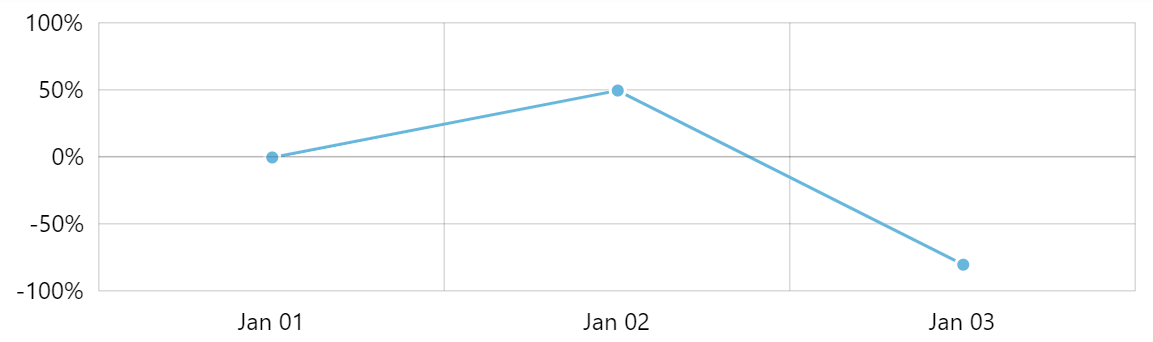
If we want to show percent changes from the initial (first) value, we can use "changePercent":
series.dataFields.dateX = "date";
series.dataFields.valueY = "value";
series.dataFields.valueYShow = "changePercent";
series.dataFields.dateX = "date";
series.dataFields.valueY = "value";
series.dataFields.valueYShow = "changePercent";
{
  // ...
  "series": [{
    "type": "LineSeries",
    "dataFields": {
      "dateX": "date",
      "valueY": "value",
      "valueYShow": "changePercent"
    }
  }]
}
If we ran the chart now, we'd get a chart plotted not bu absolute values, but by their percent change in comparison to the first value in series.
NOTE change and changePercent values are caculated from the first data item in selected range, not absolutely first data item in series. It means that values can change significantly when chart is zoomed.
Alternatively, if we would have used "previousChangePercent", the chart would be plotted showing percent change from previous value.
Available calculated values
Here's a complete list of available options:
| Value | Comment |
|---|---|
"value" | Absolute value. Using this does not make sense since series are plotted by their absolute values by default. |
"percent" | Percent of the value in stack. Calculated only if respective ValueAxis has calculateTotals = true set. |
"change" | Difference between this value and the value of the first data item in series within selected range (view). |
"changePercent" | Difference in percent between this value and the value of the first data item in series within selected range (view). |
"previousChange" | Difference between this value and the value of the previous data item in series |
"previousChangePercent" | Difference in percent between this value and the value of the previous data item in series |
startChange | Difference between this value and the value of the first data item in series. |
startChangePercent | Difference in percent between this value and the value of the first data item in series. |
"sum" | Sum of all values in stack. Calculated only if respective ValueAxis has calculateTotals = true set. |
"average" | Average of all values in stack. Calculated only if respective ValueAxis has calculateTotals = true set. |
"open" | Instructs to plot the series from its "openValueY" or "openValueX" data field. |
"close" | Instructs to plot the series from its "closeValueY" or "closeValueX" data field. |
"low" | Instructs to plot the series from its "lowValueY" or "lowValueX" data field. |
"high" | Instructs to plot the series from its "highValueY" or "highValueX" data field. |
"count" | Count of values in stack. Calculated only if respective ValueAxis has calculateTotals = true set. |
"total" | Sum of absolute values in stack. Calculated only if respective ValueAxis has calculateTotals = true set. |
"totalPercent" | Sum of percents of values in stack. Calculated only if respective ValueAxis has calculateTotals = true set. |
"stack" | A "start" value of the item when used series used in stack. |
Modifying related controls
Since our chart no longer uses absolute values but rather percent, we might need other chart elements to reflect that.
First, since our values are now percent, we need our ValueAxis to show percent symbol next to values. We can do so via an adapter:
valueAxis.renderer.labels.template.adapter.add("text", function(text) {
  return text + "%";
});
valueAxis.renderer.labels.template.adapter.add("text", function(text) {
  return text + "%";
});
{
  // ...
  "yAxes": [{
    "type": "ValueAxis",
    // ...
    "renderer": {
      "labels": {
        "adapter": {
          "text": function(text) {
            return text + "%";
          }
        }
      }
    }
  }]
}
Next, we need the tooltip to show percent, instead of absolute value:
series.tooltipText = "{dateX}: [b]{valueY.changePercent}[/]%";
series.tooltipText = "{dateX}: [b]{valueY.changePercent}[/]%";
{
  // ...
  "series": [{
    "type": "LineSeries",
    // ...
    "tooltipText": "{dateX}: [b]{valueY.changePercent}[/]%"
  }]
}
Example
See the Pen amCharts 4: Using calculated values for plotting series by amCharts team (@amcharts) on CodePen.