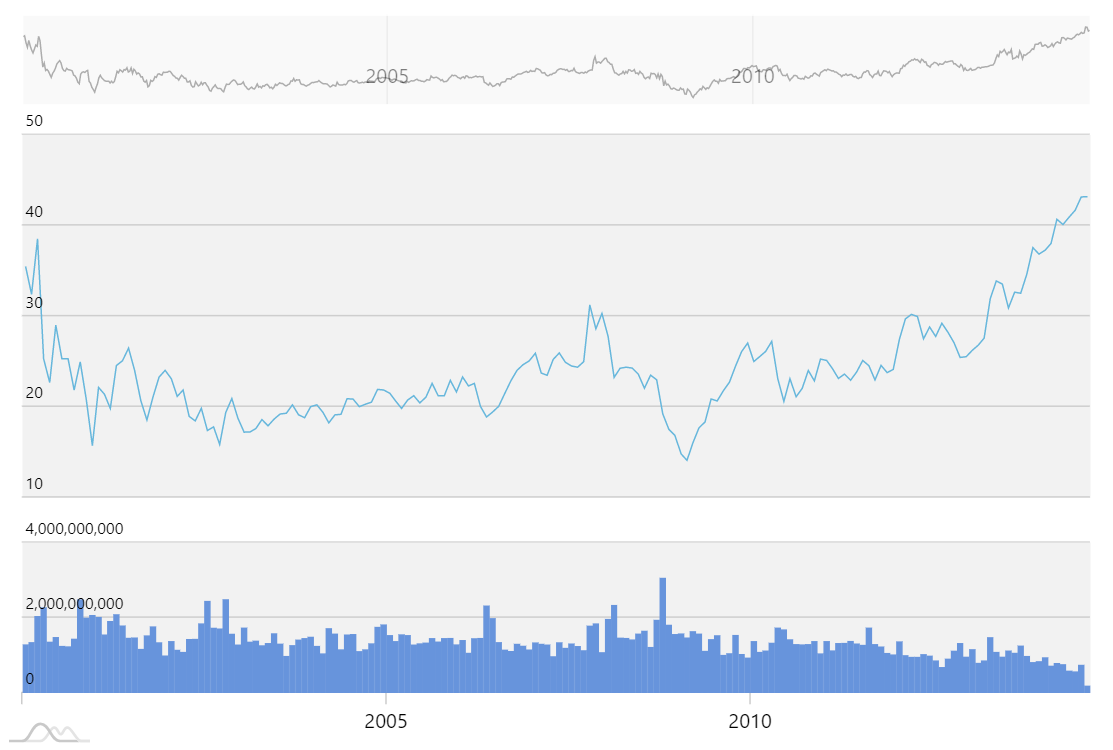
Stock chart
It’s hard to believe but the chart above is a regular XYChart from amCharts 4. What makes it Stock-like is a combination of several cool features: stacked axes, dynamic data item grouping, and ability to load external CSV/JSON data feeds.
Dynamic data item grouping
The chart can automatically group data items into larger periods. This allows displaying massive data sets fast and in such manner that it is easy for the user to view and use.
The data granularity is adjusted automatically, based on current zoom, allowing aggregated zoomed out glance, as well as drill-down to finest detail. All with a single line of code.
Stacked axes
An XYChart can have as many axes as needed in any direction. By default it puts them side-by side. But, with amCharts 4, they can be stacked instead, effectively turning the chart into a multi-panel synced chart.
External data
The chart can load data from external URLs. It has parsers for CSV and JSON formats built-in.
More about external data loading
Range selector
This demo also makes use of Range Selector plugin.
This demo also shows how external controls like period selectors can be implemented and used to control the chart via its API.
Demo source