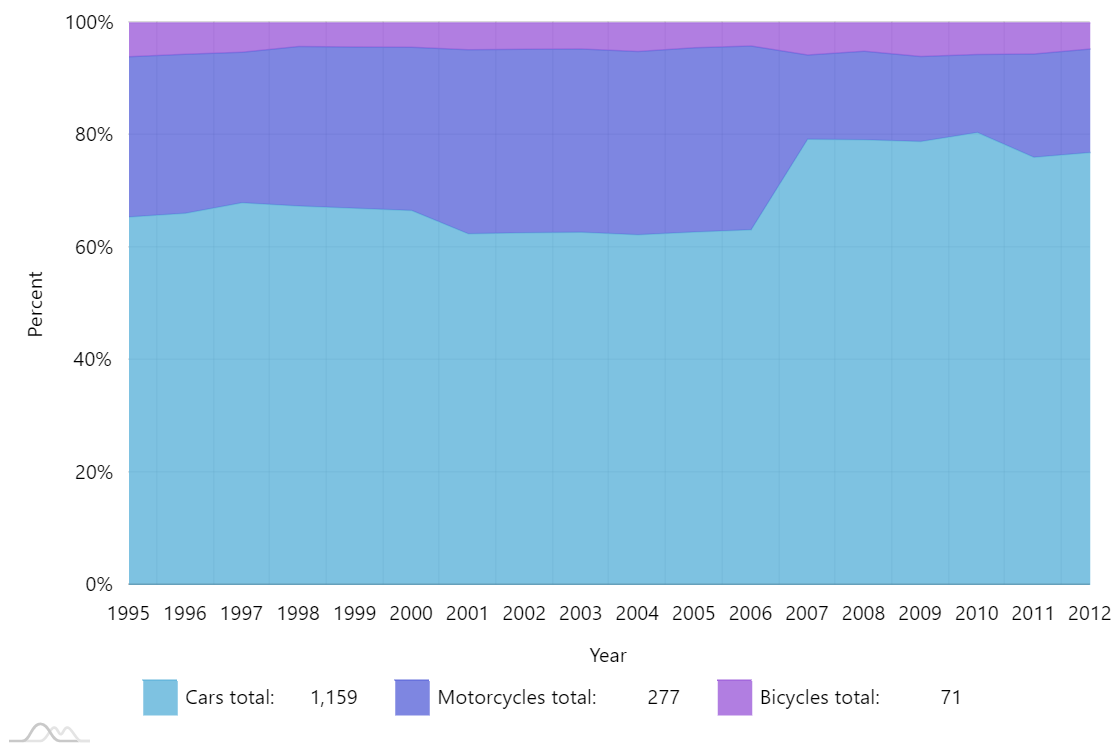
100% stacked area chart
Using calculated values for series
In amCharts 4, Series can be drawn from a variety of auto-calculated values, not necessarily the absolute ones.
In this case, we are setting valueYShow data field to "totalPercent" which is an auto-calculated value, producing a 100% stack chart.
More info about 100% stacks and “show” data fields
HTML tooltips
When displaying a lot of rich information in a tooltip, sometimes SVG is not enough. In those cases, like in this demo, we can opt for an HTML-enabled tooltip, setting tooltipHTML.
Demo source