Tooltips in amCharts 4 can display formatted information thanks to the style formatting and data binding syntax provided by built-in text formatter. However, sometimes we might go even further: use endless formatting possibilities provided by HTML and CSS. This tutorial will explain how.
Base chart
Let's start with a pretty basic chart with multiple line series, a cursor, and a tooltipText set for the last series, that consolidates values from all three series in one tooltip.
The code looks like this:
series3.tooltipText = `[bold]YEAR {categoryX}[/]
----
Cars: {cars}
Motorcycles: {motorcycles}
Bicycles: {bicycles}`;
series3.tooltip.pointerOrientation = "vertical";
series3.tooltipText = `[bold]YEAR {categoryX}[/]
----
Cars: {cars}
Motorcycles: {motorcycles}
Bicycles: {bicycles}`;
series3.tooltip.pointerOrientation = "vertical";
{
  // ...
  "series": [{
    // ...
  }, {
    // ...
  }, {
    // ...
    "tooltipText": `[bold]YEAR {categoryX}[/]
----
Cars: {cars}
Motorcycles: {motorcycles}
Bicycles: {bicycles}`,
    "tooltip": {
      "pointerOrientation": "vertical"
    }
  }]
}
And the end result:
See the Pen amCharts V4: HTML-based tooltip (reference chart) by amCharts (@amcharts) on CodePen.
We get a nice consolidated tooltip once we hover through our chart:
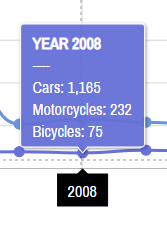
NOTE Please note how we have set pointerOrientation to "vertical". This will place our tooltip directly above the data point, as opposed to the side of it. This will be important in the later sections of this tutorial.
Making tooltip stick to all series
So far we have been adding tooltipHTML (or tooltipText) to a single series, so that regardless of where your cursor is, the tooltip is always attached to a data item on that series.
That creates a problem when that particular series is hidden, e.g. via Legend.
In an attempt to fix that, we might try that we can add tooltipHTML (or tooltipText) to every series. However, that would create another problem - instead of one tooltip we'd have several. Not good.
Luckily, we have a Cursor's setting that will help us - maxTooltipDistance.
In a nutshell, it tells cursor to display tooltip only for the closest series and any other series that are within the pixel range of maxTooltipDistance.
Setting it to -1 will always force just a single tooltip.
chart.cursor.maxTooltipDistance = -1;
chart.cursor.maxTooltipDistance = -1;
{
  // ...
  "cursor": {
    // ...
    "maxTooltipDistance": -1
  }
}
See the Pen amCharts V4: HTML-based tooltip (reference chart) by amCharts team (@amcharts) on CodePen.
Setting HTML content
There was some formatting applied to the SVG text above. But we want to go further and use whole power of HTML/CSS to format our stuff in the tooltip.
Lucky for us, it is possible.
If we set tooltipHTML instead of tooltipText, our tooltip will automatically display that content as HTML.
What's even more cool, we can still use curly bracket placeholders to bind to the data:
series3.tooltipHTML = `<center><strong>YEAR {categoryX}</strong></center>
<hr />
<table>
<tr>
  <th align="left">Cars</th>
  <td>{cars}</td>
</tr>
<tr>
  <th align="left">Motorcycles</th>
  <td>{motorcycles}</td>
</tr>
<tr>
  <th align="left">Bicycles</th>
  <td>{bicycles}</td>
</tr>
</table>
<hr />`;
{
  // ...
  "series": [{
    // ...
  }, {
    // ...
  }, {
    // ...
    "tooltipHTML": `<center><strong>YEAR {categoryX}</strong></center>
<hr />
<table>
<tr>
  <th align="left">Cars</th>
  <td>{cars}</td>
</tr>
<tr>
  <th align="left">Motorcycles</th>
  <td>{motorcycles}</td>
</tr>
<tr>
  <th align="left">Bicycles</th>
  <td>{bicycles}</td>
</tr>
</table>
<hr />`,
    "tooltip": {
      "pointerOrientation": "vertical"
    }
  }]
}
See the Pen amCharts V4: HTML-based tooltip by amCharts (@amcharts) on CodePen.
Congratulations! We now, we have a tooltip with full-fledged HTML in it:
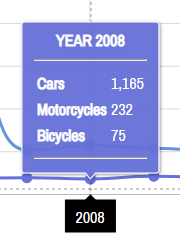
NOTE Remember at the start of this article we mentioned pointer orientation was important? That was because of this interaction thing. Balloon is displayed for the data item that is under cursor. If the tooltip was displayed to the side, we'd try to hover button in it, move over to the next data item, which would cause tooltip to be moved and displayed for the new data item. This effectively would make our tooltip unhoverable.
Adding interactive elements
Now, let's go crazy and add a button into our tooltip. Perhaps we want our users to be able to click on it for more information.
Since we already know contents of our tooltip is HTML, we can go ahead and add an <input> tag and it will just work. Right?
Well, almost.
We'll just need to do one tiny thing. By default all interactions are disabled on tooltips, so that they do not obscure plot area. because of that, any interactive elements, such as buttons, in tooltip won't work.
To fix that we'll just go ahead and re-enable interactions on tooltip's label which is accessible via label property:
series3.tooltip.label.interactionsEnabled = true;
series3.tooltip.label.interactionsEnabled = true;
{
  // ...
  "series": [{
    // ...
  }, {
    // ...
  }, {
    // ...
    "tooltip": {
      "label": {
        "interactionsEnabled": true
      }
    }
  }]
}
Now, the button in our HTML will work.
And, what's even more cool, the onclick events added to the button, will kick in just as well!
Try it on the live example below:
See the Pen amCharts V4: HTML-based tooltip (interactive) by amCharts (@amcharts) on CodePen.
Limitations
That was all fine and nice. Now on to unpleasant stuff.
There are two limitations to the HTML-based tooltips.
- They will not work on Internet Explorer browsers (Edge is fine) and some other really old browsers. The tooltip will try to fall back to the SVG text on those browsers, so you might also want to set
tooltipTextas a means for alternative content. - HTML content will not be exported to image formats. Normally, cursor is hidden (along with its tooltips) when exporting to images. However, if you have some jinga-majinga code that displays tooltip and relies on it to be exported to image, you're in trouble.