Curved columns
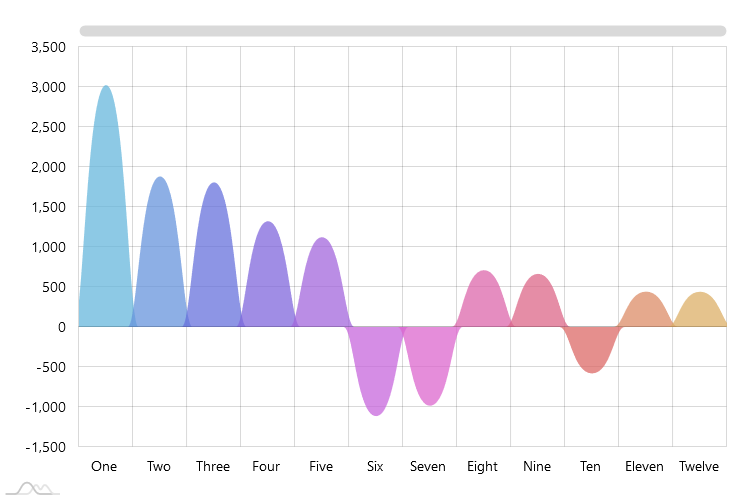
Curved Column Chart (also known as Curved Bar Chart) is a visual variation of a “standard” bar chart. Semantically there’s no difference between regular and curved column chart. The only difference is that columns are displayed in the shape of areas instead of regular rectangles. This gives the chart a fresher visual look while sacrificing clarity a bit, as curves of the columns have no meaning.
Demo source