Dumbbell plot
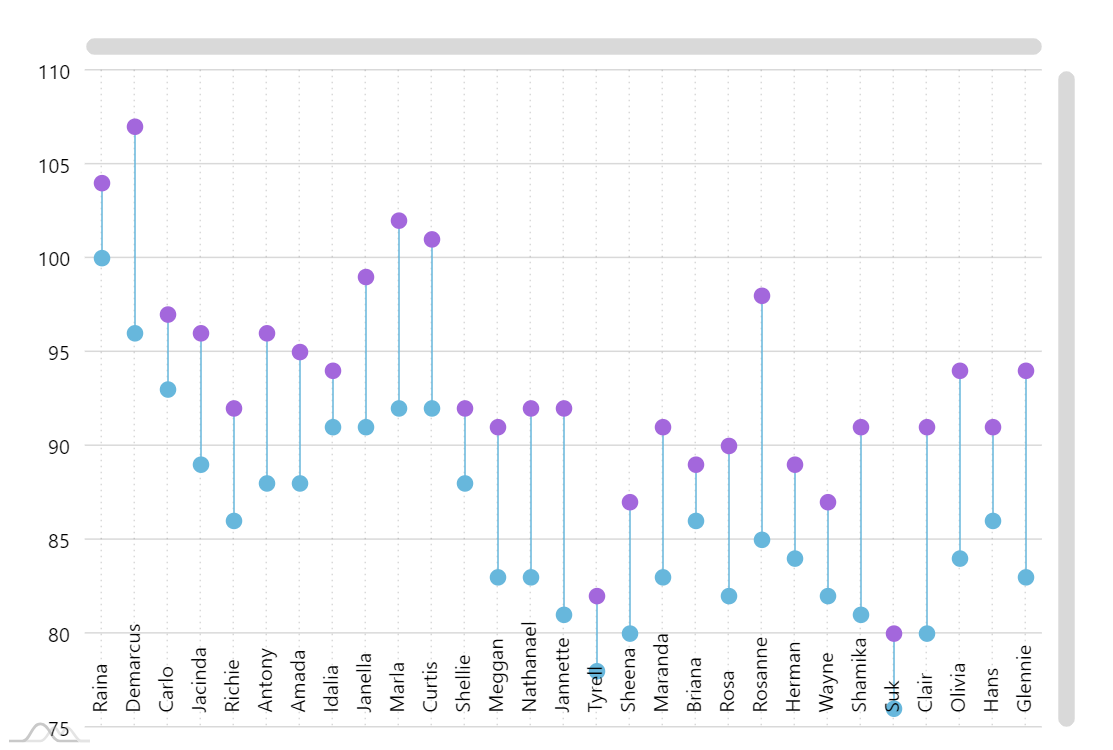
Dumbbell plot (also known as Dumbbell chart, Connected dot plot) is great for displaying changes between two points in time, two conditions or differences between two groups.
See also: Horizontal dumbbell plot demo.
Demo source
Dumbbell plot (also known as Dumbbell chart, Connected dot plot) is great for displaying changes between two points in time, two conditions or differences between two groups.
See also: Horizontal dumbbell plot demo.