Animations Along Lines
amCharts Map Chart has all the tools you need to connect points on a map taking the geography and geometry into account. And then you can even animate objects along those connecting lines.
Key implementation details
We create MapLineSeries to represent our lines. We set it up by providing pointsToConnect. Then we create MapPointSeries to represent the position of our plane. We set it up by setting lineDataItem to our map line series and then we animate positionOnLine.
Related tutorials
Build this chart with AI
The prompt below can be used to build this chart with AI. For best coding results, use the most advanced AI models, like Claude Opus 4.6 and GPT-5.3-Codex. For more info and tips, check out amCharts AI docs.
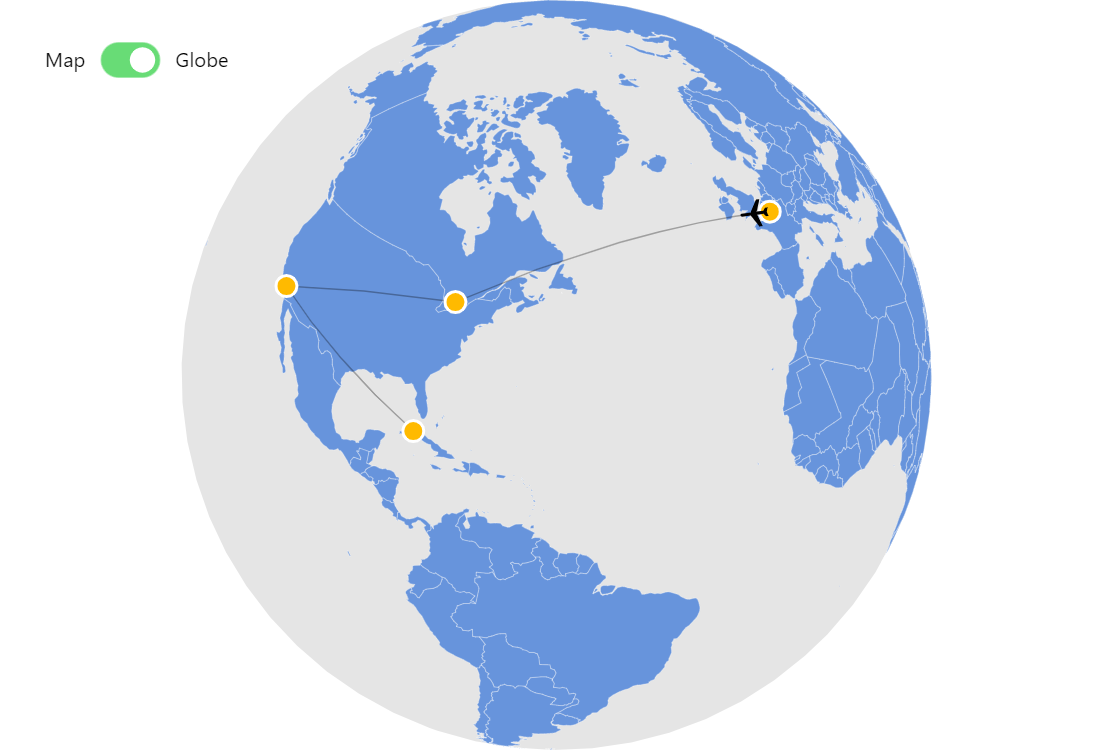
Create an interactive map chart showing animated travel routes between four cities: Paris, Toronto, Los Angeles, and Havana. Draw faint trajectory lines connecting the cities sequentially. Place draggable golden circular markers at each city with 'Drag me!' tooltips. Animate a plane icon along the connecting path in a continuous loop going back and forth. The plane should automatically rotate to align with its travel direction, flipping when reversing. Include a toggle to switch between a flat map and a 3D globe view. Add directional arrows at the midpoints of each trajectory line. Support rotate and pan controls. Animate the chart on load. Use amCharts 5 library.
Demo source