Map line series are used to plot projected lines on the map.
Adding series
To create a map line series we need to call its new() method and push the new object into chart's series list:
let lineSeries = chart.series.push(
  am5map.MapLineSeries.new(root, {
    // ...
  })
);
var lineSeries = chart.series.push(
  am5map.MapLineSeries.new(root, {
    // ...
  })
);
Configuring lines
Appearance
Lines are configured using series' mapLines.template, which can be used to set any MapLine setting.
lineSeries.mapLines.template.setAll({
  stroke: am5.color(0xff0000),
  strokeWidth: 2,
  strokeOpacity: 0.5
});
lineSeries.mapLines.template.setAll({
  stroke: am5.color(0xff0000),
  strokeWidth: 2,
  strokeOpacity: 0.5
});
Line color can also be set directly via polygon series' setting stroke:
let lineSeries = chart.series.push(
  am5map.MapLineSeries.new(root, {
    stroke: am5.color(0x22ff55)
  })
);
var lineSeries = chart.series.push(
  am5map.MapLineSeries.new(root, {
    stroke: am5.color(0x22ff55)
  })
);
Curved or straight
Lines between two points will follow shortest distance, meaning that it will most probably look curved, based on the projection of the map.
This can be configured using lineType setting of the series.
There are two options:
"curved"(default) - follows shortest distance. Can cross -180/180 longitude."straight"- will connect two points with a visually straight line. Will not cross -180/180 longitude.
let lineSeries = chart.series.push(
  am5map.MapLineSeries.new(root, {
    lineType: "straight"
  })
);
var lineSeries = chart.series.push(
  am5map.MapLineSeries.new(root, {
    lineType: "straight"
  })
);

lineType: "curved" (default)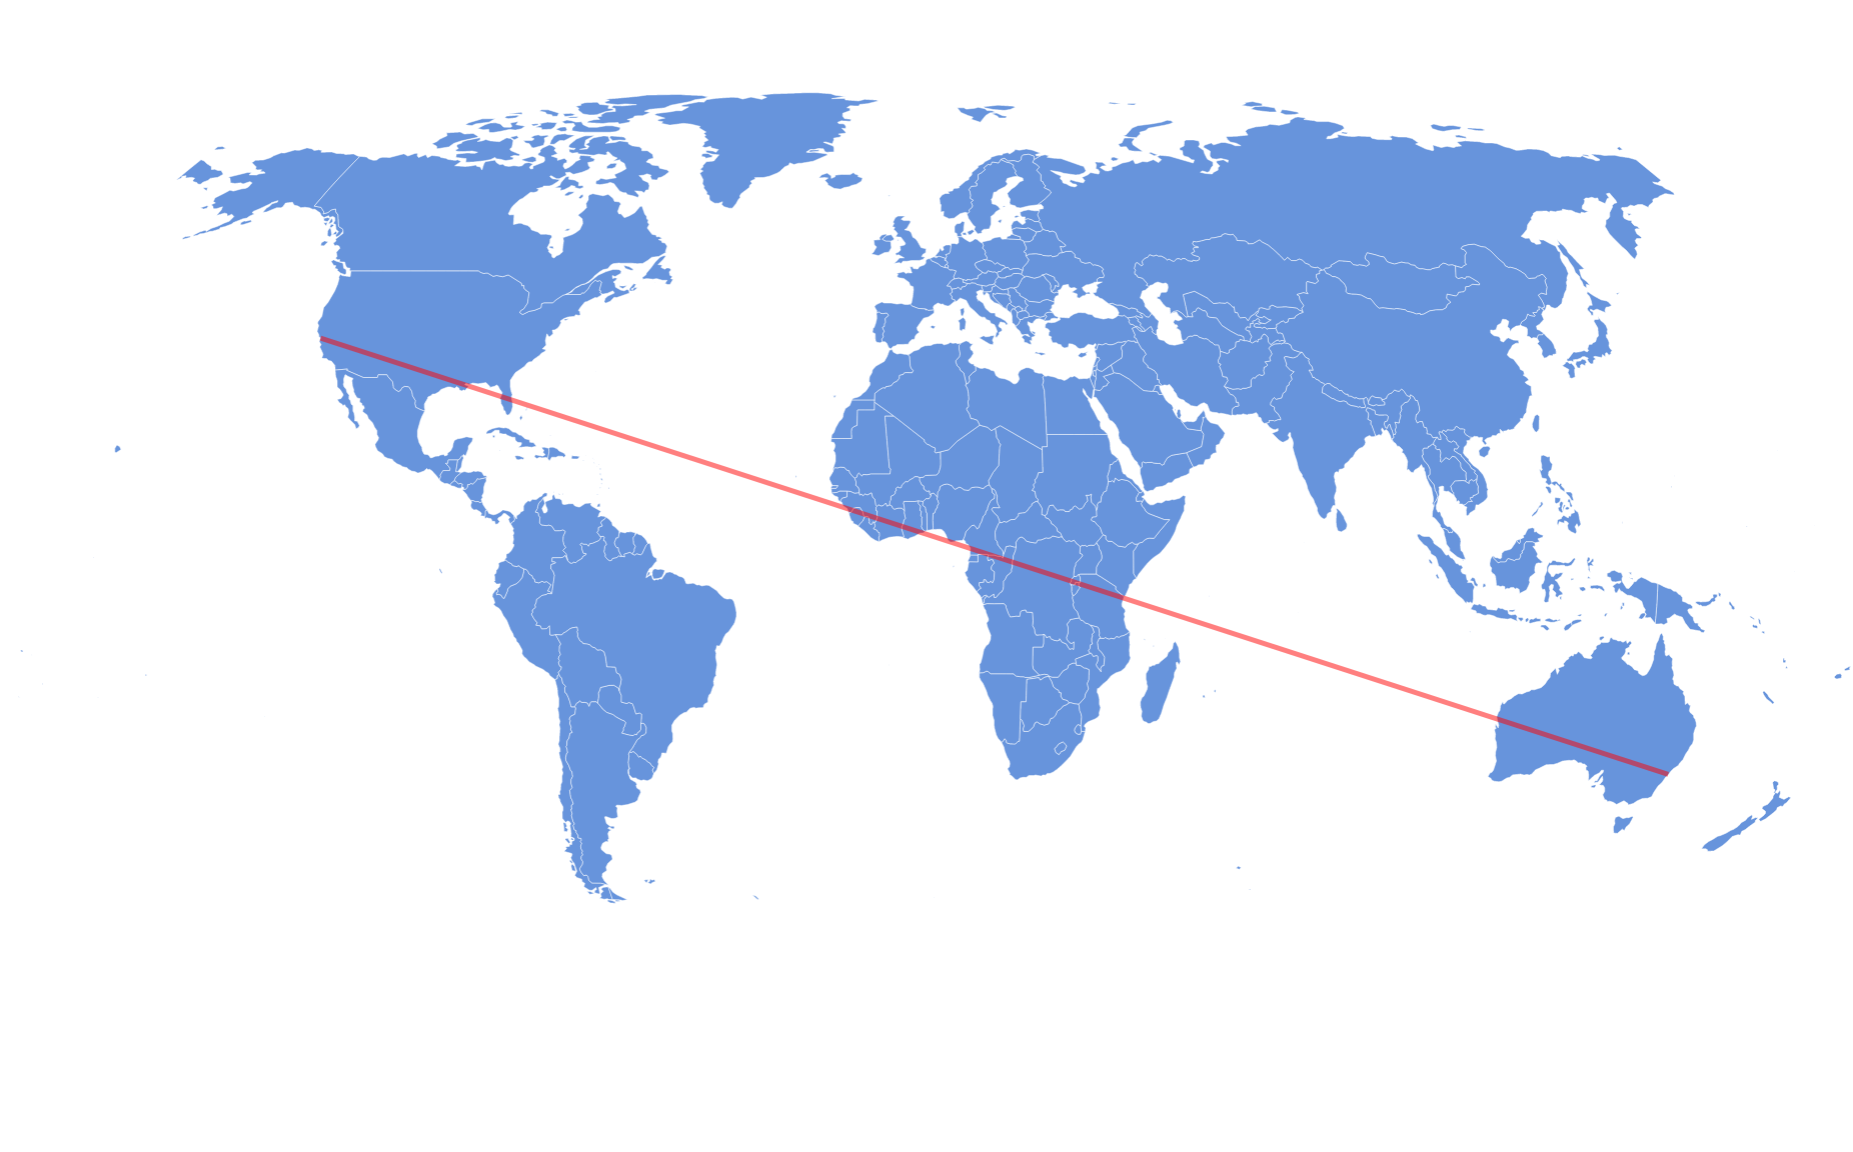
lineType: "straight"Data
There is a number of ways to add data to series. Let's explore them.
GeoJSON
Line series accepts data in GeoJSON format. It will pick out features of type LineString and MultiLineString.
Here's an example of a simple GeoJSON data, depicting flight route: JFK > Heathrow > Beijing.
{
  "type": "FeatureCollection",
  "features": [{
    "type": "Feature",
    "properties": {
    },
    "geometry": {
      "type": "LineString",
      "coordinates": [
        [ -73.778137, 40.641312 ],
        [ -0.454296, 51.470020 ],
        [ 116.597504, 40.072498 ]
      ]
    }
  }]
}
We can set such data directly to series geoJSON property:
let routes = {
  "type": "FeatureCollection",
  "features": [{
    "type": "Feature",
    "properties": {
    },
    "geometry": {
      "type": "LineString",
      "coordinates": [
        [ -73.778137, 40.641312 ],
        [ -0.454296, 51.470020 ],
        [ 116.597504, 40.072498 ]
      ]
    }
  }]
};

// Create line series
let lineSeries = chart.series.push(
  am5map.MapLineSeries.new(root, {
    geoJSON: routes
  })
);
var routes = {
  "type": "FeatureCollection",
  "features": [{
    "type": "Feature",
    "properties": {
    },
    "geometry": {
      "type": "LineString",
      "coordinates": [
        [ -73.778137, 40.641312 ],
        [ -0.454296, 51.470020 ],
        [ 116.597504, 40.072498 ]
      ]
    }
  }]
};

// Create line series
var lineSeries = chart.series.push(
  am5map.MapLineSeries.new(root, {
    geoJSON: routes
  })
);
See the Pen Map with line series by amCharts team (@amcharts) on CodePen.
Plain data
Another way to set data is via series data interface.
Each item in data needs to have at least geometry key in it, that identifies line points. Basically, it's a subset of a GeoJSON format:
lineSeries.data.setAll([{
  "geometry": {
    "type": "LineString",
    "coordinates": [
      [ -73.778137, 40.641312 ],
      [ -0.454296, 51.470020 ],
      [ 116.597504, 40.072498 ]
    ]
  }
}]);
lineSeries.data.setAll([{
  "geometry": {
    "type": "LineString",
    "coordinates": [
      [ -73.778137, 40.641312 ],
      [ -0.454296, 51.470020 ],
      [ 116.597504, 40.072498 ]
    ]
  }
}]);
See the Pen Map with line series by amCharts team (@amcharts) on CodePen.
Individual data items
We can also use series pushDataItem() method to add data lines one-by-one.
The parameter is an object that adheres to IMapLineSeriesDataItem interface.
lineSeries.pushDataItem({
  geometry: {
    type: "LineString",
    coordinates: [
      [ -73.778137, 40.641312 ],
      [ -0.454296, 51.470020 ],
      [ 116.597504, 40.072498 ]
    ]
  }
});
lineSeries.pushDataItem({
  geometry: {
    type: "LineString",
    coordinates: [
      [ -73.778137, 40.641312 ],
      [ -0.454296, 51.470020 ],
      [ 116.597504, 40.072498 ]
    ]
  }
});
See the Pen Mal line and point series used together by amCharts team (@amcharts) on CodePen.
Or, if we have a map line series with points we'd like to connect, we can use pointsToConnect instead of geometry. See "Connecting line series points" section of this tutorial for further info.
Relation to point series
Connecting line series points
We can use actual data items from a map point series as points for the line.
This eliminates the need to define geometry for our lines, as we can use pointsToConnect setting instead, which is an array of map line series' data items:
// Create point series
let pointSeries = chart.series.push(
  am5map.MapPointSeries.new(root, {})
);

let nyc = pointSeries.pushDataItem({ latitude: 40.641312, longitude: -73.778137 });
let london = pointSeries.pushDataItem({ latitude: 51.470020, longitude: -0.454296 });
let beijing = pointSeries.pushDataItem({ latitude: 40.072498, longitude: 116.597504 });

// Create line series
let lineSeries = chart.series.push(
  am5map.MapLineSeries.new(root, {})
);

lineSeries.pushDataItem({
  pointsToConnect: [nyc, london, beijing]
});
// Create point series
var pointSeries = chart.series.push(
  am5map.MapPointSeries.new(root, {})
);

var nyc = pointSeries.pushDataItem({ latitude: 40.641312, longitude: -73.778137 });
var london = pointSeries.pushDataItem({ latitude: 51.470020, longitude: -0.454296 });
var beijing = pointSeries.pushDataItem({ latitude: 40.072498, longitude: 116.597504 });

// Create line series
var lineSeries = chart.series.push(
  am5map.MapLineSeries.new(root, {})
);

lineSeries.pushDataItem({
  pointsToConnect: [nyc, london, beijing]
});
See the Pen Map with line series via data by amCharts team (@amcharts) on CodePen.
Points on a line
This can also work the other way around: we can make a data item form map line series "stick" to any point on a line.
All we have to do is to set lineDataItem to a data item of the specific line, as well as positionOnLine to indicate relative position, when creating a point series data item:
// Create line series
let lineSeries = chart.series.push(
  am5map.MapLineSeries.new(root, {})
);

let route = lineSeries.pushDataItem({
  geometry: {
    type: "LineString",
    coordinates: [
      [ -73.778137, 40.641312 ],
      [ -0.454296, 51.470020 ],
      [ 116.597504, 40.072498 ]
    ]
  }
});

// Create point series
let pointSeries = chart.series.push(
  am5map.MapPointSeries.new(root, {})
);

pointSeries.bullets.push(function() {
  return am5.Bullet.new(root, {
    sprite: am5.Circle.new(root, {
      radius: 5,
      fill: am5.color(0xff0000)
    })
  });
});

let plane = pointSeries.pushDataItem({
  lineDataItem: route,
  positionOnLine: 0.7,
  autoRotate: true
});
// Create line series
var lineSeries = chart.series.push(
  am5map.MapLineSeries.new(root, {})
);

var route = lineSeries.pushDataItem({
  geometry: {
    type: "LineString",
    coordinates: [
      [ -73.778137, 40.641312 ],
      [ -0.454296, 51.470020 ],
      [ 116.597504, 40.072498 ]
    ]
  }
});

// Create point series
var pointSeries = chart.series.push(
  am5map.MapPointSeries.new(root, {})
);

pointSeries.bullets.push(function() {
  return am5.Bullet.new(root, {
    sprite: am5.Circle.new(root, {
      radius: 5,
      fill: am5.color(0xff0000)
    })
  });
});

var plane = pointSeries.pushDataItem({
  lineDataItem: route,
  positionOnLine: 0.7,
  autoRotate: true
});
Let's examine the code above.
The pointSeries.pushDataItem() creates a new point in point (item) series. Normally it would contain a latitude/longitude information, but since we're sticking it to a line, we use different settings:
| Setting key | Comment |
|---|---|
lineDataItem | A data item from map line series. Created with pushDataItem() on a line series, or extracted from series dataItems. |
positionOnLine | Relative position on the line. 0 (zero) means the beginning, and 1 (one) the end. Any intermediate number will indicate relative position along the whole line.In case the line is multi-segmented, the position is calculated from the beginning of the first segment to the end of the last one. |
autoRotate | If set to true, point bullet will be automatically rotated to the angle of the exact point in line. |
autoRotateAngle | If set, this will be added to the angle calculated by autoRotate. Can be used to reverse the direction. |
The below example uses above code, albeit with the slightly more sophisticated image as a point bullet:
See the Pen Map line and point series used together by amCharts team (@amcharts) on CodePen.