A step line series is basically the same thing as line series, except instead of connecting data items with direct lines, it displays a stepped plot using only horizontal and vertical lines.
Creating
Line series is created by instantiating LineSeries object using new() method, and pushing it into chart's series list:
let series = chart.series.push(
  am5xy.StepLineSeries.new(root, {
    name: "Series",
    xAxis: xAxis,
    yAxis: yAxis,
    valueYField: "value",
    valueXField: "date"
  })
);
var series = chart.series.push(
  am5xy.StepLineSeries.new(root, {
    name: "Series",
    xAxis: xAxis,
    yAxis: yAxis,
    valueYField: "value",
    valueXField: "date"
  })
);
Configuring appearance
Since step line series is a version of a line series, it is configured exactly the same way: via strokes.template and fills.template.
Please refer to "Line series: configuring appearance" for details.
Disabling risers
Step line series uses vertical and horizontal lines to plot steps.
To disable vertical lines (risers), we can simply set noRisers setting to true:
let series = chart.series.push(
  am5xy.StepLineSeries.new(root, {
    name: "Series",
    xAxis: xAxis,
    yAxis: yAxis,
    valueYField: "value",
    valueXField: "date",
    noRisers: true
  })
);
var series = chart.series.push(
  am5xy.StepLineSeries.new(root, {
    name: "Series",
    xAxis: xAxis,
    yAxis: yAxis,
    valueYField: "value",
    valueXField: "date",
    noRisers: true
  })
);
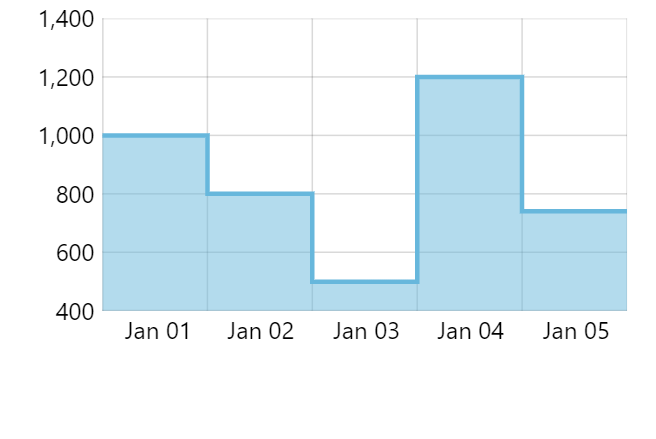
noRisers: false (default)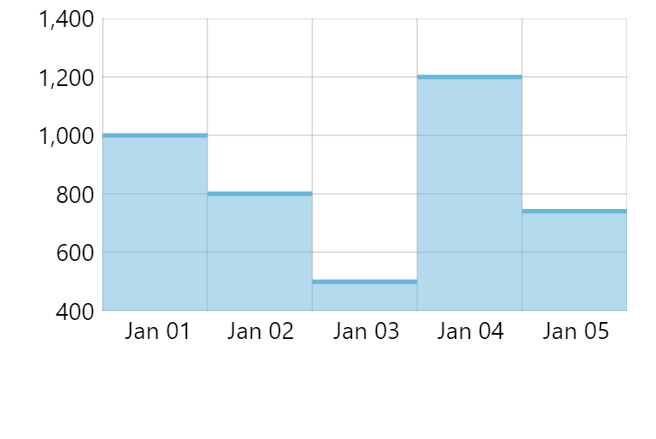
noRisers: trueSee the Pen LineSeries with breaks by amCharts team (@amcharts) on CodePen.
Step width
Steps take up the whole width of the cell.
If we have risers disabled, we can modify actual width of the step using series' stepWidth setting, which is a percent value relative to cell width:
let series = chart.series.push(
  am5xy.StepLineSeries.new(root, {
    name: "Series",
    xAxis: xAxis,
    yAxis: yAxis,
    valueYField: "value",
    valueXField: "date",
    noRisers: true,
    stepWidth: am5.percent(50)
  })
);
var series = chart.series.push(
  am5xy.StepLineSeries.new(root, {
    name: "Series",
    xAxis: xAxis,
    yAxis: yAxis,
    valueYField: "value",
    valueXField: "date",
    noRisers: true,
    stepWidth: am5.percent(50)
  })
);
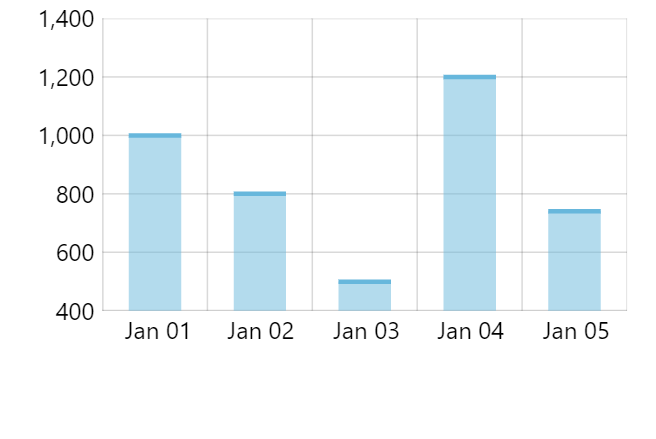
stepWidth: am5.percent(50)Start location
No matter the width of the step, it will be centered within the cell (category or date).
We can use series' locationX setting, to specify where the step starts within the cell, in relation to the center of the step.
It accepts relative numeric values, where 0 (zero) means start of the cell, and 1 (one) means end of the cell.
So, if we'd like our steps to take up half of the cell width, and start at the beginning of the cell, we'd set stepWidth: am5.percent(50) and locationX: 0.25:
let series = chart.series.push(
  am5xy.StepLineSeries.new(root, {
    name: "Series",
    xAxis: xAxis,
    yAxis: yAxis,
    valueYField: "value",
    valueXField: "date",
    noRisers: true,
    stepWidth: am5.percent(50),
    locationX: 0.25
  })
);
var series = chart.series.push(
  am5xy.StepLineSeries.new(root, {
    name: "Series",
    xAxis: xAxis,
    yAxis: yAxis,
    valueYField: "value",
    valueXField: "date",
    noRisers: true,
    stepWidth: am5.percent(50),
    locationX: 0.25
  })
);
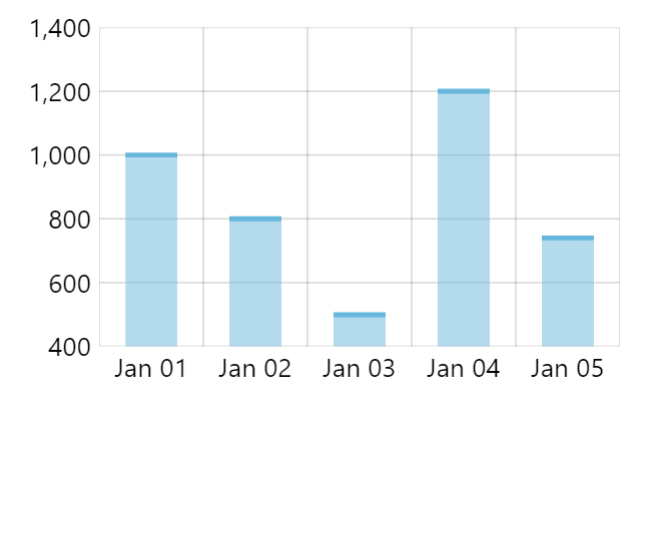
location: 0.5 (default)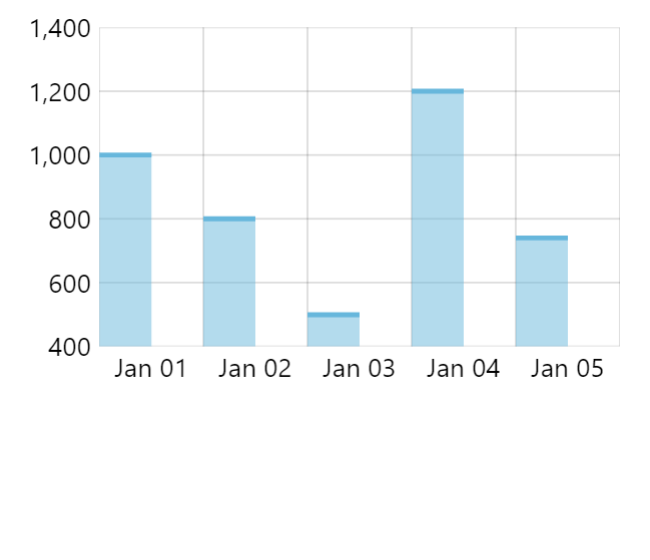
location: 0.25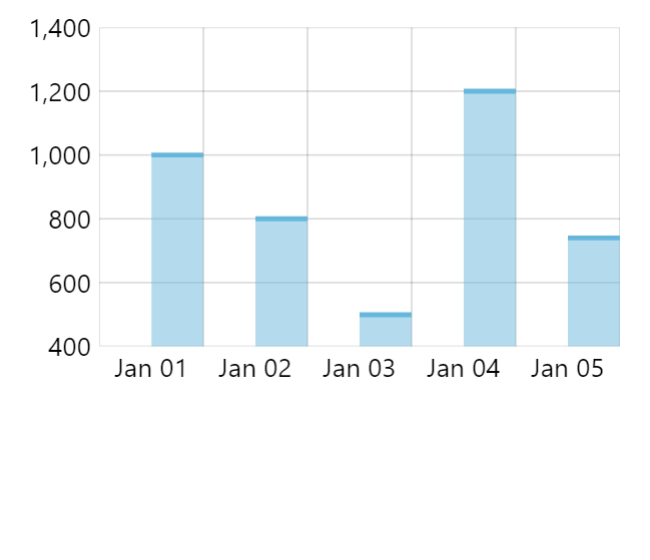
location: 0.75See the Pen StepLineSeries with no risers by amCharts team (@amcharts) on CodePen.